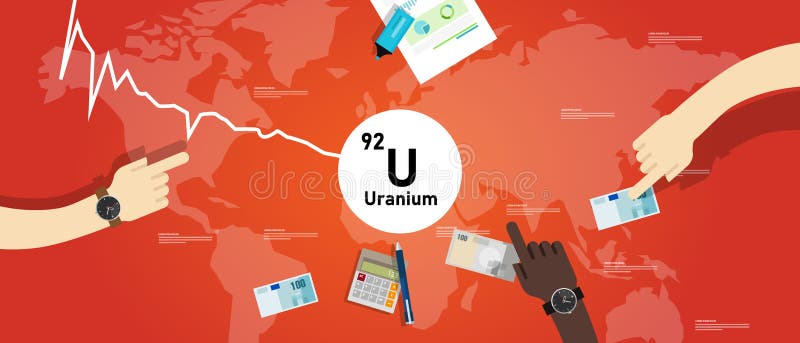
Free with trial Uranium price going down decrease cheaper in metal mineral nuclear commodity market international trading market vector. Cost price decrease vectors Uranium price going down decrease cheaper in metal mineral nuclear commodity market international trading market
Free with trial Cost reduction- decrease rupee icon. Vector symbol isolated on background. Cost price decrease vectors Cost reduction- decrease rupee icon. Vector symbol isolated on background
Free with trial Pink Dollar rate decrease icon isolated on purple-blue background. Cost reduction. Money symbol with down arrow. Business lost crisis decrease. Minimalism concept. 3D render illustration. Cost price decrease illustrations Pink Dollar rate decrease icon isolated on purple-blue background. Cost reduction. Money symbol with down arrow
Free with trial Cost reduction icon price lower arrow. Vector low cost money crisis line icon. Cost price decrease vectors Cost reduction icon price lower arrow. Vector low cost money crisis line icon
Free with trial Carbon emissions cost, co2 gas price in pounds icon, eps 10 file, easy to edit. Cost price decrease vectors Carbon emissions cost, co2 price in pounds icon. carbon emissions cost, co2 gas price in pounds icon, eps 10 file, easy to edit
Free with trial Dollar rate increase. Cost rising icon with money sign and growth arrow. Increase price, higher profit. vector. Cost price decrease vectors Dollar rate increase. Cost rising icon with money sign and growth arrow. Increase price, higher profit. vector
Free with trial Money arrow up and down icon set. Price change symbol. Increase and decrease arrow with dollar sign. Cash currency rate. Stock graph. Income and loss vector illustration. Red and green money arrow set. Cost price decrease vectors Money arrow up and down icon set. Price change symbol. Increase and decrease arrow with dollar sign. Cash currency rate. Stock
Free with trial Image is a digital graphic featuring a blurred background with a person in a dark suit, partially visible, pointing towards the camera. The focus is on the text 'PRICE' in bold, white, uppercase letters, positioned prominently in the center-left of the image. Adjacent to the text is a red downward arrow, enclosed in a square bracket, symbolizing a decrease. The overall color scheme is dark, with. Cost price decrease illustrations Price decrease graphic with businessman. Image is a digital graphic featuring a blurred background with a person in a dark suit, partially visible, pointing. Image is a digital graphic featuring a blurred background with a person in a dark suit, partially visible, pointing towards the camera. The focus is on the text 'PRICE' in bold, white, uppercase letters, positioned prominently in the center-left of the image. Adjacent to the text is a red downward arrow, enclosed in a square bracket, symbolizing a decrease. The overall color scheme is dark, with
Free with trial Increase and decrease dollar price icon vector. Up and down currency value sign symbol. Cost price decrease vectors Increase and decrease dollar price icon. Up and down currency value sign symbol
Free with trial Increase and decrease dollar price icon vector. Up and down currency arrow sign symbol. Cost price decrease vectors Increase and decrease dollar price icon. Up and down currency arrow sign symbol
Free with trial Golden arrow pointing down drips into liquid surface. Falling drop creates ripples and splashes. Oil or fuel price decrease concept economy impact. Cost price decrease illustrations Golden arrow pointing down drips into liquid surface. Falling drop creates ripples and splashes. Oil or fuel price decrease
Free with trial This vector illustration shows various icons representing oil price decline including fuel pump drops gasoline barrel and car with downward arrows symbolizing cost reduction and economic impact calm. Generative AI. Cost price decrease vectors Oil price decline fuel pump drop gasoline barrel cost reduction vector illustration. This vector illustration shows various icons representing oil price decline including fuel pump drops gasoline barrel and car with downward arrows symbolizing cost reduction and economic impact calm. Generative AI
Free with trial This icon represents a decrease in the price of carrots, as depicted by the downward trending chart. Cost price decrease illustrations Decreasing chart showing carrot price decrease icon. This icon represents a decrease in the price of carrots, as depicted by the downward trending chart
Free with trial A graphic illustration featuring three identical green arrows, each prominently displaying a white percentage symbol. The arrows are positioned side-by-side and are all directed downwards, visually representing a decline, reduction, or decrease in a quantifiable metric such as price, value, or performance. The background is a neutral, light gray, ensuring the focus remains on the symbolic arrows. Cost price decrease illustrations Three green arrows with percentage signs pointing downwards symbolizing a decrease in value or price. A graphic illustration featuring three identical green arrows, each prominently displaying a white percentage symbol. The arrows are positioned side-by-side and are all directed downwards, visually representing a decline, reduction, or decrease in a quantifiable metric such as price, value, or performance. The background is a neutral, light gray, ensuring the focus remains on the symbolic arrows.
Free with trial Food prices fluctuate constantly, impacting consumers and businesses alike. This visual representation breaks down the dynamics of these price changes. The upward and downward arrows clearly illustrate cost increases and decreases for various food items. Understanding these trends is crucial for informed decision-making across the entire food supply chain. From farm to fork, the price. Cost price decrease illustrations Food Price Volatility Understanding Cost Increases Decreases and ProfitLoss Implications for the Food Industry. Food prices fluctuate constantly, impacting consumers and businesses alike. This visual representation breaks down the dynamics of these price changes. The upward and downward arrows clearly illustrate cost increases and decreases for various food items. Understanding these trends is crucial for informed decision-making across the entire food supply chain. From farm to fork, the price
Free with trial Grey line Dollar rate decrease icon isolated seamless pattern on white background. Cost reduction. Money symbol with down arrow. Business lost crisis decrease. Vector. Cost price decrease illustrations Grey line Dollar rate decrease icon isolated seamless pattern on white background. Cost reduction. Money symbol with
Free with trial Current market price and expected market price to calculate desired profit and target cost vector. Cost price decrease vectors Current market price and expected market price to calculate desired profit and target cost
Free with trial Frosted glass Dollar rate decrease icon isolated on blue background. Cost reduction. Money symbol with down arrow. Business lost crisis decrease. Square frosted glass button. 3D render illustration. Cost price decrease illustrations Frosted glass Dollar rate decrease icon isolated on blue background. Cost reduction. Money symbol with down arrow
Free with trial Frosted glass Dollar rate decrease icon isolated on blue background. Cost reduction. Money symbol with down arrow. Business lost crisis decrease. Square frosted glass button. 3D render illustration. Cost price decrease illustrations Frosted glass Dollar rate decrease icon isolated on blue background. Cost reduction. Money symbol with down arrow
Free with trial Simple percent decline or low cost price icon. concept of debt sign or recession. simple style trend modern business or gdp logotype graphic art design web element isolated on white background. Cost price decrease vectors Simple percent decline or low cost price icon
Free with trial Cost reduction. Cost increase icon. Price reduced, discount icon. Low total cost icon vector image. Vector illustration isolated on background. Cost price decrease vectors Cost reduction. Cost increase icon. Price reduced, discount icon. Low total cost icon vector image. Vector illustration isolated
Free with trial Cost reduction. Cost increase icon. Price reduced, discount icon. Low total cost icon vector image. Vector illustration isolated on background. Cost price decrease vectors Cost reduction. Cost increase icon. Price reduced, discount icon. Low total cost icon vector image. Vector illustration isolated
Free with trial Cost reduction. Cost increase icon. Price reduced, discount icon. Low total cost icon vector image. Vector illustration isolated on background. Cost price decrease vectors Cost reduction. Cost increase icon. Price reduced, discount icon. Low total cost icon vector image. Vector illustration isolated
Free with trial Cost reduction. Cost increase icon. Price reduced, discount icon. Low total cost icon vector image. Vector illustration isolated on background. Cost price decrease vectors Cost reduction. Cost increase icon. Price reduced, discount icon. Low total cost icon vector image. Vector illustration isolated
Free with trial Cost reduction. Cost increase icon. Price reduced, discount icon. Low total cost icon vector image. Vector illustration isolated on background. Cost price decrease vectors Cost reduction. Cost increase icon. Price reduced, discount icon. Low total cost icon vector image. Vector illustration isolated
Free with trial Cost reduction. Cost increase icon. Price reduced, discount icon. Low total cost icon vector image. Vector illustration isolated on background. Cost price decrease vectors Cost reduction. Cost increase icon. Price reduced, discount icon. Low total cost icon vector image. Vector illustration isolated
Free with trial Cost reduction. Cost increase icon. Price reduced, discount icon. Low total cost icon vector image. Vector illustration isolated on background. Cost price decrease vectors Cost reduction. Cost increase icon. Price reduced, discount icon. Low total cost icon vector image. Vector illustration isolated
Free with trial Cost Reduction Vector Illustration featuring Decreasing Expenses, Price Minimization, and Falling Profit Rates in Business with a Flat Background. Cost price decrease vectors Cost Reduction Vector Illustration featuring Decreasing Expenses, Price Minimization, and Falling Profit Rates in Business
Free with trial Cost Reduction Vector Illustration featuring Decreasing Expenses, Price Minimization, and Falling Profit Rates in Business with a Flat Background. Cost price decrease vectors Cost Reduction Vector Illustration featuring Decreasing Expenses, Price Minimization, and Falling Profit Rates in Business
Free with trial Cost Reduction Vector Illustration featuring Decreasing Expenses, Price Minimization, and Falling Profit Rates in Business with a Flat Background. Cost price decrease vectors Cost Reduction Vector Illustration featuring Decreasing Expenses, Price Minimization, and Falling Profit Rates in Business
Free with trial Cost Reduction Vector Illustration featuring Decreasing Expenses, Price Minimization, and Falling Profit Rates in Business with a Flat Background. Cost price decrease vectors Cost Reduction Vector Illustration featuring Decreasing Expenses, Price Minimization, and Falling Profit Rates in Business
Free with trial Cost Reduction Vector Illustration featuring Decreasing Expenses, Price Minimization, and Falling Profit Rates in Business with a Flat Background. Cost price decrease vectors Cost Reduction Vector Illustration featuring Decreasing Expenses, Price Minimization, and Falling Profit Rates in Business
Free with trial Cost Reduction Vector Illustration featuring Decreasing Expenses, Price Minimization, and Falling Profit Rates in Business with a Flat Background. Cost price decrease vectors Cost Reduction Vector Illustration featuring Decreasing Expenses, Price Minimization, and Falling Profit Rates in Business
Free with trial Cost Reduction Vector Illustration featuring Decreasing Expenses, Price Minimization, and Falling Profit Rates in Business with a Flat Background. Cost price decrease vectors Cost Reduction Vector Illustration featuring Decreasing Expenses, Price Minimization, and Falling Profit Rates in Business
Free with trial Cost Reduction Vector Illustration featuring Decreasing Expenses, Price Minimization, and Falling Profit Rates in Business with a Flat Background. Cost price decrease vectors Cost Reduction Vector Illustration featuring Decreasing Expenses, Price Minimization, and Falling Profit Rates in Business
Free with trial Reverse Inflation and fix the cost of living conceptual image, price tags with arrow going up then down. Cost price decrease illustrations Price tags with arrow going up then down, reverse Inflation and fix the cost of living concept. reverse Inflation and fix the cost of living conceptual image, price tags with arrow going up then down
Free with trial White Dollar rate decrease icon isolated with long shadow background. Cost reduction. Money symbol with down arrow. Business lost crisis decrease. Pink hexagon button. Vector. Cost price decrease illustrations White Dollar rate decrease icon isolated with long shadow background. Cost reduction. Money symbol with down arrow
Free with trial Reverse Inflation and fix the cost of living conceptual image, price tags with arrows going up and down. Cost price decrease illustrations Price tags with arrows going up then down, reverse Inflation and fix the cost of living concept. reverse Inflation and fix the cost of living conceptual image, price tags with arrows going up and down
Free with trial Reverse Inflation and fix the cost of living conceptual image, price tag with arrow going down over shopping basket. Cost price decrease illustrations Price tag with arrow going down over shopping basket, reverse Inflation and fix the cost of living concept. reverse Inflation and fix the cost of living conceptual image, price tag with arrow going down over shopping basket
Free with trial Reverse Inflation and fix the cost of living conceptual image, price tag with arrow going down. Cost price decrease illustrations Price tag with arrow going down, reverse Inflation and fix the cost of living concept. reverse Inflation and fix the cost of living conceptual image, price tag with arrow going down
Free with trial Reverse Inflation and fix the cost of living conceptual image, price tag with arrow going down. Cost price decrease illustrations Price tag with arrow going down, reverse Inflation and fix the cost of living concept. reverse Inflation and fix the cost of living conceptual image, price tag with arrow going down
Free with trial Cost meter RGB color icon. Money coin, price. Finance, economics. Increase and decrease arrows. Efficiency, performance. Isolated vector illustration. Simple filled line drawing. Editable stroke. Cost price decrease vectors Cost meter RGB color icon
Free with trial Colorful Dollar rate decrease icon isolated on white background. Cost reduction. Money symbol with down arrow. Business lost crisis decrease. Minimalism concept. 3D render illustration. Cost price decrease illustrations Colorful Dollar rate decrease icon isolated on white background. Cost reduction. Money symbol with down arrow. Business
Free with trial Colorful Dollar rate decrease icon isolated on white background. Cost reduction. Money symbol with down arrow. Business lost crisis decrease. Minimalism concept. 3D render illustration. Cost price decrease illustrations Colorful Dollar rate decrease icon isolated on white background. Cost reduction. Money symbol with down arrow. Business
Free with trial Colorful Dollar rate decrease icon isolated on white background. Cost reduction. Money symbol with down arrow. Business lost crisis decrease. Minimalism concept. 3D render illustration. Cost price decrease illustrations Colorful Dollar rate decrease icon isolated on white background. Cost reduction. Money symbol with down arrow. Business
Free with trial Colorful Dollar rate decrease icon isolated on white background. Cost reduction. Money symbol with down arrow. Business lost crisis decrease. Minimalism concept. 3D render illustration. Cost price decrease illustrations Colorful Dollar rate decrease icon isolated on white background. Cost reduction. Money symbol with down arrow. Business
Free with trial Carbon emissions cost icon, co2 gas price in pounds, eps 10 file, easy to edit. Cost price decrease vectors Carbon emissions cost icon, co2 price in pounds. carbon emissions cost icon, co2 gas price in pounds, eps 10 file, easy to edit
Free with trial Vector icon illustration of price increase decrease (price fluctuation. Cost price decrease vectors Vector icon illustration of price increase decrease (price fluctuation
Free with trial Yen weak and yen strong icon set. yen price rise and yen price decrease. vector. Cost price decrease illustrations Yen weak and yen strong icon set. yen price rise and yen price decrease.
Free with trial Cost low and loss. Decrease revenue. Crisis of economy. Icon of money inflation. Cost price decrease vectors Cost low and loss. Decrease revenue. Crisis of economy.
Free with trial Gold Dollar rate decrease icon isolated on white background. Cost reduction. Money symbol with down arrow. Business lost crisis decrease. Vector. Cost price decrease illustrations Gold Dollar rate decrease icon isolated on white background. Cost reduction. Money symbol with down arrow. Business lost
Free with trial Reverse Inflation and fix the cost of living conceptual image, deflation price tag with shopping basket. Cost price decrease illustrations Deflation price tag with shopping basket, reverse Inflation and fix the cost of living concept. reverse Inflation and fix the cost of living conceptual image, deflation price tag with shopping basket
Free with trial Increase and decrease dollar price icon isolated on white background. Rise and fall currency value sign symbol vector. Cost price decrease vectors Increase and decrease dollar price icon isolated on white background. Rise and fall currency value sign symbol
Free with trial Reverse Inflation and fix the cost of living conceptual image, reverse Inflation text with arrow going backward and labels with percentage of decrease. Cost price decrease illustrations Reverse Inflation text with arrow going backward and labels with percentage of decrease, fix the cost of living concept. reverse Inflation and fix the cost of living conceptual image, reverse Inflation text with arrow going backward and labels with percentage of decrease
Free with trial Set of cost symbol yuan increase and decrease icon. Money vector symbol isolated on background. Cost price decrease vectors Set of cost symbol yuan increase and decrease icon. Money vector symbol isolated on background
Free with trial Set of cost symbol pound increase and decrease icon. Money vector symbol isolated on background. Cost price decrease vectors Set of cost symbol pound increase and decrease icon. Money vector symbol isolated on background
Free with trial Percentage rate arrow icon set. Percent arrow up and down symbol. Price increase and decrease vector illustration. Profit sign. Up and down arrows with percentage pictogram. Financial growth concept. Cost price decrease vectors Percentage rate arrow icon set. Percent arrow up and down symbol. Price increase and decrease vector illustration. Profit sign. Up
Free with trial Frosted glass Dollar rate decrease icon isolated on blue background. Cost reduction. Money symbol with down arrow. Business lost crisis decrease. Square frosted glass button. 3D render illustration. Cost price decrease illustrations Frosted glass Dollar rate decrease icon isolated on blue background. Cost reduction. Money symbol with down arrow
Free with trial Frosted glass Dollar rate decrease icon isolated on white background. Cost reduction. Money symbol with down arrow. Business lost crisis decrease. Minimalism concept. 3D render illustration. Cost price decrease illustrations Frosted glass Dollar rate decrease icon isolated on white background. Cost reduction. Money symbol with down arrow
Free with trial Pink Dollar rate decrease icon isolated on purple-blue background. Cost reduction. Money symbol with down arrow. Business lost crisis decrease. Minimalism concept. 3D render illustration. Cost price decrease illustrations Pink Dollar rate decrease icon isolated on purple-blue background. Cost reduction. Money symbol with down arrow
Free with trial Cost reduction. Cost increase icon. Price reduced, discount icon. Low total cost icon vector image. Vector illustration isolated on background. Cost price decrease vectors Cost reduction. Cost increase icon. Price reduced, discount icon. Low total cost icon vector image. Vector illustratio
Free with trial Cost reduction. Cost increase icon. Price reduced, discount icon. Low total cost icon vector image. Vector illustration isolated on background. Cost price decrease vectors Cost reduction. Cost increase icon. Price reduced, discount icon. Low total cost icon vector image. Vector illustratio
Free with trial Cost reduction. Cost increase icon. Price reduced, discount icon. Low total cost icon vector image. Vector illustration isolated on background. Cost price decrease vectors Cost reduction. Cost increase icon. Price reduced, discount icon. Low total cost icon vector image. Vector illustratio
Free with trial Cost reduction. Cost increase icon. Price reduced, discount icon. Low total cost icon vector image. Vector illustration isolated on background. Cost price decrease vectors Cost reduction. Cost increase icon. Price reduced, discount icon. Low total cost icon vector image. Vector illustratio
Free with trial Cost reduction. Cost increase icon. Price reduced, discount icon. Low total cost icon vector image. Vector illustration isolated on background. Cost price decrease vectors Cost reduction. Cost increase icon. Price reduced, discount icon. Low total cost icon vector image. Vector illustratio
Free with trial Cost reduction. Cost increase icon. Price reduced, discount icon. Low total cost icon vector image. Vector illustration isolated on background. Cost price decrease vectors Cost reduction. Cost increase icon. Price reduced, discount icon. Low total cost icon vector image. Vector illustratio
Free with trial Cost reduction. Cost increase icon. Price reduced, discount icon. Low total cost icon vector image. Vector illustration isolated on background. Cost price decrease vectors Cost reduction. Cost increase icon. Price reduced, discount icon. Low total cost icon vector image. Vector illustratio
Free with trial Cost reduction. Cost increase icon. Price reduced, discount icon. Low total cost icon vector image. Vector illustration isolated on background. Cost price decrease vectors Cost reduction. Cost increase icon. Price reduced, discount icon. Low total cost icon vector image. Vector illustratio
Free with trial Cost reduction. Cost increase icon. Price reduced, discount icon. Low total cost icon vector image. Vector illustration isolated on background. Cost price decrease vectors Cost reduction. Cost increase icon. Price reduced, discount icon. Low total cost icon vector image. Vector illustratio
Free with trial Cost reduction. Cost increase icon. Price reduced, discount icon. Low total cost icon vector image. Vector illustration isolated on background. Cost price decrease vectors Cost reduction. Cost increase icon. Price reduced, discount icon. Low total cost icon vector image. Vector illustratio
Free with trial Cost reduction. Cost increase icon. Price reduced, discount icon. Low total cost icon vector image. Vector illustration isolated on background. Cost price decrease vectors Cost reduction. Cost increase icon. Price reduced, discount icon. Low total cost icon vector image. Vector illustratio
Free with trial Cost reduction. Cost increase icon. Price reduced, discount icon. Low total cost icon vector image. Vector illustration isolated on background. Cost price decrease vectors Cost reduction. Cost increase icon. Price reduced, discount icon. Low total cost icon vector image. Vector illustratio
Free with trial Cost reduction. Cost increase icon. Price reduced, discount icon. Low total cost icon vector image. Vector illustration isolated on background. Cost price decrease vectors Cost reduction. Cost increase icon. Price reduced, discount icon. Low total cost icon vector image. Vector illustratio
Free with trial Cost reduction. Cost increase icon. Price reduced, discount icon. Low total cost icon vector image. Vector illustration isolated on background. Cost price decrease vectors Cost reduction. Cost increase icon. Price reduced, discount icon. Low total cost icon vector image. Vector illustratio
Free with trial Currency Exchange. Currency exchange rate icon. Stock market. Cost reduction. Cost increase icon. Price reduced, discount icon. Financial or business sign vector. Cost price decrease vectors Currency Exchange. Currency exchange rate icon. Stock market. Cost reduction. Cost increase icon. Price reduced, discount icon.
Free with trial Currency Exchange. Currency exchange rate icon. Stock market. Cost reduction. Cost increase icon. Price reduced, discount icon. Financial or business sign vector. Cost price decrease vectors Currency Exchange. Currency exchange rate icon. Stock market. Cost reduction. Cost increase icon. Price reduced, discount icon.
Free with trial Currency Exchange. Currency exchange rate icon. Stock market. Cost reduction. Cost increase icon. Price reduced, discount icon. Financial or business sign vector. Cost price decrease vectors Currency Exchange. Currency exchange rate icon. Stock market. Cost reduction. Cost increase icon. Price reduced, discount icon.
Free with trial Currency Exchange. Currency exchange rate icon. Stock market. Cost reduction. Cost increase icon. Price reduced, discount icon. Financial or business sign vector. Cost price decrease vectors Currency Exchange. Currency exchange rate icon. Stock market. Cost reduction. Cost increase icon. Price reduced, discount icon.
Free with trial Currency Exchange. Currency exchange rate icon. Stock market. Cost reduction. Cost increase icon. Price reduced, discount icon. Financial or business sign vector. Cost price decrease vectors Currency Exchange. Currency exchange rate icon. Stock market. Cost reduction. Cost increase icon. Price reduced, discount icon.
Free with trial Currency Exchange. Currency exchange rate icon. Stock market. Cost reduction. Cost increase icon. Price reduced, discount icon. Financial or business sign vector. Cost price decrease vectors Currency Exchange. Currency exchange rate icon. Stock market. Cost reduction. Cost increase icon. Price reduced, discount icon.