Free with trial Stock market forecast downfall vision to see future economic crisis or market crash concept panic businessman investor look through telescope to see stock market red downward bearish graph. Covid decrease vectors Stock market forecast downfall vision to see future economic crisis or market crash concept panic businessman investor look. Stock market forecast downfall vision to see future economic crisis or market crash concept panic businessman investor look through telescope to see stock market red downward bearish graph
Free with trial Ncov 2019 covid 19 coronavirus with double exposure of blurry falling financial graphs and planet hologram. Concept of global financial crisis due to coronavirus pandemic. 3d rendering. Covid decrease illustrations Coronavirus and global financial crisis concept. Ncov 2019 covid 19 coronavirus with double exposure of blurry falling financial graphs and planet hologram. Concept of global financial crisis due to coronavirus pandemic. 3d rendering
Free with trial Downward statistical arrow for the financial and labor crisis. 3D Rendering. Covid decrease illustrations Financial crisis due to the virus that caused the pandemic. 3D Rendering. Downward statistical arrow for the financial and labor crisis. 3D Rendering
Free with trial Negative impact on global economy because coronavirus quarantine. COVID-19 outbreak on correction stock market background. Fall of trade market and economy. World financial crisis illustration. Covid decrease illustrations Negative impact on global economy because coronavirus quarantine. COVID-19 outbreak on correction stock market background. Fall of
Free with trial Global gross domestic product plunge from COVID-19 virus fear, world investment price fall down or collapse from outbreak of Coronavirus, GDP economy graph chart fall down from Virus pathogen impact. Covid decrease vectors Global gross domestic product plunge from COVID-19 virus fear, world investment price fall down or collapse from outbreak of. Global gross domestic product plunge from COVID-19 virus fear, world investment price fall down or collapse from outbreak of Coronavirus, GDP economy graph chart fall down from Virus pathogen impact
Free with trial Stock Markets plunge from COVID-19 virus fear, 3D rendering. Covid decrease illustrations Stock Markets plunge from COVID-19 virus fear
Free with trial Covid-19 or Corona virus global market impacts. Business concept economy graph chart down because of covid-19, corona virus. Stock market crisis red price arrow down chart fall. Covid decrease vectors Covid-19 or Corona virus global market impacts. Business concept economy graph chart down because of covid-19, corona virus
Free with trial Coronavirus crisis 2020. Coronacrisis. Conceptual visualization of a recession due to a virus. Covid-19 pandemic is affecting the global economy. Corona virus weakens economy. Vector illustration. Covid decrease vectors Coronavirus crisis 2020. Coronacrisis. Conceptual visualization of a recession due to a virus. Covid-19 pandemic is affecting the
Free with trial Collapse sign on economy background - graph and coins. Financial crash in world economy because of coronavirus. Global economic crisis, recession. Coronavirus pandemic, COVID-19 outbreak in the world. Covid decrease illustrations Collapse sign on economy background - graph and coins
Free with trial Ncov 2019 covid 19 coronavirus with double exposure of blurry falling financial graphs. Concept of financial crisis due to coronavirus pandemic. 3d rendering. Covid decrease illustrations Coronavirus and financial stock market crisis. Ncov 2019 covid 19 coronavirus with double exposure of blurry falling financial graphs. Concept of financial crisis due to coronavirus pandemic. 3d rendering
Free with trial Text Small business crashed by red coronavirus sketch and falling graphs over grey wall background. Concept of financial crisis due to 2019 ncov coronavirus pandemic. 3d rendering. Covid decrease illustrations Small business crash due to covid 19 coronavirus. Text Small business crashed by red coronavirus sketch and falling graphs over grey wall background. Concept of financial crisis due to 2019 ncov coronavirus pandemic. 3d rendering
Free with trial Financial Stock Market Crisis During Coronavirus. Covid decrease illustrations Coronavirus And Financial Stock Market Crisis. Financial Stock Market Crisis During Coronavirus
Free with trial Vector banner infographics economic crisis. Editable stroke. Line icons stock market crash health unemployment recession economic bubble bank run inflation currency crisis. Covid decrease vectors Vector banner infographics economic crisis. Editable stroke. Line icons stock market crash health unemployment recession economic
Free with trial Global economic impact due to coronavirus pandemic red background. Covid decrease illustrations Global economic impact due to coronavirus pandemic red background
Free with trial Monochrome simple temperature body icon set vector illustration. Collection linear logo for measuring checking heat isolated on white. Thermometer, pyrometer device for disease diagnostic. Healthcare. Covid decrease vectors Monochrome simple temperature body icon set vector illustration measuring checking heat. Monochrome simple temperature body icon set vector illustration. Collection linear logo for measuring checking heat isolated on white. Thermometer, pyrometer device for disease diagnostic. Healthcare
Free with trial Isometric global finance crisis concept. Global economy crash. Unemployment, jobless and employee job reduction metaphor. Covid decrease vectors Isometric global finance crisis concept. Global economy crash. Unemployment, jobless and employee job reduction metaphor
Free with trial Hand drawn Cartoon man without mask watching a world map with small viral epidemic points. Covid decrease vectors Cartoon man without mask watching a world map with small viral epidemic points
Free with trial Business concept vector illustration of business challenge and optimism during pandemic, business infographic. Covid decrease vectors Business challenge and optimism during pandemic
Free with trial Federal Reserve low interest rate or central bank with long time zero percent interest rate until economic recover concept, businessman FED leader using hammer to nailed percentage sign to the floor. Covid decrease illustrations Federal Reserve low interest rate or central bank with long time zero percent interest rate until economic recover concept
Free with trial Economy Falling, Financial Crisis and Stock Price Drop Crash due to Coronavirus Outbreak. Businessman Trader in Despair Sitting at Table Front of Computer. Cash Loss Chart and Graph Arrow Downfall. Covid decrease vectors Financial Crisis Economy Crash due to Coronavirus. Economy Falling, Financial Crisis and Stock Price Drop Crash due to Coronavirus Outbreak. Businessman Trader in Despair Sitting at Table Front of Computer. Cash Loss Chart and Graph Arrow Downfall
Free with trial Downturn chart with a virus on the green background. Eps 10 vector file. Covid decrease vectors Corona Virus Downturn Worldwide Chart Header. Downturn chart with a virus on the green background. Eps 10 vector file
Free with trial Economic crisis and money loss icons, downturn and bankruptcy symbols, line vector. World financial crisis and global economy recession icons of business bankruptcy, finance downturn and unemployment. Covid decrease vectors Economic crisis and money loss icons of downturn. Economic crisis and money loss icons, downturn and bankruptcy symbols, line vector. World financial crisis and global economy recession icons of business bankruptcy, finance downturn and unemployment
Free with trial Coronavirus pathogen impact bar graph falling and collapse on business people. Covid decrease vectors Coronavirus caused the global economy to collapse concept. Coronavirus pathogen impact bar graph falling and collapse on business people
Free with trial Stressed young businessman sitting in blurry office and panicking because of economical crisis due to coronavirus pandemic. Toned image double exposure. Covid decrease illustrations Businessman panics, coronavirus and economy crisis. Stressed young businessman sitting in blurry office and panicking because of economical crisis due to coronavirus pandemic. Toned image double exposure
Free with trial The impact Coronavirus on the oil prices. Pandemic have a direct negative impact on the oil price shock. Covid decrease vectors The impact COVID-19 on the oil prices. The impact Coronavirus on the oil prices. Pandemic have a direct negative impact on the oil price shock.
Free with trial Automatic water tap icon. Electronic and touchless automatic faucet that allows to drastically decrease water consumption. Linear black and RGB color styles. Isolated vector illustrations. Covid decrease vectors Automatic water tap icon
Free with trial Activated platelets, also known as thrombocytes, blood cells responsible for the healing and closure of wounds, 3D illustration. Covid decrease illustrations Activated platelets, also known as thrombocytes, blood cells responsible for the healing and closure of wounds
Free with trial Illustration of Global Financial Crisis, Currencies Falling Down Financial Recession. Covid decrease vectors Global Financial Crisis Illustration, Currencies Falling Down. Illustration of Global Financial Crisis, Currencies Falling Down Financial Recession
Free with trial Exhausted man with headache looking worried at his laptop while working at the office as financial analyst or accountant. Covid decrease vectors Exhausted man working as financial analyst. Exhausted man with headache looking worried at his laptop while working at the office as financial analyst or accountant
Free with trial Economic crisis Well-crafted Pixel Perfect Vector Thin Line Icons 30 2x Grid for Web Graphics and Apps. Simple Minimal Pictogram. Covid decrease vectors Economic crisis Well-crafted Pixel Perfect Vector Thin Line Icons
Free with trial People protect savings from coronavirus epidemic outbreak vector flat illustration. Young woman and man in protective masks hold gold coins in hands. Umbrella against the rain of covid-19 cells. Covid decrease vectors People protect savings from coronavirus epidemic outbreak vector flat illustration. Woman and man hold coins in hands. People protect savings from coronavirus epidemic outbreak vector flat illustration. Young woman and man in protective masks hold gold coins in hands. Umbrella against the rain of covid-19 cells.
Free with trial The graph shows that the stock market price rises. But when the coronavirus or covid 19 outbreak caused the stock price to fall and affect worldwide. Use a magnifying glass to point the coronavirus. Covid decrease vectors The graph shows that the stock market price rises
Free with trial Coronavirus impact on global economy, stock market, business crisis, cute virus character with finance chart, arow drops down, concept of bankruptcy because of covid-19 pandemic, vector illustration. Covid decrease vectors Coronavirus impact on global economy, stock market, business crisis, cute virus character with finance chart, arow down. Coronavirus impact on global economy, stock market, business crisis, cute virus character with finance chart, arow drops down, concept of bankruptcy because of covid-19 pandemic, vector illustration
Free with trial Financial downturn, arrow recession economy, finance crisis, business down, loss, stock, design, flat style vector illustration. Economic slump, depression decline success, low growth company. Covid decrease vectors Financial downturn, arrow recession economy, finance crisis, business down, loss, stock, design, flat style vector
Free with trial Multiple viruses in a shopping cart - impact on the economy. Covid decrease illustrations Impact of COVID-19 on the economy 3D rendering. Multiple viruses in a shopping cart - impact on the economy
Free with trial Global Economic Crisis coronavirus covid19 virus background flat in modern color design concept. Eps 10 vector. Covid decrease vectors Global Economic Crisis coronavirus covid19 virus background flat in modern color design concept. Eps 10 vector
Free with trial This abstract texture background graphic is high definition and a great quality pattern that can be used for various purposes. Covid decrease illustrations Stock Market Crash of Red Arrow Graph Going Down Into Recession - Abstract Background Texture. This abstract texture background graphic is high definition and a great quality pattern that can be used for various purposes.
Free with trial Activated platelets, also known as thrombocytes, blood cells responsible for the healing and closure of wounds, 3D illustration. Covid decrease illustrations Activated platelets, also known as thrombocytes, blood cells responsible for the healing and closure of wounds
Free with trial Global Economic Recession, Dollar Currencies Falling Down epic recession investment. Covid decrease illustrations Global Economic Recession, Dollar Falling Down. Global Economic Recession, Dollar Currencies Falling Down epic recession investment
Free with trial Inflation icon line. Simple element economic crisis symbol for templates, web design and infographics. Covid decrease vectors Inflation icon. Monochrome simple line Economic Crisis icon for templates, web design and infographics. Inflation icon line. Simple element economic crisis symbol for templates, web design and infographics.
Free with trial Critical condition RGB color icon. Intermittent mandatory ventilation. Artificial respiration. Emergency. Resuscitation. Isolated vector illustration. Simple filled line drawing. Editable stroke. Covid decrease vectors Critical condition RGB color icon
Free with trial Cryptocurrency and coronavirus, pandemic impact on the cryptocurrency market. 3D virus bacterium with graphs and charts and indicators of the fall in the value of Bitcoin and other cryptocurrencies. Covid decrease vectors Cryptocurrency and coronavirus
Free with trial Angry Cartoon businessman kicking year 2020 isolated vector illustration. financial business disaster Concept. Covid decrease vectors Angry Cartoon businessman kicking year 2020 isolated vector illustration. financial business disaster Concept
Free with trial The concept of a fall in stocks due to the new coronavirus 2019-nCov. World financial crisis and business losses due to virus COVID-2019. Flat vector illustration. Covid decrease vectors The concept of a fall in stocks due to the new coronavirus 2019-nCov. World financial crisis and business losses due to
Free with trial 2019 ncov coronavirus sketch and falling graph over blurry dark blue background. Financial and stock market crash concept. 3d rendering. Covid decrease illustrations Coronavirus 2019 ncov stock market crisis. 2019 ncov coronavirus sketch and falling graph over blurry dark blue background. Financial and stock market crash concept. 3d rendering
Free with trial Activated and non-activated platelets, thrombocytes, 3D illustration. Activated thrombocytes have cell membrane projections on the surface, unactivated platelets are biconvex discoid, or lens-shaped. Covid decrease illustrations Activated and non-activated platelets, 3D illustration. Activated and non-activated platelets, thrombocytes, 3D illustration. Activated thrombocytes have cell membrane projections on the surface, unactivated platelets are biconvex discoid, or lens-shaped
Free with trial Activated and non-activated platelets, thrombocytes, 3D illustration. Activated thrombocytes have cell membrane projections on the surface, unactivated platelets are biconvex discoid, or lens-shaped. Covid decrease illustrations Activated and non-activated platelets, 3D illustration. Activated and non-activated platelets, thrombocytes, 3D illustration. Activated thrombocytes have cell membrane projections on the surface, unactivated platelets are biconvex discoid, or lens-shaped
Free with trial Activated and non-activated platelets, thrombocytes, 3D illustration. Activated thrombocytes have cell membrane projections on the surface, unactivated platelets are biconvex discoid, or lens-shaped. Covid decrease illustrations Activated and non-activated platelets, 3D illustration. Activated and non-activated platelets, thrombocytes, 3D illustration. Activated thrombocytes have cell membrane projections on the surface, unactivated platelets are biconvex discoid, or lens-shaped
Free with trial Small business and coronavirus sketch and falling graphs over cityscape background. Concept of financial crisis due to 2019 ncov coronavirus pandemic. 3d rendering toned image double exposure. Covid decrease illustrations Coronavirus small business financial crisis. Small business and coronavirus sketch and falling graphs over cityscape background. Concept of financial crisis due to 2019 ncov coronavirus pandemic. 3d rendering toned image double exposure
Free with trial Oil price infographic with barrels and balance vector illustration design. Covid decrease vectors Oil price infographic with barrels and balance
Free with trial Small business crashed by red coronavirus sketch over dark blue background. Concept of financial crisis due to 2019 ncov coronavirus pandemic. 3d rendering. Covid decrease illustrations Coronavirus small business financial crash. Small business crashed by red coronavirus sketch over dark blue background. Concept of financial crisis due to 2019 ncov coronavirus pandemic. 3d rendering
Free with trial Downward trend concept illustration on white background. Covid decrease illustrations Asia continent map with falling arrow. Financial stagnation, recession, crisis, business crash, stock markets down, economic colla. Downward trend concept illustration on white background
Free with trial Businessman to climb Crossing over in number 2022 concept, start up, begining over pass financial problem, survive and win in Coronavirus outbreak COVID-19 economic crisis. vector illustration. Covid decrease illustrations Businessman to climb Crossing over in number 2022 concept, start up, begining over pass financial problem, survive and win in
Free with trial Image is generated with the use of an AI. Covid decrease illustrations Crisis 19 covid recession financial evaluation negative down showing hand arrow Holding. image is generated with the use of an AI
Free with trial Air pollution has decreased since the coronavirus quarantine concept. Covid decrease vectors Air pollution has decreased since the coronavirus quarantine concept
Free with trial Crisis. Graphs and charts templates. Business infographics. Statistic and data, bankruptcy, financial crisis, money loss, down arrow, economy reduction. Financial chart. Vector illustration. Covid decrease illustrations Crisis. Graphs and charts templates. Business infographics.
Free with trial 3D Isometric Flat Vector Illustration of Global Economic Crash, Entrepreneur Declares Bankruptcy And Shuts Down Company. Covid decrease vectors 3D Isometric Flat Vector Illustration of Global Economic Crash
Free with trial Impact of Pandemic on Business with People in Crisis Vector Set. Man and Woman Suffer Coronavirus Market Risk. Covid decrease vectors Impact of Pandemic on Business with People in Crisis Vector Set
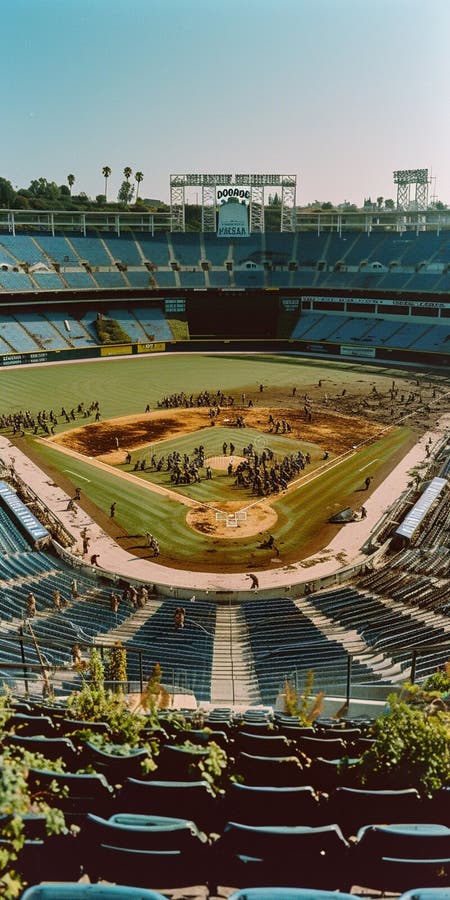
Free with trial A baseball stadium, devoid of spectators, showcases rows of empty seats as the game unfolds on the field. The lack of fans creates an eerie scene in the usually bustling venue. Covid decrease illustrations Sparse Attendance at Baseball Stadium. A baseball stadium, devoid of spectators, showcases rows of empty seats as the game unfolds on the field. The lack of fans creates an eerie scene in the usually bustling venue.
Free with trial The image shows a red line graph sharply decreasing against a backdrop of a city skyline. A light blue line graph also shows a downward trend. Several stylized coronavirus illustrations are superimposed on the image. The overall color palette is cool toned, with the red graph line providing a stark contrast. The style is graphic and illustrative, suggesting a visual representation of economic, generated by AI. Covid decrease illustrations Red Decreasing Stock Market Graph Cityscape Coronavirus. The image shows a red line graph sharply decreasing against a backdrop of a city skyline. A light blue line graph also shows a downward trend. Several stylized coronavirus illustrations are superimposed on the image. The overall color palette is cool toned, with the red graph line providing a stark contrast. The style is graphic and illustrative, suggesting a visual representation of economic, generated by AI.
Free with trial 3d render. Abstract blue holographic infographic with world map, abstract graphs of, columns or bars around which coronaviruses like covid-19 fly. Numbers over columns, beautiful. Covid decrease illustrations 3d render. Abstract blue holographic infographic with world map, abstract graphs of, columns or bars around which
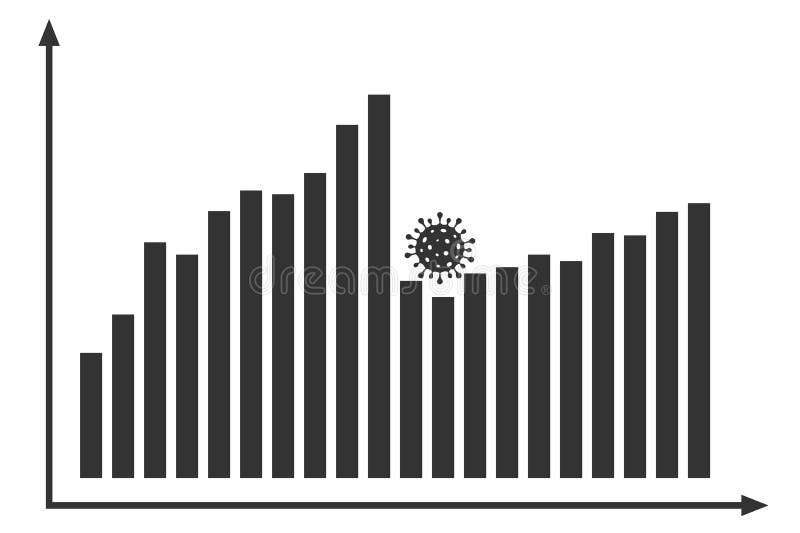
Free with trial Graph with covid decrease report. Diagram with coronavirus recession and bankruptcy progress. Vector illustration. Covid decrease vectors Graph with covid decrease report. Diagram with coronavirus recession and bankruptcy progress. Vector
Free with trial Graph with covid decrease report. Diagram with coronavirus recession and bankruptcy progress. Vector illustration. Covid decrease vectors Graph with covid decrease report. Diagram with coronavirus recession and bankruptcy progress. Vector
Free with trial Graph with covid decrease report. Diagram with coronavirus recession and bankruptcy progress. Vector illustration. Covid decrease vectors Graph with covid decrease report. Diagram with coronavirus recession and bankruptcy progress
Free with trial Graph with covid decrease report. Diagram with coronavirus recession and bankruptcy progress. Vector illustration. Covid decrease vectors Graph with covid decrease report. Diagram with coronavirus recession and bankruptcy progress
Free with trial Stock market graph decrease due to COVID-19 pandemic. Vector illustration. Covid decrease vectors Stock market graph decrease due to COVID-19 pandemic
Free with trial Economic impact by COVID-19 lockdown, GDP and company revenue decrease from global Coronavirus crash concept, sad businessman sitting on bird cage lock with decline bar graph inside and virus pathogen. Covid decrease illustrations Economic impact by COVID-19 lockdown, GDP and company revenue decrease from global Coronavirus crash concept, sad businessman
Free with trial Decrease in coronavirus statistics. Victory over covid-19. Blue banner with infographic Progress bar with coronavirus molecule with gold colors. Covid decrease vectors Decrease in coronavirus statistics. Victory over covid-19. Progress bar with coronavirus molecule. Decrease in coronavirus statistics. Victory over covid-19. Blue banner with infographic Progress bar with coronavirus molecule with gold colors
Free with trial Icon cartoon flat of social distancing will decrease risk of infection COVID-19. Don`t recommended to do non-social distance while contact with others people. Keep isolate to save yourself. Covid decrease illustrations Icon cartoon flat of social distancing will decrease risk of infection COVID-19.
Free with trial Covid-19 and tourism graph on blackboard. Tourists decrease during pandemic flu concept. Hand drawing in Chalkboard. Covid decrease illustrations Covid-19 and tourism graph on blackboard. Tourists decrease during pandemic flu concept. Hand drawing in Chalkboard
Free with trial 3D render of the decrease in the incidence of the Delta covid-19 variant. Medical concept of life-threatening Covid-19 coronavirus outbreak. Illustration of a digital image for medicine. Covid decrease illustrations 3D render of the decrease in the incidence of the Delta covid-19 variant.
Free with trial 3D render of the decrease in incidence during the second and third waves of covid-19 with an downward arrow and coronavirus. Digital image illustration. Covid decrease illustrations 3D render of the decrease in incidence during the second and third waves of covid-19 with an downward arrow and coronavirus.
Free with trial 3D render of the decrease in incidence during the second and third waves of covid-19 with an downward arrow and coronavirus. Digital image illustration. Covid decrease illustrations 3D render of the decrease in incidence during the second and third waves of covid-19 with an downward arrow and coronavirus.
Free with trial Covid-19 horseshoe magnet pulling graph to decrease. Coronavirus pandemic, economic crisis, recession and investment concept. Flat design. EPS 8 vector illustration, no transparency, no gradients. Covid decrease vectors Covid-19 magnet, recession. Covid-19 horseshoe magnet pulling graph to decrease. Coronavirus pandemic, economic crisis, recession and investment concept. Flat design. EPS 8 vector illustration, no transparency, no gradients
Free with trial Online Shopping. Social Distancing, Keeping Distance for Decrease Infection Risk For Prevent Virus Covid-19. Food Delivery. Stay Home on Quarantine During Coronavirus Epidemic. Flat Vector Illustration. Covid decrease vectors Online Shopping.Social Distancing, Keeping Distance for Decrease Infection Risk For Prevent Virus Covid-19. Food Delivery. Stay Ho
Free with trial Corona covid-19 virus infections decrease when vaccine is available - injection into chart bar numbers decrease Vector illustration. Covid decrease vectors Corona Covid-19 virus infections decrease when vaccine available injection chart. Corona covid-19 virus infections decrease when vaccine is available - injection into chart bar numbers decrease Vector illustration
Free with trial Economy crisis with graph or chart decrease down because or corona covid-19 concept with modern flat style vector. Covid decrease illustrations Economy crisis with graph or chart decrease down because or corona covid-19 concept with modern flat style
Free with trial Economic crisis and coronavirus, icon set. Global financial crisis due to COVID-19 virus infection, warning sign set. Stock drop, decrease market trade and transactions, economic panic and depression. Covid decrease vectors Economic crisis and coronavirus, icon set. Global financial crisis due to COVID-19 virus infection, warning sign set