Free with trial Vertical collage picture young woman arrow recession falling down bankruptcy golden coins currency tokens drawing background. Currency decrease illustrations Vertical collage picture young woman arrow recession falling down bankruptcy golden coins currency tokens drawing
Free with trial Colorful Financial growth decrease icon isolated on white background. Increasing revenue. Minimalism concept. 3D render illustration. Currency decrease illustrations Colorful Financial growth decrease icon isolated on white background. Increasing revenue. Minimalism concept. 3D render
Free with trial Colorful Dollar rate decrease icon isolated on white background. Cost reduction. Money symbol with down arrow. Business lost crisis decrease. Minimalism concept. 3D render illustration. Currency decrease illustrations Colorful Dollar rate decrease icon isolated on white background. Cost reduction. Money symbol with down arrow. Business
Free with trial Set line Money payment transfer, Financial growth decrease, Dollar symbol and ATM and money icon. Vector. Currency decrease vectors Set line Money payment transfer, Financial growth decrease, Dollar symbol and ATM and money icon. Vector
Free with trial This image features multiple percentage decrease icons, symbolizing rate reduction, financial loss, and economic downturn, presented in a minimalist design on white. Currency decrease vectors Vector art of multiple percentage decrease icons, , representing rate reduction, financial loss, and economic downturn in a. This image features multiple percentage decrease icons, symbolizing rate reduction, financial loss, and economic downturn, presented in a minimalist design on white
Free with trial Currency exchange rate is fluctuating showing dollar gaining value while euro is decreasing. Currency decrease vectors Dollar growing while euro is decreasing showing currency exchange rate. Currency exchange rate is fluctuating showing dollar gaining value while euro is decreasing
Free with trial Financial decrease concept with stacked gold coins and a red arrow pointing down, clearly labeled with word decrease. Represents falling value, investment loss, and economic downturn. Decline of wealth. Currency decrease illustrations Stack Of Gold Coins With Red Down Arrow Indicating Decrease In Financial Value. Financial decrease concept with stacked gold coins and a red arrow pointing down, clearly labeled with word decrease. Represents falling value, investment loss, and economic downturn. Decline of wealth
Free with trial Decreasing stacks of gold coins with red arrow pointing down and word Decrease. Economic recession concept. Business decline. Financial crisis. Market crash. Investment loss. Currency decrease illustrations Decreasing stacks of gold coins with red arrow pointing down and word Decrease
Free with trial Financial market crash concept with red arrow down and gold coins pile, economic crisis and investment loss, currency value drop and inflation risk, recession and money bankruptcy symbol on black. Generative AI. Currency decrease illustrations Financial market crash concept with red arrow down and gold coins pile economic crisis and investment loss currency value drop. Financial market crash concept. Financial market crash concept with red arrow down and gold coins pile, economic crisis and investment loss, currency value drop and inflation risk, recession and money bankruptcy symbol on black. Generative AI
Free with trial Stacks of gold coins decrease in height towards the right. Sun sets over water reflecting warm light on metal money. Financial decline concept, money value loss, empty pockets economic. Currency decrease illustrations Stacks of gold coins decrease in height towards the right. Sun sets over water reflecting warm light on metal money. Financial
Free with trial Set Drop in crude oil price, Credit card and Dollar rate decrease. Business infographic template. Vector. Currency decrease illustrations Set Drop in crude oil price, Credit card and Dollar rate decrease. Business infographic template. Vector
Free with trial Global economy slowdown economic recession crisis inflation finance business market decline percent arrow coins stack decrease financial risk. Generative AI. Currency decrease illustrations Global economy slowdown economic recession crisis inflation finance business market decline percent arrow coins stack decrease
Free with trial Red arrow with "DECREASE" text pointing down alongside stacks of gold coins. Symbolizes financial downturn, economic challenges, and declining investment returns. Business slump. Currency decrease illustrations Red arrow with Decrease text pointing down with stacks of gold coins financial downturn. Red arrow with "DECREASE" text pointing down alongside stacks of gold coins. Symbolizes financial downturn, economic challenges, and declining investment returns. Business slump
Free with trial A neon dollar sign with an arrow pointing down symbolizes financial loss, economic downturn, or decrease in value. The design is modern and visually striking. Currency decrease vectors Vector art of neon dollar sign pointing down, symbolizing financial loss, economic downturn, or decrease in value with a modern. A neon dollar sign with an arrow pointing down symbolizes financial loss, economic downturn, or decrease in value. The design is modern and visually striking
Free with trial Set Broken piggy bank, Dollar rate decrease, and Global economic crisis icon. Vector. Currency decrease illustrations Set Broken piggy bank, Dollar rate decrease, and Global economic crisis icon. Vector
Free with trial Set Dollar rate decrease, , Mobile stock trading and Drop crude oil price. Business infographic template. Vector. Currency decrease illustrations Set Dollar rate decrease, , Mobile stock trading and Drop crude oil price. Business infographic template. Vector
Free with trial Set Storm, Pie chart infographic, Debt ball chained coin and Dollar rate decrease. Business infographic template. Vector. Currency decrease vectors Set Storm, Pie chart infographic, Debt ball chained coin and Dollar rate decrease. Business infographic template. Vector
Free with trial Red arrow going down stock icon on white background. Decrease, Bankruptcy, financial market crash icon for your web site design, logo, app, UI. graph chart downtrend symbol. chart going down sign. Currency decrease vectors Red arrow going down stock icon on white background. Decrease, Bankruptcy, financial market crash icon
Free with trial Money increase and decrease icons. Low or high total cost icon. Price, sale, rate or profit going up or down symbol with arrow and dollar sign. Vector illustration. Currency decrease vectors Money increase and decrease icons. Low or high total cost icon. Price, sale, rate or profit going up or down symbol
Free with trial Money increase and decrease icons. Low or high total cost icon. Price, sale, rate or profit going up or down symbol with arrow and dollar sign. Vector illustration. Currency decrease vectors Money increase and decrease icons. Low or high total cost icon. Price, sale, rate or profit going up or down symbol
Free with trial Magnifying glass showing falling dollar currency value with red downward arrow for finance and business concepts. Currency decrease vectors Magnifying glass showing falling dollar currency value with red downward arrow
Free with trial Set Drop in crude oil price, Dollar rate decrease, Safe and on seamless pattern. Vector. Currency decrease illustrations Set Drop in crude oil price, Dollar rate decrease, Safe and on seamless pattern. Vector
Free with trial Trend to go down chart solid icon, world sanction concept. Vector graphics. Dollar currency graph, market pressure sign on white background, style mobile or design. Currency decrease vectors Trend to go down chart solid icon, world sanction concept. Vector graphics. Dollar currency graph, market pressure sign
Free with trial Filled outline Financial growth decrease icon isolated on white background. Increasing revenue. Flat filled outline style with shadow. Vector. Currency decrease vectors Filled outline Financial growth decrease icon isolated on white background. Increasing revenue. Flat filled outline
Free with trial Stacks of golden coins with red lightning bolt. Financial crisis recession income decrease. Money value declining. Economic downturn symbol. Investment loss concept on wooden table. Currency decrease illustrations Stacks of golden coins with a red lightning bolt symbolizing financial crisis recession income decrease. Stacks of golden coins with red lightning bolt. Financial crisis recession income decrease. Money value declining. Economic downturn symbol. Investment loss concept on wooden table
Free with trial Filled outline Financial growth decrease icon isolated on white background. Increasing revenue. Vector. Currency decrease vectors Filled outline Financial growth decrease icon isolated on white background. Increasing revenue. Vector
Free with trial Vertical poster collage young man golden coin crack break separated tokens dollar currency finance earnings profit income. Currency decrease illustrations Vertical poster collage young man golden coin crack break separated tokens dollar currency finance earnings profit
Free with trial Set Glass money jar with coin Safe Global economic crisis Dollar rate decrease Credit card and Drop crude oil price icon. Vector. Currency decrease illustrations Set Glass money jar with coin, Safe, Global economic crisis, Dollar rate decrease, Credit card and Drop crude oil price
Free with trial Generated with the use of AI. Fading Currency Hourglass: DEFLATION Over Trickling Bills. Currency decrease illustrations Fading Currency Hourglass DEFLATION Over Trickling Bills. Generated with the use of AI. Fading Currency Hourglass: DEFLATION Over Trickling Bills
Free with trial FED wording with up and down arrow on USD dollar banknote for Federal reserve increase and decrease interest rate control which effect to America and world economic growth concept. Currency decrease illustrations FED wording with up and down arrow on USD dollar banknote for Federal reserve increase and decrease interest rate control which
Free with trial Vertical collage young shocked girl freelancer economy money recession direction falling trader investing loss currency profit. Currency decrease illustrations Vertical collage young shocked girl freelancer economy money recession direction falling trader investing loss currency
Free with trial Stacked gold coins with a red arrow showing decrease. Concept of falling economy, financial crisis, inflation, bankruptcy, investment, decline, and economic downturn. Currency decrease illustrations Stacked gold coins red arrow showing decrease concept of falling economy financial crisis inflation bankruptcy investment. Stacked gold coins with a red arrow showing decrease. Concept of falling economy, financial crisis, inflation, bankruptcy, investment, decline, and economic downturn
Free with trial Trend to go down chart line icon, world sanction concept. Vector graphics. Dollar currency graph, market pressure sign on white background, outline style icon for mobile or web design. Currency decrease vectors Trend to go down chart line icon, world sanction concept. Vector graphics. Dollar currency graph, market pressure sign
Free with trial Trend to go down chart thin line icon, world sanction concept. Vector graphics. Dollar currency graph, market pressure sign on white background, outline style icon for mobile or web design. Currency decrease vectors Trend to go down chart thin line icon, world sanction concept. Vector graphics. Dollar currency graph, market pressure
Free with trial Set Global economic crisis, Contract money and pen, Dollar rate decrease and Drop in crude oil price on seamless pattern. Vector. Currency decrease vectors Set Global economic crisis, Contract money and pen, Dollar rate decrease and Drop in crude oil price on seamless pattern
Free with trial White Dollar rate decrease icon isolated with long shadow background. Cost reduction. Money symbol with down arrow. Business lost crisis decrease. Pink hexagon button. Vector. Currency decrease illustrations White Dollar rate decrease icon isolated with long shadow background. Cost reduction. Money symbol with down arrow
Free with trial Trend to go down chart solid icon, world sanction concept. Vector graphics. Dollar currency graph, market pressure sign on white background, glyph style icon for mobile or web design. Currency decrease vectors Trend to go down chart solid icon, world sanction concept. Vector graphics. Dollar currency graph, market pressure sign
Free with trial Set of cracked dollar coins. Isometric vector illustration in outline style. Symbol of economic crash, financial crisis, and currency instability. Currency decrease vectors Set of cracked dollar coins. Isometric illustration in outline style. Symbol of economic crash, financial crisis, and currency
Free with trial Currency devaluation financial crisis burning dollar bill falling graph coins downward arrows economic recession website banner Vector illustration. Currency decrease vectors Currency devaluation financial crisis burning dollar bill falling graph coins downward arrows economic recession website banner
Free with trial Down chart, financial loss, decrease chart vector design. Currency decrease vectors Down chart, financial loss, decrease chart vector design
Free with trial Down chart, financial loss, decrease chart vector design. Currency decrease vectors Down chart, financial loss, decrease chart vector design
Free with trial Down chart, financial loss, decrease chart vector design. Currency decrease vectors Down chart, financial loss, decrease chart vector design
Free with trial Down chart, financial loss, decrease chart vector design. Currency decrease vectors Down chart, financial loss, decrease chart vector design
Free with trial Economic downturn concept showing two men with a large dollar symbol under storm clouds and lightning, representing financial instability, inflation, and currency devaluation isolated on white background vector illustration. Currency decrease vectors People Struggling With Currency Devaluation Crisis. Economic downturn concept showing two men with a large dollar symbol under storm clouds and lightning, representing financial instability, inflation, and currency devaluation isolated on white background vector illustration
Free with trial Blue Financial growth decrease icon isolated on white background. Increasing revenue. Minimalism concept. 3D render illustration. Currency decrease illustrations Blue Financial growth decrease icon isolated on white background. Increasing revenue. Minimalism concept. 3D render
Free with trial A golden hourglass with digital currency symbols flowing from the upper to the lower bulb encapsulating the passage of wealth over time. Generative AI. Currency decrease illustrations A golden hourglass with digital currency symbols flowing from the upper to the lower bulb encapsulating the passage of wealth
Free with trial Glowing neon Dollar rate decrease icon isolated on brick wall background. Cost reduction. Money symbol with down arrow. Business lost crisis decrease. Neon light alphabet. Vector. Currency decrease illustrations Glowing neon Dollar rate decrease icon isolated on brick wall background. Cost reduction. Money symbol with down arrow
Free with trial Blue line Dollar rate decrease icon isolated on white background. Cost reduction. Money symbol with down arrow. Business lost crisis decrease. Logo design template element. Vector. Currency decrease vectors Blue line Dollar rate decrease icon isolated on white background. Cost reduction. Money symbol with down arrow. Business
Free with trial Set line Contract money and pen, Gold bars, Dollar rate decrease and Stop delivery cargo truck icon. Vector. Currency decrease vectors Set line Contract money and pen, Gold bars, Dollar rate decrease and Stop delivery cargo truck icon. Vector
Free with trial Set Fire in burning house, Debt ball chained to coin, Dollar rate decrease and Mobile stock trading icon. Vector. Currency decrease vectors Set Fire in burning house, Debt ball chained to coin, Dollar rate decrease and Mobile stock trading icon. Vector
Free with trial Black and white illustration featuring two elements. The top section displays a speech bubble with a downward arrow and a Bitcoin symbol, suggesting a decrease. Below, a square frame contains a simplistic image of a landscape with a sun and a mountain, often used to represent digital images or NFTs. The design uses bold lines and minimalistic style to convey the concept of digital currency and media. Currency decrease vectors NFT Prices Down. Black and white illustration featuring two elements. The top section displays a speech bubble with a downward arrow and a Bitcoin symbol, suggesting a decrease. Below, a square frame contains a simplistic image of a landscape with a sun and a mountain, often used to represent digital images or NFTs. The design uses bold lines and minimalistic style to convey the concept of digital currency and media.
Free with trial Set Isometric Contract money and pen, Pie chart infographic, Mobile stock trading and Dollar rate decrease icon. Vector. Currency decrease illustrations Set Isometric Contract money and pen, Pie chart infographic, Mobile stock trading and Dollar rate decrease icon. Vector
Free with trial Set line Financial growth decrease, Mobile banking, Hourglass with dollar and Piggy. Glowing neon icon. Vector. Currency decrease vectors Set line Financial growth decrease, Mobile banking, Hourglass with dollar and Piggy. Glowing neon icon. Vector
Free with trial Line Financial growth decrease icon isolated seamless pattern on black background. Increasing revenue. Vector. Currency decrease vectors Line Financial growth decrease icon isolated seamless pattern on black background. Increasing revenue. Vector
Free with trial Candlestick chart showing a series of red and green bars representing price fluctuations over time. Each rectangular bar displays financial data, with green indicating an increase and red indicating a decrease. Thin vertical lines extend above and below the bars, illustrating price range. Numerical values such as 20. 800 and 213. 500 label specific points on the chart, judging stock or currency performance. Horizontal lines suggest moving averages, highlighting trends in the data. Currency decrease illustrations Candlestick chart showing a series of red and green bars representing price
Free with trial Grey Financial growth decrease icon isolated on beige background. Increasing revenue. Abstract circle random dots. Vector. Currency decrease vectors Grey Financial growth decrease icon isolated on beige background. Increasing revenue. Abstract circle random dots
Free with trial Set line Hierarchy organogram chart, Dollar symbol, Financial growth decrease and Arrow. White square button. Vector. Currency decrease vectors Set line Hierarchy organogram chart, Dollar symbol, Financial growth decrease and Arrow. White square button. Vector
Free with trial Colorful Dollar rate decrease icon isolated on white background. Cost reduction. Money symbol with down arrow. Business lost crisis decrease. Minimalism concept. 3D render illustration. Currency decrease illustrations Colorful Dollar rate decrease icon isolated on white background. Cost reduction. Money symbol with down arrow. Business
Free with trial Colorful Dollar rate decrease icon isolated on white background. Cost reduction. Money symbol with down arrow. Business lost crisis decrease. Minimalism concept. 3D render illustration. Currency decrease illustrations Colorful Dollar rate decrease icon isolated on white background. Cost reduction. Money symbol with down arrow. Business
Free with trial Colorful Dollar rate decrease icon isolated on white background. Cost reduction. Money symbol with down arrow. Business lost crisis decrease. Minimalism concept. 3D render illustration. Currency decrease illustrations Colorful Dollar rate decrease icon isolated on white background. Cost reduction. Money symbol with down arrow. Business
Free with trial Colorful Financial growth decrease icon isolated on white background. Increasing revenue. Circle button. 3D render illustration. Currency decrease illustrations Colorful Financial growth decrease icon isolated on white background. Increasing revenue. Circle button. 3D render
Free with trial Colorful Financial growth decrease icon isolated on white background. Increasing revenue. Circle button. 3D render illustration. Currency decrease illustrations Colorful Financial growth decrease icon isolated on white background. Increasing revenue. Circle button. 3D render
Free with trial Glowing neon line Financial growth decrease icon isolated on black background. Increasing revenue. Vector. Currency decrease vectors Glowing neon line Financial growth decrease icon isolated on black background. Increasing revenue. Vector
Free with trial JPY currency on the display board with red arrow down, 3d rendering. Currency decrease illustrations JPY currency on the display board with red arrow down
Free with trial INR currency on the display board with red arrow down, 3d rendering. Currency decrease illustrations INR currency on the display board with red arrow down
Free with trial EUR currency on the display board with red arrow down, 3d rendering. Currency decrease illustrations EUR currency on the display board with red arrow down
Free with trial USD currency on the display board with red arrow down, 3d rendering. Currency decrease illustrations USD currency on the display board with red arrow down
Free with trial Colorful Financial growth decrease icon isolated on white background. Increasing revenue. Minimalism concept. 3D render illustration. Currency decrease illustrations Colorful Financial growth decrease icon isolated on white background. Increasing revenue. Minimalism concept. 3D render
Free with trial Colorful Financial growth decrease icon isolated on white background. Increasing revenue. Minimalism concept. 3D render illustration. Currency decrease illustrations Colorful Financial growth decrease icon isolated on white background. Increasing revenue. Minimalism concept. 3D render
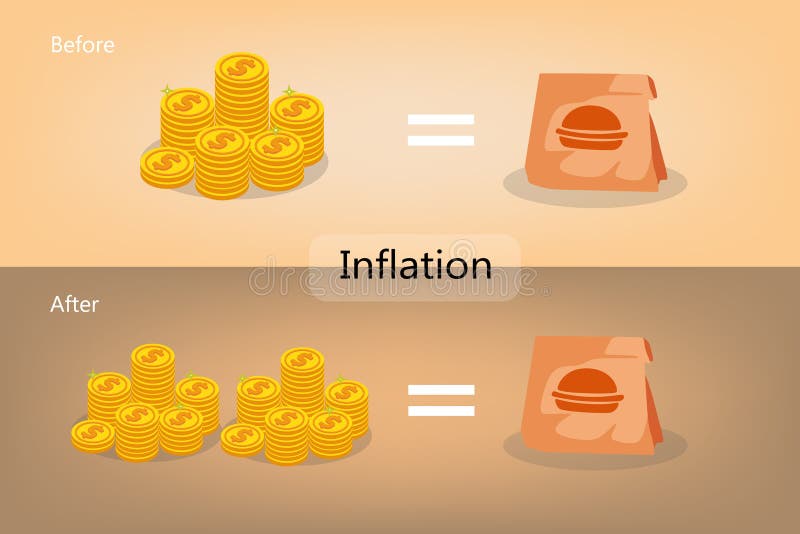
Free with trial Inflation situation is a decrease in the purchasing power of money. Currency decrease illustrations Inflation situation is a decrease in the purchasing power of money
Free with trial Line Financial growth decrease icon isolated on white background. Increasing revenue. Colorful outline concept. Vector. Currency decrease vectors Line Financial growth decrease icon isolated on white background. Increasing revenue. Colorful outline concept. Vector
Free with trial Visualize financial concepts with this dynamic illustration showcasing currency exchange rates and market trends. Perfect for business presentations, financial reports, and investment strategies. Showcasing global market volatility and opportunities. Currency decrease vectors Dollar and Euro currency exchange rate with upward and downward trends. Visualize financial concepts with this dynamic illustration showcasing currency exchange rates and market trends. Perfect for business presentations, financial reports, and investment strategies. Showcasing global market volatility and opportunities
Free with trial Yen weak and yen strong icon set. yen price rise and yen price decrease. vector. Currency decrease illustrations Yen weak and yen strong icon set. yen price rise and yen price decrease.
Free with trial Set line Dollar rate decrease, Drop in crude oil price, Global economic crisis and icon. Vector. Currency decrease vectors Set line Dollar rate decrease, Drop in crude oil price, Global economic crisis and icon. Vector
Free with trial Decrease graph icon in generic style. Statistic illustration concept. Currency decrease vectors Decrease graph icon in generic style. Statistic concept. Decrease graph icon in generic style. Statistic illustration concept
Free with trial Cost low and loss. Decrease revenue. Crisis of economy. Icon of money inflation. Currency decrease vectors Cost low and loss. Decrease revenue. Crisis of economy.
Free with trial BALANCE BETWEEN THE DOLLAR AND THE EURO CURRENCY - Dollar against euro concept - Futuristic stock market background with charts, numbers, and financial trends. Currency decrease illustrations BALANCE BETWEEN THE DOLLAR AND THE EURO CURRENCY - Dollar against euro concept - Futuristic stock market background
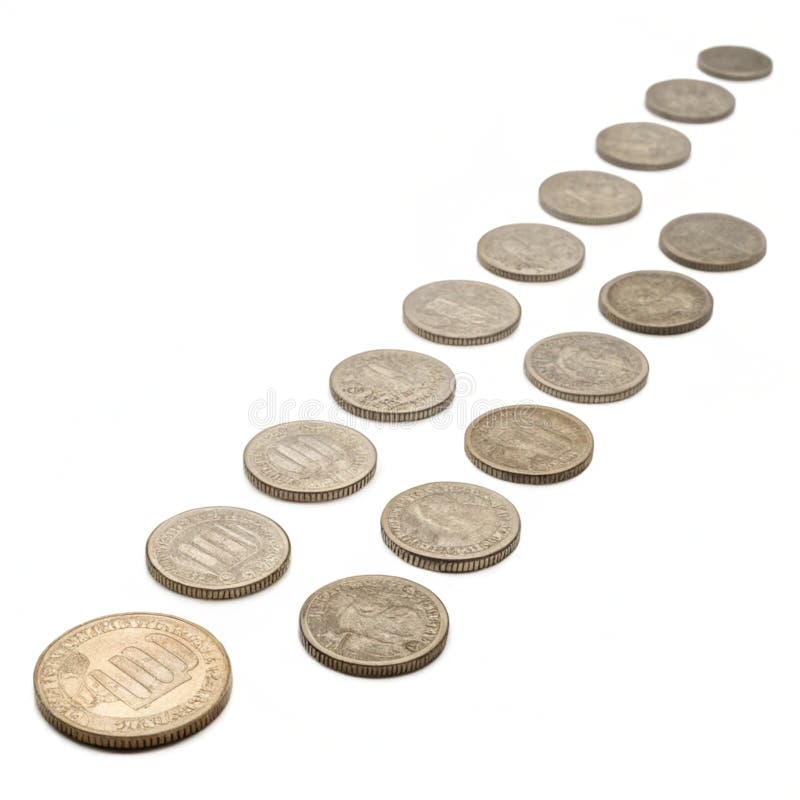
Free with trial Coins decrease isometric isolated on transparent background. Currency decrease illustrations Coins decrease isometric isolated on transparent background
Free with trial Decrease bar graph icon on black square. Statistic illustration concept. Currency decrease vectors Decrease bar graph icon on black square. Statistic concept. Decrease bar graph icon on black square. Statistic illustration concept