Free with trial Factory building with smokestacks, declining bar graph, gear with downward arrow. Ideal for industry, production, downturn, economy, efficiency challenges automation. Simple flat metaphor. Data decrease vectors Factory with Gears and a Downward Arrow Representing Industrial Decline and Productivity Challenges. Factory building with smokestacks, declining bar graph, gear with downward arrow. Ideal for industry, production, downturn, economy, efficiency challenges automation. Simple flat metaphor
Free with trial Building wooden bar graph with hand, representing growth and progress -. Data decrease illustrations Building wooden bar graph with hand, representing growth and progress
Free with trial Discount percentage icon continuous outline drawing simple style finance vector art. Data decrease vectors Discount percentage icon continuous outline drawing simple style finance
Free with trial Bar chart with descending bars, coin falling, minimal cloud above. Ideal for finance, economy, loss, risk, business investments or savings themes. Simple flat metaphor. Data decrease vectors Decreasing Bar Chart with Dropping Coin Symbolizing Financial Decline and Economic Challenges. Bar chart with descending bars, coin falling, minimal cloud above. Ideal for finance, economy, loss, risk, business investments or savings themes. Simple flat metaphor
Free with trial Futuristic Declining Bar Chart with Downward Arrow on Dark Background, Financial Loss and Negative Trend Concept. Data decrease vectors Futuristic Declining Bar Chart with Downward Arrow on Dark Background
Free with trial Financial crisis recession falling graph chart warning declining bar and line graph red exclamation coins documents cityscape abstract background Vector illustration. Data decrease vectors Financial crisis recession falling graph chart warning declining bar and line graph red exclamation coins documents cityscape
Free with trial Uptrend and downtrend business chart icon vector. Economic growth and decline arrow symbol in black circle. Data decrease vectors Uptrend and downtrend business chart icon. Economic growth and decline arrow symbol in black circle
Free with trial A minimalist abstract image featuring a horizontal sequence of circles or rings set against a pure black background. The circles are rendered in a glowing neon yellow-green, and they progressively decrease in size from the large circle on the left to the smallest on the far right. This arrangement suggests a visual progression, scale, diminishing distance, or a visualization of frequency decay, creating a highly organized and technological aesthetic. Data decrease illustrations Neon Ring Progression on Black. A minimalist abstract image featuring a horizontal sequence of circles or rings set against a pure black background. The circles are rendered in a glowing neon yellow-green, and they progressively decrease in size from the large circle on the left to the smallest on the far right. This arrangement suggests a visual progression, scale, diminishing distance, or a visualization of frequency decay, creating a highly organized and technological aesthetic.
Free with trial A vertical split image featuring a green upward arrow labeled 'UP' and a red downward arrow labeled 'DOWN. Data decrease illustrations Green up arrow symbolizing growth and red down arrow representing decline. A vertical split image featuring a green upward arrow labeled 'UP' and a red downward arrow labeled 'DOWN
Free with trial Multiple Downward Arrows Showing Declining Trend, Business Loss Concept with Gradient Arrows on White Background. Data decrease vectors Multiple Downward Arrows Showing Declining Trend, Business Loss Concept
Free with trial Sale discount icon continuous outline drawing simple style marketing white background. Data decrease vectors Sale discount icon continuous outline drawing simple style marketing
Free with trial Economic crisis recession financial downturn concept sad person sitting near falling graph stacks of documents world map background Vector illustration. Data decrease vectors Economic crisis recession financial downturn concept sad person sitting near falling graph stacks of documents world map
Free with trial Intersecting colorful lines trending up and down across a graph illustrate weekly progress from monday to sunday, capturing fluctuations in performance over time. Data decrease vectors Intersecting colorful lines trending up and down across a graph illustrate weekly progress from monday to sunday
Free with trial Stylized gradient bar graph with downward arrow inside a square. Represents financial loss and economic decline with flat design. Data decrease vectors Decreasing graph icon representing financial loss or economic decline. Stylized gradient bar graph with downward arrow inside a square. Represents financial loss and economic decline with flat design.
Free with trial Two simple black bar graphs illustrate a downward trend with arrows, symbolizing financial loss and economic decline. Data decrease vectors Two downward trending bar graphs with diagonal arrows showing decline. Two simple black bar graphs illustrate a downward trend with arrows, symbolizing financial loss and economic decline
Free with trial Bar graph decreasing in height beside falling coins merging into cloud. Ideal for finance, economy, business risk, savings, investment, financial crisis, wealth management. Simple flat metaphor. Data decrease vectors Financial decline represented with bar graph and coins falling into cloud symbolizing loss. Bar graph decreasing in height beside falling coins merging into cloud. Ideal for finance, economy, business risk, savings, investment, financial crisis, wealth management. Simple flat metaphor
Free with trial A graphic illustration featuring a black jagged downward-pointing arrow overlapping a black Indian Rupee symbol and a decreasing line graph on a white background, symbolizing financial loss, market crash, and currency depreciation. Data decrease illustrations Black Downward Arrow with Indian Rupee Symbol and Declining Line Graph. A graphic illustration featuring a black jagged downward-pointing arrow overlapping a black Indian Rupee symbol and a decreasing line graph on a white background, symbolizing financial loss, market crash, and currency depreciation.
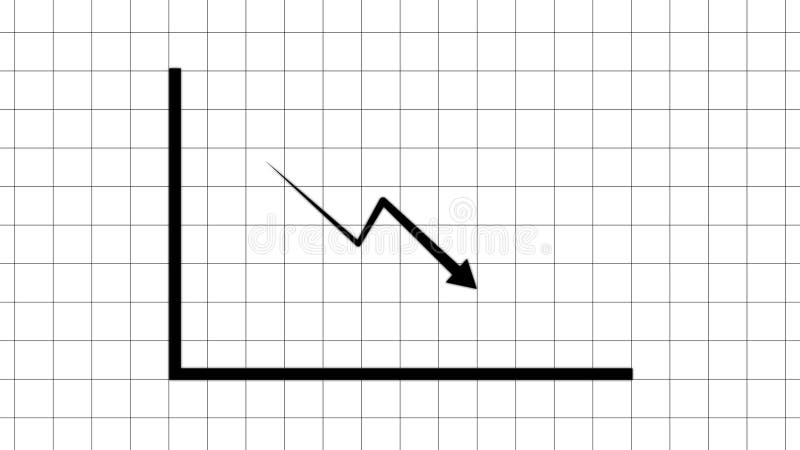
Free with trial Zigzag downward arrow representing financial loss, market decline, and negative business performance. Ideal for economic reports and risk analysis. Data decrease vectors Zigzag Down Arrow Business Decline Financial Loss Concept Illustration. Zigzag downward arrow representing financial loss, market decline, and negative business performance. Ideal for economic reports and risk analysis.
Free with trial Loss Report Document Icons for Financial Decline and Business Analysis vol 11482. Data decrease vectors Loss Report Document Icons for Financial Decline and Business Analysis
Free with trial Gear icon beside descending bar chart emphasizing reduction trends. Ideal for performance assessment, process decline, economic studies, management, analytics, workflow, simple flat metaphor. Data decrease illustrations Gear and Declining Bar Chart Representing Process Downsizing or Performance Reduction. Gear icon beside descending bar chart emphasizing reduction trends. Ideal for performance assessment, process decline, economic studies, management, analytics, workflow, simple flat metaphor
Free with trial Red downward arrow symbolizing financial loss, market decline, and negative business trends. Ideal for risk and crisis visuals. Data decrease vectors Red Downward Arrow Financial Loss Business Decline Concept Illustration. Red downward arrow symbolizing financial loss, market decline, and negative business trends. Ideal for risk and crisis visuals.
Free with trial Single line art illustration of classic percent symbol isolated outline white background. Data decrease vectors Single line art illustration of classic percent symbol isolated outline
Free with trial Continuous line drawing of percent symbol icon minimalist style isolate white background. Data decrease vectors Continuous line drawing of percent symbol icon minimalist style isolate
Free with trial Woman in a gray suit shows a thumbs down gesture and holds a red downward arrow. Flat vector illustration isolated on white background. Data decrease illustrations Woman in a gray suit shows a thumbs down gesture and holds a red downward arrow
Free with trial A three-dimensional bar graph on a dark blue background displays a vertical arrangement of multicolored bars�'orange, yellow, and red�'with the tallest bar at the bottom and the shortest at the top, illustrating a declining trend in cancer diagnosis rates under a striking bright blue overhead light that casts a dramatic and ominous mood, suitable for representing statistical data, medical. Data decrease illustrations A 3D bar graph on a dark blue background shows decreasing cancer diagnosis rates with orange yellow and red vertical bars under. A three-dimensional bar graph on a dark blue background displays a vertical arrangement of multicolored bars�'orange, yellow, and red�'with the tallest bar at the bottom and the shortest at the top, illustrating a declining trend in cancer diagnosis rates under a striking bright blue overhead light that casts a dramatic and ominous mood, suitable for representing statistical data, medical
Free with trial Percent sign simple outline single line art illustration isolated design vector art. Data decrease vectors Percent sign simple outline single line art illustration isolated design
Free with trial Business finance and growth icons illustrating statistics charts trends progress and success. Data decrease vectors Finance and growth icons showing progress and business performance blue navy. Business finance and growth icons illustrating statistics charts trends progress and success
Free with trial A red, transparent 3D arrow points downwards within a matching red, transparent circular outline. The arrow and circle have a glossy finish. The object is presented in isolation against a plain white background, casting a subtle shadow. Data decrease illustrations Red transparent arrow pointing downwards inside a red transparent circle red arrow down arrow. A red, transparent 3D arrow points downwards within a matching red, transparent circular outline. The arrow and circle have a glossy finish. The object is presented in isolation against a plain white background, casting a subtle shadow
Free with trial Green red up and down gold chart icon isolated flat style vector illustration on white background. Data decrease vectors Green red up and down gold chart icon isolated flat style
Free with trial Business strategy, performance analysis, goal setting, success tracking, financial growth, decision-making. Visual includes bar chart, target with an arrow and directional arrows. Business strategy. Data decrease vectors Business Growth, Performance Metrics, and Success Concept with Charts, Arrows, and Target Symbol. Business strategy, performance analysis, goal setting, success tracking, financial growth, decision-making. Visual includes bar chart, target with an arrow and directional arrows. Business strategy
Free with trial Percent icon continuous one line drawing minimalist style isolate outline white background. Data decrease vectors Continuous one line drawing minimalist style isolate outline percent icon. Percent icon continuous one line drawing minimalist style isolate outline white background
Free with trial A bold black line charts a significant downward trajectory, indicating a sharp decline, against a subtle grid. Data decrease illustrations A jagged downward trend line illustrates a sharp decline on a grid background. A bold black line charts a significant downward trajectory, indicating a sharp decline, against a subtle grid
Free with trial Flat vector illustration of a businessman holding cash that is breaking apart, symbolizing financial loss, investment risk, economic instability, and money depreciation. Data decrease vectors Financial Loss Concept Illustration with Money Breaking and Investment Risk. Flat vector illustration of a businessman holding cash that is breaking apart, symbolizing financial loss, investment risk, economic instability, and money depreciation
Free with trial Logo design graphic concept creative premium vector stock image top sell. Data decrease vectors Dollar money arrow up down chart diagram inflation rate risk market business. Logo design graphic concept creative premium vector stock image top sell
Free with trial Arrows with dollar signs indicating financial trends and market directions. Data decrease illustrations Arrows with dollar signs indicating financial trends and market directions
Free with trial Simple outline illustration of percent sign continuous single line drawing white background. Data decrease vectors Simple outline illustration continuous single line drawing of percent sign. Simple outline illustration of percent sign continuous single line drawing white background
Free with trial Zigzag downward arrow representing financial loss, business decline, and negative market trends. Perfect for risk analysis, crisis reports, and economic downturn visuals. Data decrease vectors Downward Zigzag Arrow Business Decline Concept Financial Loss Illustration. Zigzag downward arrow representing financial loss, business decline, and negative market trends. Perfect for risk analysis, crisis reports, and economic downturn visuals.
Free with trial Two pixelated 3D arrows, one pointing up and the other down, are rendered in vibrant green. They are constructed from small cubes, giving them a distinct blocky appearance. The arrows are presented against a clean white background, emphasizing their form and symbolic meaning of direction and change. Data decrease illustrations 3D Pixelated Green Up and Down Arrows on White Background up arrow. Two pixelated 3D arrows, one pointing up and the other down, are rendered in vibrant green. They are constructed from small cubes, giving them a distinct blocky appearance. The arrows are presented against a clean white background, emphasizing their form and symbolic meaning of direction and change
Free with trial Abstract dotted financial graph chart sparkling background. Vector minimal tech design. Data decrease vectors Abstract dotted financial graph chart sparkling background
Free with trial A smooth, rounded 3D arrow in a vibrant purple color points directly downwards. The arrow is rendered against a soft, solid pastel purple background, creating a minimalist and clean aesthetic. The object appears to be floating slightly above the surface. Data decrease illustrations Purple 3D Arrow Pointing Downwards on Pastel Background violet. A smooth, rounded 3D arrow in a vibrant purple color points directly downwards. The arrow is rendered against a soft, solid pastel purple background, creating a minimalist and clean aesthetic. The object appears to be floating slightly above the surface
Free with trial Security outdated and downgrade protection icon set. Shield with downward arrow symbol illustration. Data decrease vectors Security outdated and downgrade protection icon set. Shield with downward arrow symbol
Free with trial 3d render of stand holding tablet showing bright red descending graph, isolated on a transparent background. Data decrease vectors 3d render of stand holding tablet showing bright red descending graph
Free with trial Profit Decline simple icons set designed in filled, outline, line and stroke style. Data decrease vectors Profit Decline simple icons set designed in filled and stroke style. Profit Decline simple icons set designed in filled, outline, line and stroke style
Free with trial Minimalist percent sign continuous line drawing icon symbol isolate element white background. Data decrease vectors Minimalist percent sign continuous line drawing icon symbol isolate element