Free with trial Business flowchart. Timeline with milestone steps pesentation history chart. Infographic optional vector diagram on world map. Illustration of infographic process step, timeline diagram. Data processing flowchart vectors Business flowchart. Timeline with milestone steps pesentation history chart. Infographic optional vector diagram on
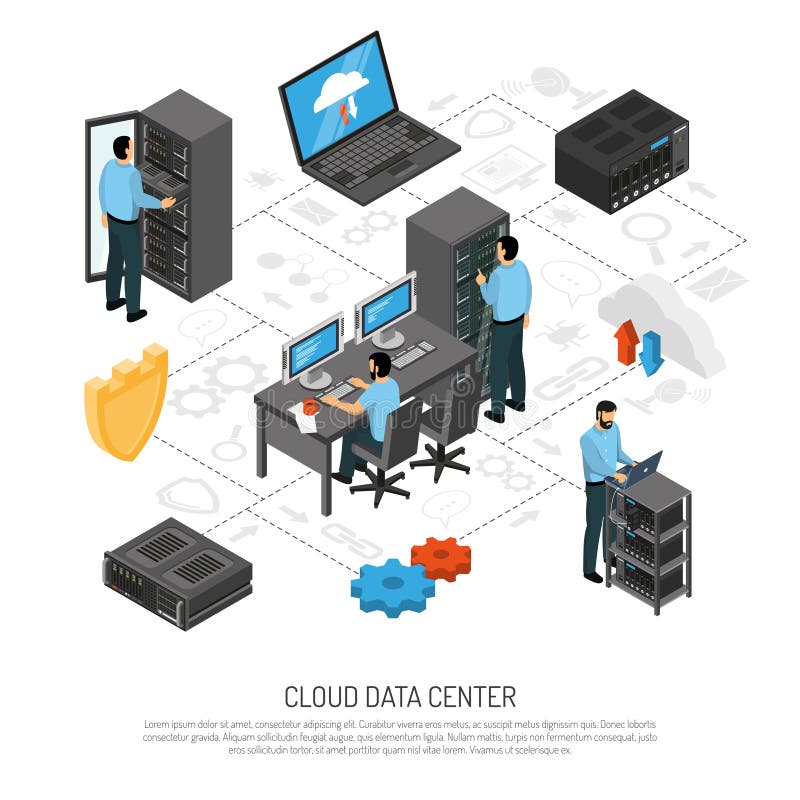
Free with trial Cloud data center isometric flowchart with technical staff and racks of server units vector illustration. Data processing flowchart vectors Cloud Data Center Isometric Flowchart
Free with trial Isometric data security, computer engineer, data center and server room, cloud computing, people working together teamwork collective, color vector flat illustration. Data processing flowchart vectors Isometric data security, computer engineer, data center and server room, cloud computing, people working together
Free with trial Abstract icons of big data analytics report, network statistics and datum infographic report for analyzing and forecasting. Unusual flat design line icons set unique art vector illustration concept. Data processing flowchart vectors Big data and network analysis line icons set. Abstract icons of big data analytics report, network statistics and datum infographic report for analyzing and forecasting. Unusual flat design line icons set unique art vector illustration concept.
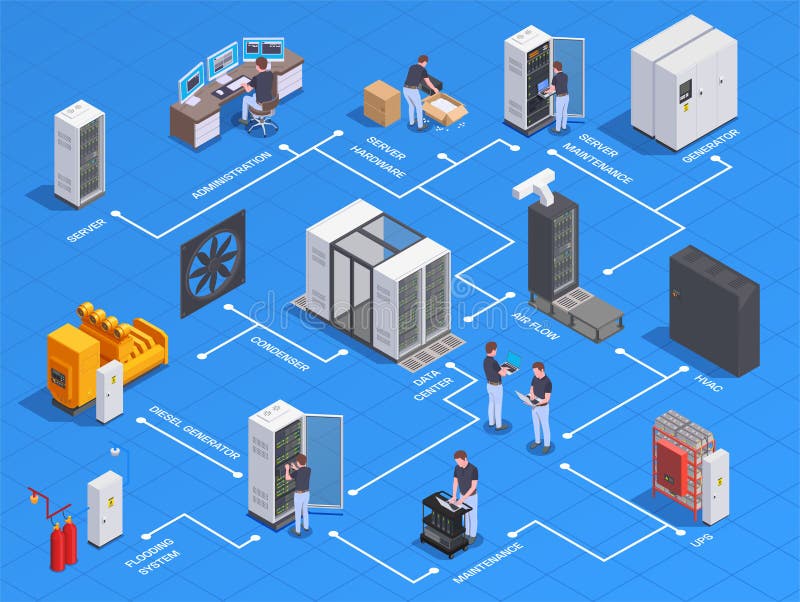
Free with trial Datacenter equipment personnel isometric flowchart with generator server hardware maintenance administration airflow system blue background vector illustration. Data processing flowchart vectors Datacenter Isometric Flowchart. Datacenter equipment personnel isometric flowchart with generator server hardware maintenance administration airflow system blue background vector illustration
Free with trial Business flowchart. Timeline with milestone steps pesentation history chart. Infographic optional vector diagram on world map. Illustration of infographic process step, timeline diagram. Data processing flowchart vectors Business flowchart. Timeline with milestone steps pesentation history chart. Infographic optional vector diagram on
Free with trial Isometric paper production infographics with editable text captions flowchart of machinery icons with ready products images vector illustration. Data processing flowchart vectors Paper Mill Pulp Infographics. Isometric paper production infographics with editable text captions flowchart of machinery icons with ready products images vector illustration
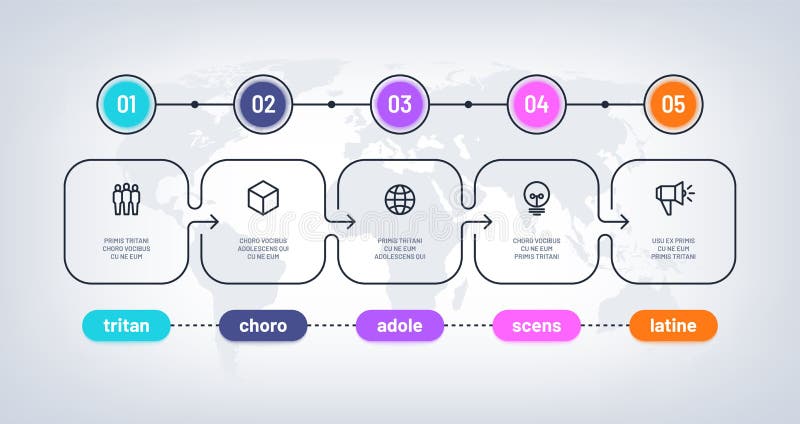
Free with trial Step infographic. 5 options timeline flow chart, business graphic element, workflow layout infographic diagram. Vector 5 step graphic banner concept. Data processing flowchart vectors Step infographic. 5 options timeline flow chart, business graphic element, workflow layout diagram. Vector 5 step. Step infographic. 5 options timeline flow chart, business graphic element, workflow layout infographic diagram. Vector 5 step graphic banner concept
Free with trial Data flow diagram, artificial intelligence robotech, big data automatic processing and analysis, dark neon violet vector. Data processing flowchart vectors Data flow diagram, artificial intelligence robotech, big data automatic processing and analysis, dark neon violet
Free with trial Server room isometric icon, big data processing, data warehouse, cloud storage technology vector dark neon illustration. Data processing flowchart vectors Server room isometric icon, big data processing, data warehouse, cloud storage technology vector dark neon
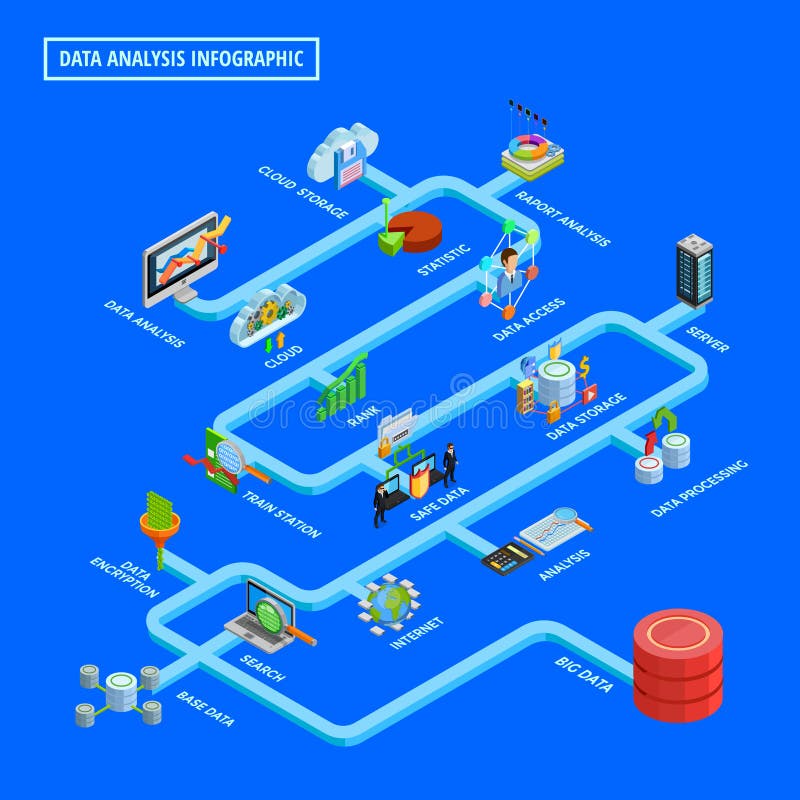
Free with trial Big data access analysis process and safe storage internet security technologies isometric flowchart bright blue background vector illustration. Data processing flowchart vectors Data Analysis Infographic Isometric Flowchart. Big data access analysis process and safe storage internet security technologies isometric flowchart bright blue background vector illustration
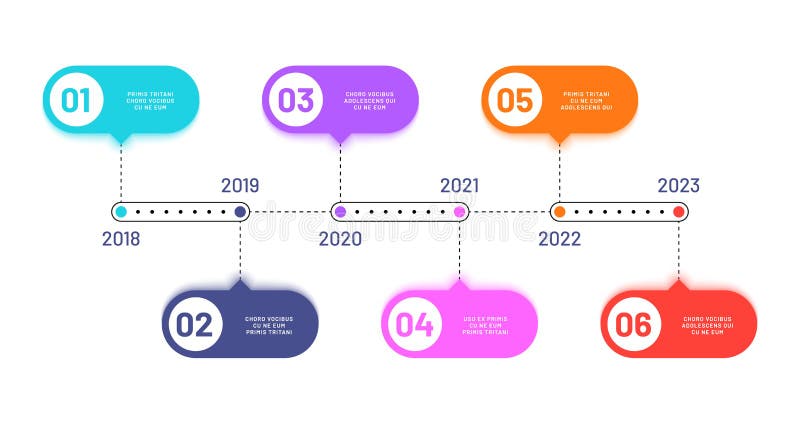
Free with trial Business timeline. 6 process steps, horizontal workflow processing diagram. Infographics vector flowchart. Work flow diagram with number year illustration. Data processing flowchart vectors Business timeline. 6 process steps, horizontal workflow processing diagram. Infographics vector flowchart
Free with trial Black and white icon of an algorithm processing data with connecting lines. Data processing flowchart vectors Algorithm showing data processing with connecting lines and squares. Black and white icon of an algorithm processing data with connecting lines
Free with trial Data science as info collection, processing or knowledge tiny person concept. Learning about graphic analysis and math diagram measurements vector illustration. Smart scheme and diagram comprehension. Data processing flowchart vectors Data science as info collection, processing or knowledge tiny person concept
Free with trial Business process and workflow automation with flowchart. Wooden cube block arranging processing management on yellow background. 3d render illustration. Data processing flowchart illustrations Wooden cube block arranging processing management on yellow background. 3d render illustration
Free with trial Visual learning pathway shows how inputs become outputs through processing, head silhouette, gears, and lightbulb highlight cognition and insight. Outline diagram. Data processing flowchart vectors Visual learning pathway shows how inputs become outputs through processing, ... Visual learning pathway shows how inputs become outputs through processing, head silhouette, gears, and lightbulb highlight cognition and insight. Outline diagram
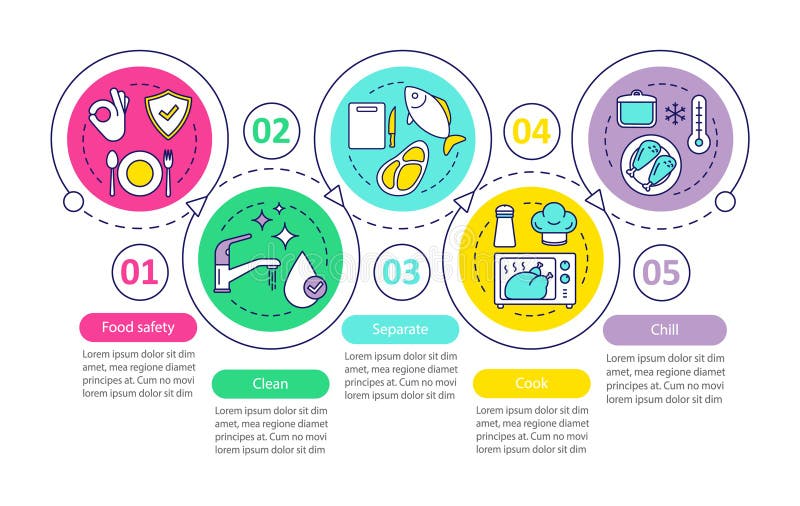
Free with trial Food safety vector infographic template. Food processing, preparation. Business presentation design elements. Data visualization with five steps and options. Process timeline chart. Workflow layout. Data processing flowchart vectors Food safety vector infographic template
Free with trial Colorful flow chart on computer screen, business workflow hierarchy algorithm processing management. Data processing flowchart illustrations Colorful flow chart on computer screen, business workflow hierarchy algorithm processing management
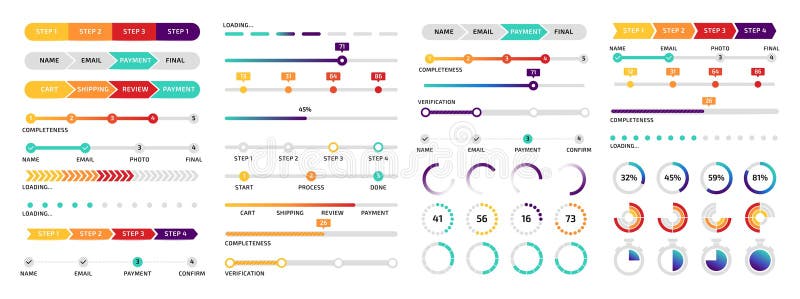
Free with trial Infographic design. Circle and line processing charts. Sequence steps. Loading diagram with percent numbers. Business presentation. Statistic scheme. Vector progressive data indicator elements set. Data processing flowchart vectors Infographic design. Circle and line charts. Sequence steps. Loading diagram with percent numbers. Business presentation. Infographic design. Circle and line processing charts. Sequence steps. Loading diagram with percent numbers. Business presentation. Statistic scheme. Vector progressive data indicator elements set
Free with trial Payroll processing stages circle infographic template. Employee wage. Data visualization with 4 steps. Editable timeline info chart. Workflow layout with line icons. Lato-Bold, Regular fonts used. Data processing flowchart vectors Payroll processing stages circle infographic template
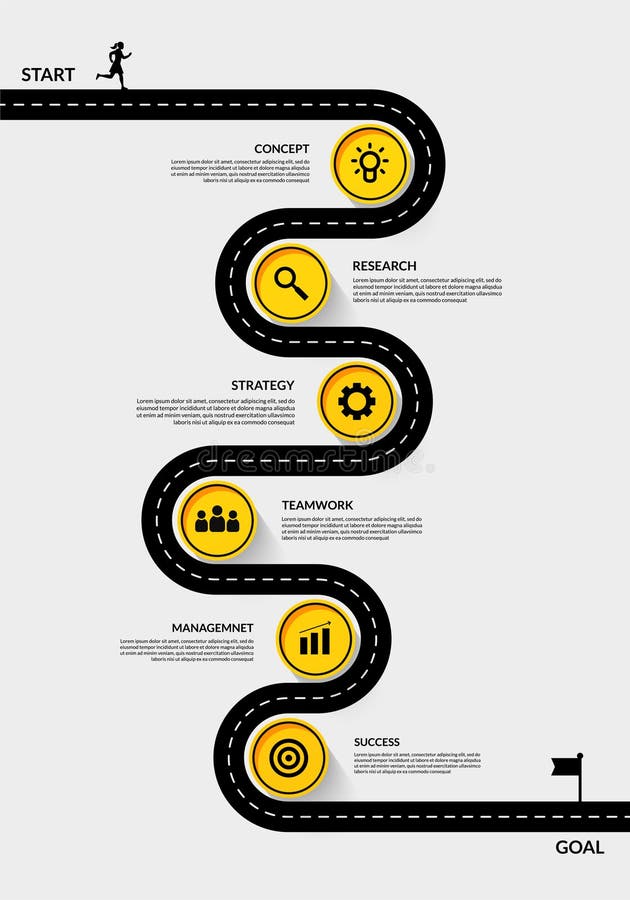
Free with trial Timeline infographic road map with multiple steps, Outline data visualization workflow. Data processing flowchart vectors Timeline infographic road map with multiple steps, Outline data visualization workflow
Free with trial Editable process infographic template displays five steps with connecting lines, description boxes, and business icons for process presentations, data analysis, and timeline visualization. Data processing flowchart vectors Five Steps Process Infographic with Business Icons and Description Boxes Presentation Diagram. Editable process infographic template displays five steps with connecting lines, description boxes, and business icons for process presentations, data analysis, and timeline visualization
Free with trial Business marketing research on laptop and smartphone screen graphs and diagrams, processing chart, financial statistics analysis. Vector. Data processing flowchart vectors Business marketing research on laptop and smartphone screen graphs and diagrams, processing chart, financial statistics analysis.
Free with trial Infographics template - three steps timeline with arrows on white background. Data processing flowchart illustrations Infographics template - three steps timeline with arrows
Free with trial Infographics template - four steps process timeline cycle with arrows. Data processing flowchart illustrations Infographics template - four steps process cycle. Infographics template - four steps process timeline cycle with arrows
Free with trial Infographics template - three steps timeline with arrows on white background. Data processing flowchart illustrations Infographics template - three steps timeline with arrows
Free with trial Illustration of pyramid structure - ponzi scheme, trickle up effect, mlm. Data processing flowchart illustrations Illustration of pyramid structure - ponzi scheme, trickle up effect
Free with trial Inventory Workflow Tracking for Supply Chain Management Presentation concept. Data processing flowchart vectors Inventory Workflow Tracking for Supply Chain Management Presentation
Free with trial Conceptual illustration of an AI decision engine evaluating conditions to approve or reject actions in an automated system. Generative AI. Data processing flowchart illustrations AI Decision Engine Approval and Rejection Logic Flow. Conceptual illustration of an AI decision engine evaluating conditions to approve or reject actions in an automated system. Generative AI
Free with trial Computing cloud service delivered over internet network. Leasing infrastructure backup and sharing files features. Data processing flowchart vectors Computing cloud service delivered over internet network
Free with trial EDGE COMPUTING on modern server room background. Information technology and business concept for resource intensive distributed computing services. Data processing flowchart illustrations EDGE COMPUTING on modern server room background. Information technology and business concept for resource intensive
Free with trial Modern Infographic Timeline Constructor For Fishing Industry. Conceptual Vector Background. Template For Business Presentations. Data processing flowchart vectors Modern Infographic Timeline Constructor For Fishing Industry. Conceptual Vector Background. Template For Business
Free with trial Planning software blue gradient concept icon. Use models for new project. Programming skill abstract idea thin line illustration. Isolated outline drawing. Myriad Pro-Bold font used. Data processing flowchart vectors Planning software blue gradient concept icon
Free with trial Document flow line icons collection. Workflow management, Information stream, Business process, Task sequence, Process. Data processing flowchart vectors Document flow line icons collection. Workflow management, Information stream, Business process, Task sequence, Process
Free with trial Document flow line icons collection. Workflow management, Information stream, Business process, Task sequence, Process. Data processing flowchart vectors Document flow line icons collection. Workflow management, Information stream, Business process, Task sequence, Process
Free with trial Data Processing Flowchart Icon Set vol 33766. Data processing flowchart vectors Data Processing Flowchart Icon Set
Free with trial A color-coded flowchart diagram illustrating a data processing workflow, starting from input data, evaluating a condition (x > 5), processing the data if the condition is met, and outputting the result, with clear decision points and directional flow for systematic decision-making in a structured and organized manner. The chart includes labeled shapes for start, end, input, decision, process, and. Data processing flowchart illustrations Detailed Flowchart Diagram for Data Processing Decision Making. A color-coded flowchart diagram illustrating a data processing workflow, starting from input data, evaluating a condition (x > 5), processing the data if the condition is met, and outputting the result, with clear decision points and directional flow for systematic decision-making in a structured and organized manner. The chart includes labeled shapes for start, end, input, decision, process, and
Free with trial Data Processing Flowchart Graphic Set vol 33476. Data processing flowchart vectors Data Processing Flowchart Graphic Set
Free with trial Image Data Pipeline and Processing Flowchart vol 33057. Data processing flowchart vectors Image Data Pipeline and Processing Flowchart
Free with trial Artificial intelligence algorithm processing data to make decisions, creating a visual flowchart representing machine learning, automation, and advanced technology in a structured computing program. Data processing flowchart vectors Artificial intelligence algorithm processing data flowchart concept. Artificial intelligence algorithm processing data to make decisions, creating a visual flowchart representing machine learning, automation, and advanced technology in a structured computing program
Free with trial Artificial intelligence algorithm processing data, illustrating machine learning and digital solutions through a detailed flowchart with connecting elements for logic and information flow. Data processing flowchart vectors Artificial intelligence algorithm processing data flowchart diagram. Artificial intelligence algorithm processing data, illustrating machine learning and digital solutions through a detailed flowchart with connecting elements for logic and information flow
Free with trial A detailed flowchart illustrating data processing with various servers and cube representations. The diagram shows the flow of data between different servers, symbolized by cubes, indicating a process or system. This image can be used in contexts related to technology, data management, and IT infrastructure. Data processing flowchart illustrations Data Processing Flowchart with Servers and Cubes. A detailed flowchart illustrating data processing with various servers and cube representations. The diagram shows the flow of data between different servers, symbolized by cubes, indicating a process or system. This image can be used in contexts related to technology, data management, and IT infrastructure
Free with trial An isometric illustration depicting a complex data processing system with various 3D geometric shapes connected by lines and arrows, representing a flowchart or network diagram. The image conveys a sense of technology and data management, suitable for use in IT, software development, and data analysis contexts. Data processing flowchart illustrations Data Processing Flowchart with 3D Geometric Shapes. An isometric illustration depicting a complex data processing system with various 3D geometric shapes connected by lines and arrows, representing a flowchart or network diagram. The image conveys a sense of technology and data management, suitable for use in IT, software development, and data analysis contexts
Free with trial A modern vector illustration of a data processing flowchart, representing information exchange and system operations. This icon is ideal for tech presentations, business analytics, software development, or any design related to digital processes, vector design Generative AI. Data processing flowchart vectors Modern Data Processing Flowchart, Information Exchange Icon - vector design Generative AI. A modern vector illustration of a data processing flowchart, representing information exchange and system operations. This icon is ideal for tech presentations, business analytics, software development, or any design related to digital processes, vector design Generative AI
Free with trial A vibrant 3D flowchart with colorful representing communication and data processing. include chat bubbles, envelopes, gears, circuit boards, and arrows on a white background. flowchart. Data processing flowchart illustrations Colorful 3 D Flowchart of Communication and Data Processing. A vibrant 3D flowchart with colorful representing communication and data processing. include chat bubbles, envelopes, gears, circuit boards, and arrows on a white background. flowchart
Free with trial A simple diagram illustrating the stages of data processing, from input through processing to output. The flowchart is depicted with glowing blue elements on a white background, representing a clean and modern technological process. This image can be used in various contexts such as technology, business, and education to visualize data processing concepts. Data processing flowchart illustrations Data Processing Flowchart with Input, Process, and Output Stages. A simple diagram illustrating the stages of data processing, from input through processing to output. The flowchart is depicted with glowing blue elements on a white background, representing a clean and modern technological process. This image can be used in various contexts such as technology, business, and education to visualize data processing concepts
Free with trial Hands Typing on Keyboard with Digital Flowchart Design and Laptop on Dark Table Representing Technology, Data Processing, and Network Systems Quark. Data processing flowchart illustrations Hands Typing on Keyboard with Digital Flowchart Design and Laptop on Dark Table Representing Technology, Data Processing
Free with trial Flowchart pattern with glowing elements, illustrating data processing and network systems. Circuit board concept for modern high technology design. Data processing flowchart illustrations Flowchart circuit board pattern illustrating concept of data processing network. Flowchart pattern with glowing elements, illustrating data processing and network systems. Circuit board concept for modern high technology design
Free with trial Email showing abstract flowchart of data processing with gear, cloud, robot arm, and mail icons keywords: data, processing, flowchart, technology. Data processing flowchart illustrations Abstract Flowchart of Data Processing with Gear, Cloud, Robot Arm, and Mail Icons Keywords: data, processing
Free with trial This image depicts a detailed flowchart for data processing. It starts with an initialization step, followed by a decision point that checks if a condition is met. If the condition is met, the process continues to execute a specific task. If not, it follows an alternative path. The flowchart includes steps for processing data, handling alternatives, and final execution or failure outcomes. The. Data processing flowchart illustrations Flowchart for data processing workflow. This image depicts a detailed flowchart for data processing. It starts with an initialization step, followed by a decision point that checks if a condition is met. If the condition is met, the process continues to execute a specific task. If not, it follows an alternative path. The flowchart includes steps for processing data, handling alternatives, and final execution or failure outcomes. The
Free with trial A detailed flowchart illustrating data processing and model training is drawn on a whiteboard in a modern office environment with people working in the background. Data processing flowchart illustrations Complex Data Processing and Model Training Flowchart on Whiteboard in Office. A detailed flowchart illustrating data processing and model training is drawn on a. A detailed flowchart illustrating data processing and model training is drawn on a whiteboard in a modern office environment with people working in the background
Free with trial A data flow diagram or flowchart, representing data processing and information flow, ideal for technology, data management, and process visualization and system analysis png transparent image Generative AI. Data processing flowchart vectors Data flow diagram, flowchart, data processing, information flow, tech, diagram png transparent image Generative AI. A data flow diagram or flowchart, representing data processing and information flow, ideal for technology, data management, and process visualization and system analysis png transparent image Generative AI
Free with trial Illustrative flowchart depicting the stages of data processing, highlighting compliance with GDPR and CCPA regulations. Suitable for use in articles, presentations, or websites related to data privacy, security, and legal compliance. Data processing flowchart illustrations Data Processing Flowchart with GDPR and CCPA Compliance. Illustrative flowchart depicting the stages of data processing, highlighting compliance with GDPR and CCPA regulations. Suitable for use in articles, presentations, or websites related to data privacy, security, and legal compliance
Free with trial A clear flowchart diagram composed of various and connecting lines, depicting data processing, storage, and governing processes within a system. Data processing flowchart illustrations Flowchart diagram illustrating data processing storage and governing processes with. A clear flowchart diagram composed of various and connecting lines, depicting data processing, storage, and governing processes within a system
Free with trial A minimalist vector illustration of a brain surrounded by a circular flowchart representing data analysis processing and artificial intelligence This. Data processing flowchart vectors Brain With Circular Flowchart Symbolizing Data Processing. A minimalist vector illustration of a brain surrounded by a circular flowchart representing data analysis processing and artificial intelligence This
Free with trial Close-up of hands typing on a laptop keyboard, with a digital overlay of a flowchart and data processing elements, symbolizing business automation and technology solutions. Data processing flowchart illustrations Person working on laptop with flowchart and data processing visualization. Close-up of hands typing on a laptop keyboard, with a digital overlay of a flowchart and data processing elements, symbolizing business automation and technology solutions
Free with trial A blurred office setting serves as a backdrop for a digital flowchart depicting data sources, processing, and user access with prominent shield. Data processing flowchart illustrations Blurred office background with a digital flowchart illustrating data flow, processing, and user access with shield. A blurred office setting serves as a backdrop for a digital flowchart depicting data sources, processing, and user access with prominent shield
Free with trial A glowing blue digital flowchart a core processing hub with interconnected modules for security, data management, user access, and analytics. Data processing flowchart illustrations Digital flowchart illustrating core processing hub with security and data management. A glowing blue digital flowchart a core processing hub with interconnected modules for security, data management, user access, and analytics
Free with trial Algorithm flowchart showing data processing steps with connected blocks and lines for clear visualization. Data processing flowchart illustrations Algorithm flowchart showing data processing steps
Free with trial Representing showing simple flowchart diagram with representing data processing and user interaction on a white background. resolution. Data processing flowchart illustrations Simple Flowchart Diagram with Representing Data Processing and User Interaction on a White Background
Free with trial A neon-lit flowchart illustrates AI data processing, showing connections between data, process, AI, and output icons on a dark circuit board background. Data processing flowchart illustrations AI data processing and output flowchart with neon glowing icons and lines on dark background artificial intelligence. A neon-lit flowchart illustrates AI data processing, showing connections between data, process, AI, and output icons on a dark circuit board background
Free with trial The a detailed flowchart illustrating the stages of data processing from collection to decision making, highlighting various tools and technologies used at each stage. Data processing flowchart illustrations A flowchart diagram showing a data processing pipeline with stages from data collection to decision making using various tools and. The a detailed flowchart illustrating the stages of data processing from collection to decision making, highlighting various tools and technologies used at each stage
Free with trial Simple black and white vector icon of an algorithm flowchart showing data processing with arrows. Data processing flowchart illustrations Algorithm flowchart showing data processing with arrows
Free with trial A concise vector icon illustrating a flowchart with interconnected points and arrows. Represents data processing, workflow, and logical sequences. Perfect for presentations, educational materials, and software development, vector design Generative AI. Data processing flowchart vectors Flowchart Data Processing Interconnected Points, vector design Generative AI. A concise vector icon illustrating a flowchart with interconnected points and arrows. Represents data processing, workflow, and logical sequences. Perfect for presentations, educational materials, and software development, vector design Generative AI
Free with trial A vector flowchart illustrating a complex input being processed and simplified into clear outputs. This icon is perfect for explaining data processing, workflow optimization, system logic, and information management concepts. vector design Generative AI. Data processing flowchart vectors A data processing flowchart for system simplification vector design Generative AI. A vector flowchart illustrating a complex input being processed and simplified into clear outputs. This icon is perfect for explaining data processing, workflow optimization, system logic, and information management concepts. vector design Generative AI
Free with trial A comprehensive vector illustration depicting cloud computing services integrated with flowchart elements, showcasing data processing and security. This graphic is ideal for IT services, cloud solutions, network architecture, or digital transformation concepts, vector design Generative AI. Data processing flowchart vectors Cloud Computing Flowchart, Data Processing and Security, vector design Generative AI. A comprehensive vector illustration depicting cloud computing services integrated with flowchart elements, showcasing data processing and security. This graphic is ideal for IT services, cloud solutions, network architecture, or digital transformation concepts, vector design Generative AI
Free with trial An intricate flowchart diagram icon illustrating interconnected nodes and pathways, perfect for representing data processing, network architecture, system logic, and information flow. Excellent for technology, programming, business analysis, and educational content. Visualizes complex processes clearly and concisely, vector design Generative AI. Data processing flowchart vectors Complex Flowchart Diagram Icon, Data Processing Networking, vector design Generative AI. An intricate flowchart diagram icon illustrating interconnected nodes and pathways, perfect for representing data processing, network architecture, system logic, and information flow. Excellent for technology, programming, business analysis, and educational content. Visualizes complex processes clearly and concisely, vector design Generative AI
Free with trial Flowchart depicting a data analysis process begins with 'Data Collection' and branches into 'Data Processing', 'Analysis', and 'Hypothesis Generation'. Each step features icons: gears for processing, magnifying glass for analysis, and light bulb for hypothesis. Arrows indicate flow with 'Yes' and 'No' pathways leading to 'Testing', 'Solution Implementation', and 'Monitoring', each represented by distinct icons. The structure highlights decision points and iterative loops, illustrating a comprehensive approach to handling data systematically. Data processing flowchart illustrations A data analysis flowchart illustrates the step-by-step process of data collection, processing, analysis, and hypothesis generation. Flowchart depicting a data analysis process begins with 'Data Collection' and branches into 'Data Processing', 'Analysis', and 'Hypothesis Generation'. Each step features icons: gears for processing, magnifying glass for analysis, and light bulb for hypothesis. Arrows indicate flow with 'Yes' and 'No' pathways leading to 'Testing', 'Solution Implementation', and 'Monitoring', each represented by distinct icons. The structure highlights decision points and iterative loops, illustrating a comprehensive approach to handling data systematically.