Free with trial Crisis chart and graph. Economic downturn with Increase and decrease arrow on the top of wooden blocks steps on desk, eco style. The business volatility trend process, finance, and economic concept , Generative Ai. Decrease arrow chart illustrations Crisis chart and graph. Economic downturn with Increase and decrease arrow on the top of wooden blocks steps on desk, eco style.
Free with trial A 3D bar chart shows a significant downward trend with a prominent red arrow indicating a steep financial decline and market drop. Decrease arrow chart illustrations Financial downturn declining bar chart with red arrow symbolizing loss and decrease. A 3D bar chart shows a significant downward trend with a prominent red arrow indicating a steep financial decline and market drop
Free with trial Bear or bearish market trend in crypto currency or stocks. Trade exchange background, down arrow graph for decrease in rates. Cryptocurrency price chart, blockchain technology. Global economy crash. , AI. Decrease arrow chart illustrations Bear or bearish market trend in crypto currency or stocks. Trade exchange background, down arrow graph for decrease in rates.
Free with trial Crisis chart and graph. Economic downturn with Increase and decrease arrow on the top of wooden blocks steps on desk, eco style. The business volatility trend process, finance, and economic concept , Generative Ai. Decrease arrow chart illustrations Crisis chart and graph. Economic downturn with Increase and decrease arrow on the top of wooden blocks steps on desk, eco style.
Free with trial Set Pie chart infographic, Graph, chart, diagram, Arrow, Financial growth decrease, and Target icon. Vector. Decrease arrow chart vectors Set Pie chart infographic, Graph, chart, diagram, Arrow, Financial growth decrease, and Target icon. Vector
Free with trial Set line Financial growth decrease Arrow Pie chart infographic Many ways directional arrow Pyramid infographics and Graph chart diagram icon. Vector. Decrease arrow chart illustrations Set line Financial growth decrease, Arrow, Pie chart infographic, Many ways directional arrow, Pyramid infographics, and. Set line Financial growth decrease Arrow Pie chart infographic Many ways directional arrow Pyramid infographics and Graph chart diagram icon. Vector.
Free with trial Set line Pie chart infographic Pyramid infographics Light bulb Financial growth decrease Unknown search Arrow and Target icon. Vector. Decrease arrow chart vectors Set line Pie chart infographic, Pyramid infographics, Light bulb, Financial growth decrease, Unknown search, Arrow, and. Set line Pie chart infographic Pyramid infographics Light bulb Financial growth decrease Unknown search Arrow and Target icon. Vector.
Free with trial Set Target Project team base Many ways directional arrow Clock Graph chart diagram Financial growth decrease and Flag icon. Vector. Decrease arrow chart illustrations Set Target, Project team base, Many ways directional arrow, Clock, Graph, chart, diagram, Financial growth decrease and. Set Target Project team base Many ways directional arrow Clock Graph chart diagram Financial growth decrease and Flag icon. Vector.
Free with trial Set Mountains with flag Financial growth decrease Dollar symbol Pie chart infographic Intersection point Arrow and icon. Vector. Decrease arrow chart illustrations Set Mountains with flag, Financial growth decrease, Dollar symbol, Pie chart infographic, Intersection point, Arrow, and. Set Mountains with flag Financial growth decrease Dollar symbol Pie chart infographic Intersection point Arrow and icon. Vector.
Free with trial A black bar chart graph with a falling arrow on a white background, indicating decline and decrease in data or business performance. Scalable format print and digital media. and projects. Decrease arrow chart vectors Black bar chart graph with falling arrow decline. A black bar chart graph with a falling arrow on a white background, indicating decline and decrease in data or business performance. Scalable format print and digital media. and projects
Free with trial A blue bar chart with four bars of decreasing height and a large blue downward arrow on the left side, indicating a decline or decrease in value. Scalable format print and digital media. Decrease arrow chart vectors Decreasing bar chart with downward arrow blue graph. A blue bar chart with four bars of decreasing height and a large blue downward arrow on the left side, indicating a decline or decrease in value. Scalable format print and digital media
Free with trial A dark blue bar chart with four bars and a large blue downward arrow crossing through it, indicating a downward trend or decrease in value. Scalable format print and digital media. Decrease arrow chart vectors Bar chart with downward trend line blue arrow graph statistics. A dark blue bar chart with four bars and a large blue downward arrow crossing through it, indicating a downward trend or decrease in value. Scalable format print and digital media
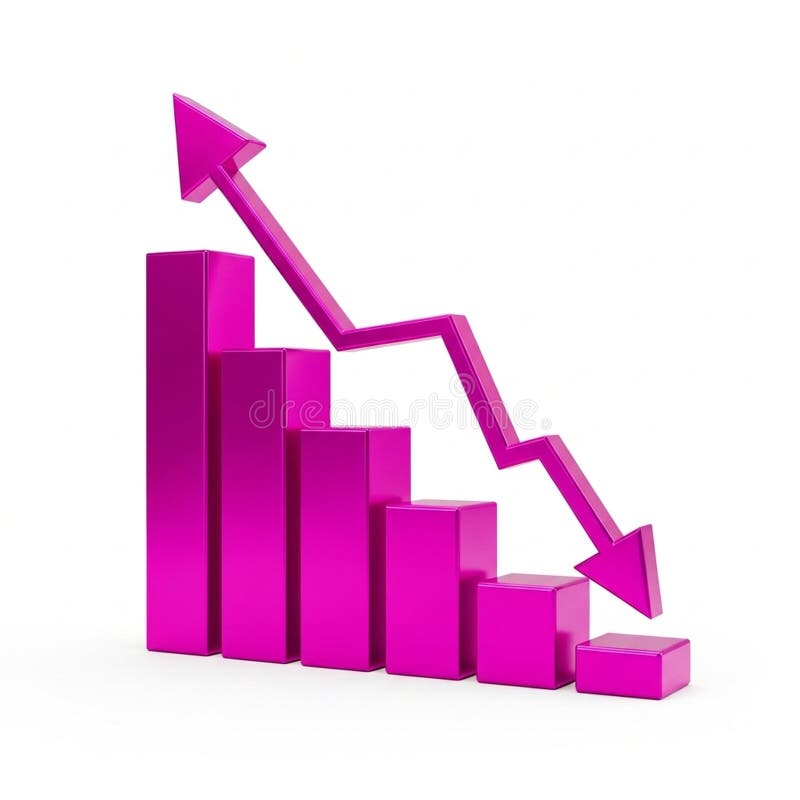
Free with trial A vibrant pink 3D bar chart illustrates financial data with a prominent downward-trending arrow superimposed. The bars decrease in height from left to right, signifying a decline. An upward-pointing arrow is positioned at the top left, indicating a contrasting upward trend. The graphic is isolated on a white background, making it suitable for presentations on financial performance, market trends,. Decrease arrow chart illustrations 3D Pink Bar Chart with Downward Trend Arrow and Upward Trend Arrow graph statistics. A vibrant pink 3D bar chart illustrates financial data with a prominent downward-trending arrow superimposed. The bars decrease in height from left to right, signifying a decline. An upward-pointing arrow is positioned at the top left, indicating a contrasting upward trend. The graphic is isolated on a white background, making it suitable for presentations on financial performance, market trends,
Free with trial A 3D rendered bar chart illustrating a significant downward trend. Three blue, rounded bars are displayed on a clean white background with subtle grid lines. A prominent, bold red arrow sharply descends across the bars, clearly indicating a decline, decrease, or negative progression. This graphic is ideal for representing financial losses, market downturns, business challenges, economic recession, or any statistical data showing a negative trend. It conveys concepts of risk, failure, and reduction in a clear, impactful visual manner for presentations, reports, and analytical content. Decrease arrow chart vectors Downward Trend Bar Chart with Red Arrow. A 3D rendered bar chart illustrating a significant downward trend. Three blue, rounded bars are displayed on a clean white background with subtle grid lines. A prominent, bold red arrow sharply descends across the bars, clearly indicating a decline, decrease, or negative progression. This graphic is ideal for representing financial losses, market downturns, business challenges, economic recession, or any statistical data showing a negative trend. It conveys concepts of risk, failure, and reduction in a clear, impactful visual manner for presentations, reports, and analytical content.
Free with trial Arrow 3d chart graph pointer, vector illustration. Up and down forward arrow, motion and navigation symbol, financial growth concept. Web design elements crease of decrease sign. Decrease arrow chart vectors Arrow navigation pointer, chart graph. Arrow 3d chart graph pointer, vector illustration. Up and down forward arrow, motion and navigation symbol, financial growth concept. Web design elements crease of decrease sign
Free with trial A 3D bar chart rendered in a vibrant pink color illustrates a significant downward trend. The bars decrease in height from left to right, culminating in a very short bar. A bold pink arrow, also in 3D, starts high on the left and sharply descends to the right, mirroring the decline shown by the bars. The entire graphic is isolated on a clean white background. Decrease arrow chart illustrations Pink 3D Bar Chart Showing a Downward Trend with an Arrow graph decline. A 3D bar chart rendered in a vibrant pink color illustrates a significant downward trend. The bars decrease in height from left to right, culminating in a very short bar. A bold pink arrow, also in 3D, starts high on the left and sharply descends to the right, mirroring the decline shown by the bars. The entire graphic is isolated on a clean white background
Free with trial A 3D bar chart rendered in a vibrant pink color illustrates a downward trend. The bars decrease in height from left to right, representing a decline in data or performance. A thick pink arrow with a sharp point follows the descending path of the bars, reinforcing the concept of a decrease. The chart is presented in isolation against a clean white background, making the visual elements stand out. Decrease arrow chart illustrations Pink Bar Chart with a Downward Trending Arrow Symbolizing Decline graph magenta. A 3D bar chart rendered in a vibrant pink color illustrates a downward trend. The bars decrease in height from left to right, representing a decline in data or performance. A thick pink arrow with a sharp point follows the descending path of the bars, reinforcing the concept of a decrease. The chart is presented in isolation against a clean white background, making the visual elements stand out
Free with trial A stylized, flat design illustration of a bar chart depicting a downward trend. The bars are colored red, yellow, and blue, arranged in decreasing height from left to right. A prominent red arrow points downwards across the chart, emphasizing the decline. The graphic is set against a clean white background, making it ideal for presentations, reports, and financial concepts related to loss, decrease, or negative performance. Decrease arrow chart illustrations Declining Bar Chart with Downward Arrow. A stylized, flat design illustration of a bar chart depicting a downward trend. The bars are colored red, yellow, and blue, arranged in decreasing height from left to right. A prominent red arrow points downwards across the chart, emphasizing the decline. The graphic is set against a clean white background, making it ideal for presentations, reports, and financial concepts related to loss, decrease, or negative performance.
Free with trial A 3D bar chart illustrates a downward trend against a white background. The bars, colored red, yellow, green, and blue, decrease in height from left to right. A thick black arrow curves downwards, pointing towards the shortest bar, visually reinforcing the concept of decline or loss. Decrease arrow chart illustrations Downward Trend Bar Chart with Red Yellow Green Blue Bars and Black Arrow on White Background. A 3D bar chart illustrates a downward trend against a white background. The bars, colored red, yellow, green, and blue, decrease in height from left to right. A thick black arrow curves downwards, pointing towards the shortest bar, visually reinforcing the concept of decline or loss
Free with trial A visual representation of a declining trend, depicted by a blue bar chart with a prominent downward-pointing arrow, indicating a decrease in performance or value. Decrease arrow chart illustrations Blue bar chart with a downward trending arrow. A visual representation of a declining trend, depicted by a blue bar chart with a prominent downward-pointing arrow, indicating a decrease in performance or value
Free with trial Financial crisis, economic downturn, bankruptcy concept. 3D blue glass bar chart icon with arrow down, recession graph. Falling price, decline profit or asset value, decrease in sales. 3D illustration. Decrease arrow chart illustrations Financial crisis, economic downturn, bankruptcy concept. 3D blue glass bar chart icon with arrow down, recession graph. Falling
Free with trial A colorful bar chart illustrates a downward trend, with a prominent red arrow indicating a significant decrease in data. Decrease arrow chart illustrations Bar chart showing declining trend with red arrow. A colorful bar chart illustrates a downward trend, with a prominent red arrow indicating a significant decrease in data
Free with trial A red downward arrow and a red bar chart showing a decline are presented on a white background. Decrease arrow chart illustrations Red Downward Arrow and Bar Chart Symbolizing Decrease and Decline Keywords: decrease, decline, down, arrow, bar. A red downward arrow and a red bar chart showing a decline are presented on a white background
Free with trial A visual representation of a financial or business trend showing a steady decrease over time. The bar chart illustrates negative performance with a prominent downward arrow. Decrease arrow chart illustrations Declining bar chart showing downward trend with arrow. A visual representation of a financial or business trend showing a steady decrease over time. The bar chart illustrates negative performance with a prominent downward arrow
Free with trial Downturn showing downward trending graph with arrow indicating decline keywords: graph, chart, decline. Decrease arrow chart illustrations Downward Trending Graph With Arrow Indicating Decline Keywords: graph, chart, decline, decrease. Downturn showing downward trending graph with arrow indicating decline keywords: graph, chart, decline
Free with trial A downward trending chart line with an arrow shows negative movement against a dark background and can be used to represent concepts like loss or decrease. Decrease arrow chart illustrations Decreasing Chart with Downward Arrow. A downward trending chart line with an arrow shows negative movement against a dark background and can be used to represent concepts like loss or decrease
Free with trial Gold bars on graph and arrow up, growth, chart gold with increase and decrease, gold profit and loss concept. Decrease arrow chart vectors Gold bars on graph and arrow up, growth, chart gold with increase and decrease, gold profit and loss concept
Free with trial Profit icon. Coin growth vector illustration. Investment increase and decrease infographic. Statistic arrow symbol. Financial chart sign. Stock graph pictogram isolated. Decrease arrow chart vectors Profit icon. Coin growth vector illustration. Investment increase and decrease infographic. Statistic arrow symbol. Financial
Free with trial Circular bar chart with red upward arrow and dark gray downward arrow icon for growth and analytics featuring improvement, decrease, trend with. Decrease arrow chart vectors Circular bar chart with red upward arrow and dark gray downward arrow icon for growth
Free with trial Abstract illustration of a downward trending arrow chart. The arrows are depicted in varying shades of blue and green, suggesting a gradual decline. This image can be used to represent concepts such as loss, decrease, negative growth, or a downward trend in various fields like finance, sales, or performance metrics. The clean background and simple design make it versatile for presentations, reports, and infographics. Decrease arrow chart illustrations Decreasing Trend Arrow Chart. Abstract illustration of a downward trending arrow chart. The arrows are depicted in varying shades of blue and green, suggesting a gradual decline. This image can be used to represent concepts such as loss, decrease, negative growth, or a downward trend in various fields like finance, sales, or performance metrics. The clean background and simple design make it versatile for presentations, reports, and infographics.
Free with trial Red bar chart depicting a downward trend on a white background. The bars progressively decrease in height from left to right. An upward-pointing arrow emerges from the first bar, indicating initial growth. A curved, downward-pointing arrow overlays the bars, emphasizing the overall decline. The clear design conveys concepts of financial loss, decreasing statistics, or declining data points. Decrease arrow chart vectors Red bar chart showing a downward trend with an upward arrow and a falling arrow isolated on white background. Red bar chart depicting a downward trend on a white background. The bars progressively decrease in height from left to right. An upward-pointing arrow emerges from the first bar, indicating initial growth. A curved, downward-pointing arrow overlays the bars, emphasizing the overall decline. The clear design conveys concepts of financial loss, decreasing statistics, or declining data points.
Free with trial A bar chart displayed on an easel, illustrating a negative trend. The bars, a mix of blue and grey, show a progressive decrease in value. A prominent red arrow curves downwards across the chart, signifying a decline or loss. The presentation suggests a financial report or business analysis with unfavorable results. Decrease arrow chart illustrations Bar chart showing a downward trend with a red arrow indicating decline. A bar chart displayed on an easel, illustrating a negative trend. The bars, a mix of blue and grey, show a progressive decrease in value. A prominent red arrow curves downwards across the chart, signifying a decline or loss. The presentation suggests a financial report or business analysis with unfavorable results
Free with trial Modern vector icon showing a downward arrow over a bar chart with progressively smaller bars indicating decline or decrease. Decrease arrow chart illustrations Downward arrow with decreasing bar chart graphic. Modern vector icon showing a downward arrow over a bar chart with progressively smaller bars indicating decline. Modern vector icon showing a downward arrow over a bar chart with progressively smaller bars indicating decline or decrease
Free with trial Gray bar chart with red line graph and downward arrow, illustrating decline, decrease, loss, and negative trend. Decrease arrow chart vectors Bar chart with downward red arrow, symbolizing decline. Gray bar chart with red line graph and downward arrow, illustrating decline, decrease, loss, and negative trend
Free with trial Decline graph chart icon. Descending market stock scheme vector illustration. Decrease statistics symbol. Failing finance data sign. Arrow down economic analysis. Business loss trend. Report diagram. Decrease arrow chart vectors Decline graph chart icon. Descending market stock scheme vector illustration. Decrease statistics symbol. Failing finance data
Free with trial A chart showing a decrease with an arrow pointing down, isolated on a white background, representing a decline in data or performance. Decrease arrow chart illustrations Decreasing chart with arrow isolated on white background. A chart showing a decrease with an arrow pointing down, isolated on a white background, representing a decline in data or performance
Free with trial A 3D rendered bar chart illustrating a downward trend. The bars, colored black, green, orange, red, and a lighter red, decrease in height from left to right. A vibrant purple arrow points downwards, diagonally across the bars, signifying a decrease or negative movement. The object is isolated on a white background. Decrease arrow chart illustrations 3D Bar Chart with Purple Downward Arrow on White Background. A 3D rendered bar chart illustrating a downward trend. The bars, colored black, green, orange, red, and a lighter red, decrease in height from left to right. A vibrant purple arrow points downwards, diagonally across the bars, signifying a decrease or negative movement. The object is isolated on a white background
Free with trial The image depicts a bar chart showing a significant decline in values across five categories, accompanied by a bold downward red arrow emphasizing the sharp decrease. The bars progressively shorten from left to right, indicating a continuous drop in whatever metric is being measured. Decrease arrow chart illustrations Declining trend illustrated with bar chart and downward arrow. The image depicts a bar chart showing a significant decline in values across five categories, accompanied by a bold downward red arrow emphasizing the sharp decrease. The bars progressively shorten from left to right, indicating a continuous drop in whatever metric is being measured
Free with trial A line art illustration of a man presenting a whiteboard with a large downward-pointing arrow. This graphic effectively represents a decrease, decline, or negative trend in sales, finance, or other data. Useful for business reports. vector design Generative AI. Decrease arrow chart vectors Businessman Presenting a Chart with a Downward Arrow. Decrease. vector design Generative AI. A line art illustration of a man presenting a whiteboard with a large downward-pointing arrow. This graphic effectively represents a decrease, decline, or negative trend in sales, finance, or other data. Useful for business reports. vector design Generative AI
Free with trial The image shows a bar chart with green bars that progressively decrease in height from left to right, illustrating a downward trend. A bold red diagonal arrow points downward, emphasizing the decline in values or performance over time. Decrease arrow chart illustrations Decline in bar chart growth represented by a downward red arrow. The image shows a bar chart with green bars that progressively decrease in height from left to right, illustrating a downward trend. A bold red diagonal arrow points downward, emphasizing the decline in values or performance over time
Free with trial This image features a candlestick chart with an upward trend indicated by a red arrow. The chart is isolated on a white background, showcasing various green and red candlesticks representing price movements. The candlesticks illustrate fluctuations in stock prices, with green indicating an increase and red indicating a decrease. This visual aid is commonly used in financial analysis to track. Decrease arrow chart illustrations Candlestick chart with uptrend arrow isolated on white background. This image features a candlestick chart with an upward trend indicated by a red arrow. The chart is isolated on a white background, showcasing various green and red candlesticks representing price movements. The candlesticks illustrate fluctuations in stock prices, with green indicating an increase and red indicating a decrease. This visual aid is commonly used in financial analysis to track
Free with trial A hand-drawn illustration showing a bar chart with a downward arrow, symbolizing a decline in values, recession, decrease, or negative trends. The minimalistic sketch represents loss, degradation, or economic downturn. Decrease arrow chart illustrations Hand-Drawn Declining Bar Chart with Arrow Illustrating Negative Growth Trend. A hand-drawn illustration showing a bar chart with a downward arrow, symbolizing a decline in values, recession, decrease, or negative trends. The minimalistic sketch represents loss, degradation, or economic downturn
Free with trial The image features a visual representation of a declining trend using a bar chart on an easel. The bars decrease in height from left to right, transitioning from blue to green, and are topped with a bold red downward arrow, symbolizing a downward trend or decline. Decrease arrow chart illustrations Declining bar chart illustrated on an easel with a red downward arrow. The image features a visual representation of a declining trend using a bar chart on an easel. The bars decrease in height from left to right, transitioning from blue to green, and are topped with a bold red downward arrow, symbolizing a downward trend or decline
Free with trial Red arrow pointing downwards financial chart. Economic recession. Financial crisis, stock market crash. Losses, decline, decrease, financial risk. Graph shows falling sales revenue. Decrease arrow chart illustrations Red arrow pointing downwards financial chart. Economic recession. Financial crisis, stock market crash. Losses, decline
Free with trial The image shows a whiteboard with a bar chart illustrating a series of bars that decrease in height. A red downward arrow is drawn over the bars, indicating a decline or negative trend. The whiteboard is set on a simple wooden easel with a small wooden figure on top, emphasizing the visual message of a downward trajectory in data or performance metrics. Decrease arrow chart illustrations Declining growth represented by a bar chart with a downward trend arrow. The image shows a whiteboard with a bar chart illustrating a series of bars that decrease in height. A red downward arrow is drawn over the bars, indicating a decline or negative trend. The whiteboard is set on a simple wooden easel with a small wooden figure on top, emphasizing the visual message of a downward trajectory in data or performance metrics
Free with trial A black bar chart icon with bars of decreasing height and a downward arrow indicating a decline. Decrease arrow chart illustrations Black Bar Chart Icon Showing Decline With Downward Arrow graph decrease. A black bar chart icon with bars of decreasing height and a downward arrow indicating a decline
Free with trial The image depicts a series of vertical bars in teal color, showing a gradual decrease in height from left to right. A large red downward-pointing arrow overlays the bars, emphasizing the trend of decline in the data represented. This visual is commonly used to illustrate decreasing performance, sales, or other metrics over time. Decrease arrow chart illustrations Declining bar chart with a downward arrow indicating a decrease in values. The image depicts a series of vertical bars in teal color, showing a gradual decrease in height from left to right. A large red downward-pointing arrow overlays the bars, emphasizing the trend of decline in the data represented. This visual is commonly used to illustrate decreasing performance, sales, or other metrics over time
Free with trial The image shows a canvas propped up on an easel displaying a bar chart with bars of varying heights that decrease from left to right. A red arrow points downward from the top right corner of the canvas, symbolizing a decline or downward trend. Decrease arrow chart illustrations Declining bar chart illustration on an easel with a red downward arrow. The image shows a canvas propped up on an easel displaying a bar chart with bars of varying heights that decrease from left to right. A red arrow points downward from the top right corner of the canvas, symbolizing a decline or downward trend
Free with trial Line chart with bars and a red arrow going downwards to signify a financial decrease. Decrease arrow chart vectors Declining stock market chart with red arrow indicating loss, economy crisis. Line chart with bars and a red arrow going downwards to signify a financial decrease.
Free with trial Bar chart with downward trending arrow, representing loss, decrease, or recession. Decrease arrow chart vectors Bar chart with downward trending arrow, representing loss, decrease, or recession
Free with trial A stylized black and white illustration shows a bar chart with bars of decreasing height, leading to a sharp downward-pointing arrow. Decrease arrow chart vectors Decreasing bar chart with downward arrow decrease downward recession statistics negative. A stylized black and white illustration shows a bar chart with bars of decreasing height, leading to a sharp downward-pointing arrow
Free with trial Set line Hierarchy organogram chart Many ways directional arrow Graph diagram Dollar symbol Financial growth decrease Clock Intersection point and Arrow icon. Vector. Decrease arrow chart vectors Set line Hierarchy organogram chart, Many ways directional arrow, Graph, diagram, Dollar symbol, Financial growth. Set line Hierarchy organogram chart Many ways directional arrow Graph diagram Dollar symbol Financial growth decrease Clock Intersection point and Arrow icon. Vector.
Free with trial A 3D rendered bar chart illustrates a downward trend. Two tall green bars are followed by two shorter pink bars, representing a decrease in value. A bright yellow arrow sharply descends from right to left, crossing over the bars and emphasizing the decline. The composition is set against a solid light blue background. Decrease arrow chart illustrations 3D Bar Chart with Falling Yellow Arrow Indicating Decline on Blue Background graph. A 3D rendered bar chart illustrates a downward trend. Two tall green bars are followed by two shorter pink bars, representing a decrease in value. A bright yellow arrow sharply descends from right to left, crossing over the bars and emphasizing the decline. The composition is set against a solid light blue background
Free with trial A striking red downward arrow is prominently placed on a chart highlighting a notable decrease in financial metrics over time suggesting a troubling trend in market analysis. Decrease arrow chart illustrations A striking red downward arrow is prominently placed on a chart highlighting a notable decrease in financial metrics over time
Free with trial A flat icon of a bar chart with a downward arrow and a dollar symbol, representing financial loss, market decline, decreased revenue, negative performance, economic downturns, and investment risks in business environments. Decrease arrow chart vectors Declining financial chart icon with downward arrow showing loss decrease and negative dollar trend. A flat icon of a bar chart with a downward arrow and a dollar symbol, representing financial loss, market decline, decreased revenue, negative performance, economic downturns, and investment risks in business environments.
Free with trial Graphic representation of declining business. Bar chart shows falling trend. Arrow points downwards. Silhouettes of people signify workforce reduction. Concept for economic downturn, negative growth, or company challenges. Decrease arrow chart illustrations Declining bar chart with downward arrow and silhouettes of people representing decrease in workforce or business performance loss. Graphic representation of declining business. Bar chart shows falling trend. Arrow points downwards. Silhouettes of people signify workforce reduction. Concept for economic downturn, negative growth, or company challenges
Free with trial Red arrow going down stock icon on white background. Decrease, Bankruptcy, financial market crash icon for your web site design, logo, app, UI. graph chart downtrend symbol. chart going down sign. Decrease arrow chart vectors Red arrow going down stock icon on white background. Decrease, Bankruptcy, financial market crash icon
Free with trial Gold bars on graph and arrow down, fall, chart gold with increase and decrease, gold profit and loss concept. Decrease arrow chart vectors Gold bars on graph and arrow down, fall, chart gold with increase and decrease, gold profit and loss concept
Free with trial Bear or bearish market trend in crypto currency or stocks. Trade exchange background, down arrow graph for decrease in rates. Cryptocurrency price chart, blockchain technology. Global economy crash. , AI. Decrease arrow chart illustrations Bear or bearish market trend in crypto currency or stocks. Trade exchange background, down arrow graph for decrease in rates.
Free with trial Bear or bearish market trend in crypto currency or stocks. Trade exchange background, down arrow graph for decrease in rates. Cryptocurrency price chart, blockchain technology. Global economy crash. , AI. Decrease arrow chart illustrations Bear or bearish market trend in crypto currency or stocks. Trade exchange background, down arrow graph for decrease in rates.
Free with trial Bear or bearish market trend in crypto currency or stocks. Trade exchange background, down arrow graph for decrease in rates. Cryptocurrency price chart, blockchain technology. Global economy crash. , AI. Decrease arrow chart illustrations Bear or bearish market trend in crypto currency or stocks. Trade exchange background, down arrow graph for decrease in rates.
Free with trial Bear or bearish market trend in crypto currency or stocks. Trade exchange background, down arrow graph for decrease in rates. Cryptocurrency price chart, blockchain technology. Global economy crash. , AI. Decrease arrow chart illustrations Bear or bearish market trend in crypto currency or stocks. Trade exchange background, down arrow graph for decrease in rates.
Free with trial Bear or bearish market trend in crypto currency or stocks. Trade exchange background, down arrow graph for decrease in rates. Cryptocurrency price chart, blockchain technology. Global economy crash. , AI. Decrease arrow chart illustrations Bear or bearish market trend in crypto currency or stocks. Trade exchange background, down arrow graph for decrease in rates.
Free with trial Bear or bearish market trend in crypto currency or stocks. Trade exchange background, down arrow graph for decrease in rates. Cryptocurrency price chart, blockchain technology. Global economy crash. , AI. Decrease arrow chart illustrations Bear or bearish market trend in crypto currency or stocks. Trade exchange background, down arrow graph for decrease in rates.
Free with trial Bear or bearish market trend in crypto currency or stocks. Trade exchange background, down arrow graph for decrease in rates. Cryptocurrency price chart, blockchain technology. Global economy crash. , AI. Decrease arrow chart illustrations Bear or bearish market trend in crypto currency or stocks. Trade exchange background, down arrow graph for decrease in rates.
Free with trial Bear or bearish market trend in crypto currency or stocks. Trade exchange background, down arrow graph for decrease in rates. Cryptocurrency price chart, blockchain technology. Global economy crash. , AI. Decrease arrow chart illustrations Bear or bearish market trend in crypto currency or stocks. Trade exchange background, down arrow graph for decrease in rates.
Free with trial Red 3D bar chart with descending trend line and arrow, set against a dark gradient background. The tallest bar on the left progressively declines toward the right, illustrating a decrease. The entire structure has a glossy finish, emphasizing the downward movement indicated by the arrowhead at the end of the line. The chart appears suspended centrally, providing a clear visual representation of a downward trend, often used in financial or analytical contexts to denote loss or decline. Decrease arrow chart illustrations Red 3D bar chart with descending trend line and arrow, set against a dark gradient
Free with trial A 3D white bar chart shows a significant downward trend indicated by a sharp, angled arrow pointing downwards. The bars decrease in height from left to right, illustrating a concept of decline or loss. The clean white background emphasizes the minimalist design and the stark visual representation of negative growth. Decrease arrow chart illustrations 3D White Bar Chart with Downward Trending Arrow on White Background graph decline. A 3D white bar chart shows a significant downward trend indicated by a sharp, angled arrow pointing downwards. The bars decrease in height from left to right, illustrating a concept of decline or loss. The clean white background emphasizes the minimalist design and the stark visual representation of negative growth
Free with trial A stark vector illustration of a bar chart showing a sharp decrease, indicated by a downward-pointing red arrow. This icon effectively represents economic downturns, financial losses, declining trends, or negative performance metrics. Ideal for business reports, financial analysis, or news graphics, vector design Generative AI. Decrease arrow chart vectors . A stark vector illustration of a bar chart showing a sharp decrease, indicated by a downward-pointing red arrow. This icon effectively represents economic downturns, financial losses, declining trends, or negative performance metrics. Ideal for business reports, financial analysis, or news graphics, vector design Generative AI
Free with trial Businessman stick figure character looking bad result presentation chart with red crisis arrow down. failed diagram, bankruptcy, decrease financial problem. hand drawn style doodle illustration. Decrease arrow chart vectors Businessman stick figure character looking bad result presentation chart with red crisis arrow down. failed diagram, bankruptcy
Free with trial A 3D rendered bar chart displaying a downward trend. The bars, colored black, blue, green, yellow, and orange, decrease in height from left to right. A bold red arrow points downwards, diagonally across the bars, indicating a decline or loss. The chart is presented on a white background. Decrease arrow chart illustrations 3D Bar Chart with Red Downward Arrow on White Background. A 3D rendered bar chart displaying a downward trend. The bars, colored black, blue, green, yellow, and orange, decrease in height from left to right. A bold red arrow points downwards, diagonally across the bars, indicating a decline or loss. The chart is presented on a white background
Free with trial Increase and decrease solid icon set, Arrow Growth icon, and statistic symbol set. Business growth icon, increase, personal development, graph, and chart-related line vector. Decrease arrow chart vectors Increase and decrease solid icon set, Arrow Growth icon, and statistic symbol set
Free with trial A chart showing a decrease with an arrow pointing down, isolated on a white background, representing a decline in data or performance. Decrease arrow chart illustrations Decreasing chart with arrow isolated on white background. A chart showing a decrease with an arrow pointing down, isolated on a white background, representing a decline in data or performance
Free with trial Profit rise and fall graph. Infographic with up and down arrow. Increase and decrease in amount money. Banknotes heap. Financial success. Economy crisis and recession. Statistics chart. Vector concept. Decrease arrow chart vectors Profit rise and fall graph. Infographic with up and down arrow. Increase and decrease in amount money. Banknotes heap. Financial
Free with trial This compelling visual representation showcases a clear negative trend. A vibrant red downward arrow icon serves as a potent indicator of decline, positioned prominently against a pristine white background. The simple, yet impactful, chart surrounding the arrow depicts a consistently sloping downward line, visually reinforcing the concept of a fall or decrease in value. This graphic serves as a. Decrease arrow chart illustrations Visualizing Declining Trends A Downward Arrow Chart Illustrates Negative Performance. This compelling visual representation showcases a clear negative trend. A vibrant red downward arrow icon serves as a potent indicator of decline, positioned prominently against a pristine white background. The simple, yet impactful, chart surrounding the arrow depicts a consistently sloping downward line, visually reinforcing the concept of a fall or decrease in value. This graphic serves as a
Free with trial A minimalist 3D white bar chart displays a clear downward trend. Four bars of decreasing height are shown, with a sharp white arrow pointing downwards from the top of the second bar, indicating a significant decline. The chart is presented in isolation against a clean white background, emphasizing the concept of financial or economic downturn. Decrease arrow chart illustrations 3D White Bar Chart with a Downward Trending Arrow Symbolizing Decline graph decrease. A minimalist 3D white bar chart displays a clear downward trend. Four bars of decreasing height are shown, with a sharp white arrow pointing downwards from the top of the second bar, indicating a significant decline. The chart is presented in isolation against a clean white background, emphasizing the concept of financial or economic downturn
Free with trial Set line Financial growth decrease, Arrow, Pie chart infographic and Factory icon. Vector. Decrease arrow chart illustrations Set line Financial growth decrease, Arrow, Pie chart infographic and Factory icon. Vector
Free with trial Stacks of gold coins decrease in size as a red arrow points downwards over a stock market chart, indicating financial decline. Decrease arrow chart illustrations Stacks of gold coins decreasing in size with a red downward arrow and stock market chart red arrow. Stacks of gold coins decrease in size as a red arrow points downwards over a stock market chart, indicating financial decline
Free with trial Financial chart illustration. Declining graphic concept. Red arrow decrease Vector. Business diagram symbol. EPS 10. Decrease arrow chart vectors Financial chart illustration. Declining graphic concept. Red arrow decrease Vector. Business diagram symbol.
Free with trial Profit growing and decrease sumbol. Statistic up and down arrows. Business growths chart. Green and red arrow - stock vector. Decrease arrow chart illustrations Profit growing and decrease sumbol. Statistic up and down arrows. Business growths chart. Green and red arrow - stock vector