Free with trial Simple Set of Graph Related Vector Line Icons. Contains such Icons as Report, Abstract Chart Presentation, Increase - Decrease Graph and more. Editable Stroke. 48x48 Pixel Perfect. Decrease arrow chart vectors Line Graph Icons. Simple Set of Graph Related Vector Line Icons. Contains such Icons as Report, Abstract Chart Presentation, Increase - Decrease Graph and more. Editable Stroke. 48x48 Pixel Perfect.
Free with trial Chart and money flying away -- yen note. Decrease arrow chart vectors Loosing money. Chart and money flying away -- yen note
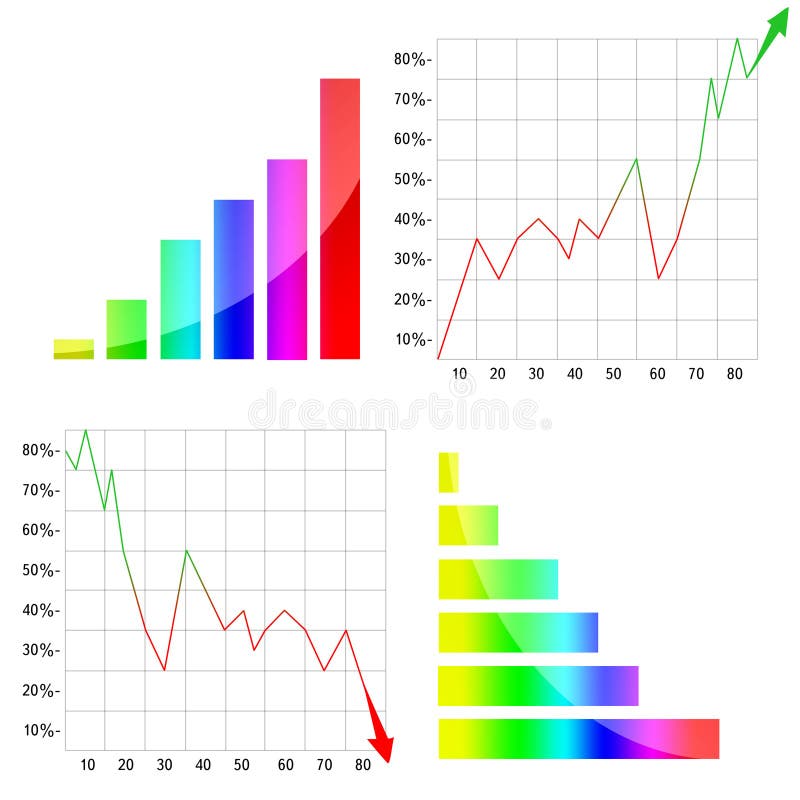
Free with trial Graph going up and down arrow green and red icon. The rise and fall of business, shares, prices vector desing. Decrease arrow chart vectors Graph going up and down arrow green and red icon. The rise and fall of business, shares, prices vector
Free with trial 3d model of financial graph with red backlight on blue background, stock market financing chart, economic boom and bust, investment bankruptcy and inflation, global rising and falling economy. 3D rendering. Decrease arrow chart illustrations 3d model of financial graph with red backlight on blue background, stock market financing chart, economic boom and bust
Free with trial A businessman holds banknotes, runs away from stack of money bar chart with red graph down. Withdraw capital in business recession, economic strategy, financial, market performance, loss management. Decrease arrow chart vectors A businessman holds banknotes, runs away from stack of money bar chart with red graph down. Withdraw capital in business recession
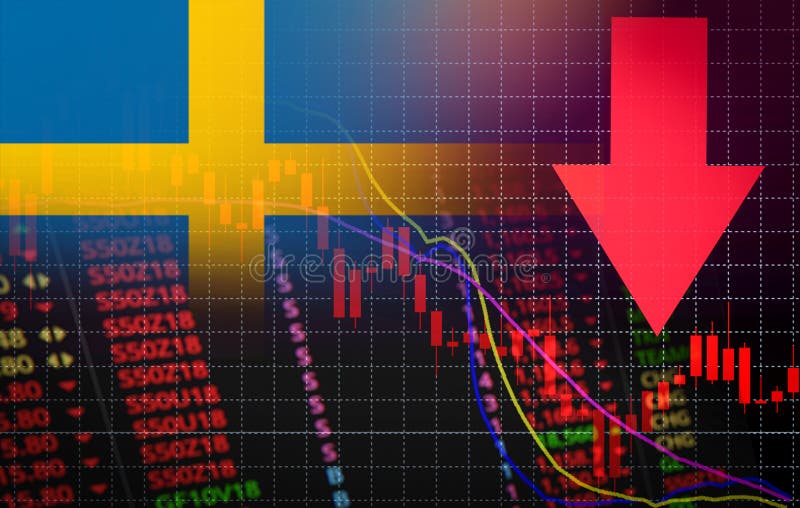
Free with trial Sweden Stock Exchange market crisis red market price down chart fall / Stock analysis or forex charts graph Business and finance money crisis red negative drop in sales economic fall. Decrease arrow chart illustrations Sweden Stock Exchange market crisis red market price down chart fall Business and finance money crisis red negative drop in sales. Sweden Stock Exchange market crisis red market price down chart fall / Stock analysis or forex charts graph Business and finance money crisis red negative drop in sales economic fall
Free with trial White arrow falls against the background of the flag of the China. Decrease arrow chart illustrations White arrow falls against the background of the flag China
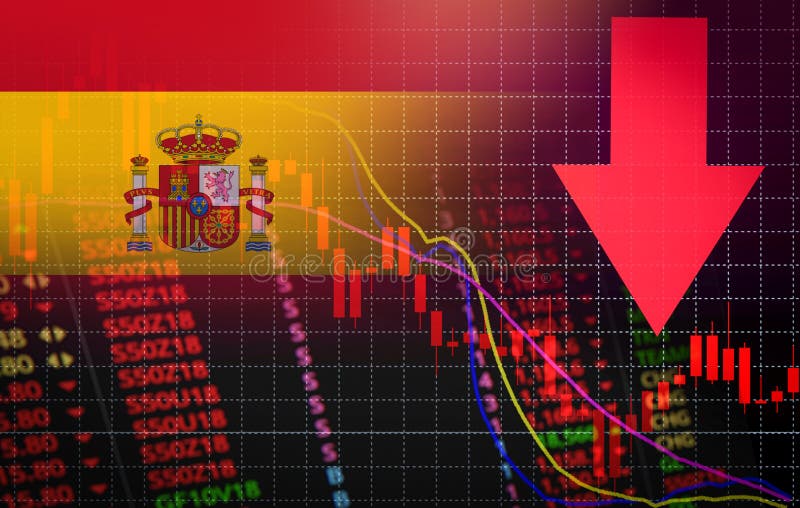
Free with trial Spain Stock Exchange market crisis red market price down chart fall / Stock analysis or forex charts graph Business and finance money crisis red negative drop in sales economic fall. Decrease arrow chart illustrations Spain Stock Exchange market crisis red market price down chart fall Business and finance money crisis red negative drop in sales. Spain Stock Exchange market crisis red market price down chart fall / Stock analysis or forex charts graph Business and finance money crisis red negative drop in sales economic fall
Free with trial Mortality decline chart. Graph deaths fall. vector illustration. Decrease arrow chart vectors Mortality decline chart. Graph deaths fall. vector illustration
Free with trial White arrow falls against the background of the flag of the Turkey. Decrease arrow chart illustrations Arrow falls against the background of the flag of the Turk
Free with trial Map of USA Recession Economic Crisis Creative Concept with Economic Crash Arrow Vector Illustration Design. Decrease arrow chart vectors Map of USA Recession Economic Crisis Creative Concept with Economic Crash Arrow
Free with trial Canada Stock Exchange market crisis red market price down chart fall / Stock analysis or forex charts graph Business and finance money crisis background red negative drop in sales economic fall. Decrease arrow chart illustrations Canada Stock Exchange market crisis red market price down chart fall Business and finance money crisis background red negative. Canada Stock Exchange market crisis red market price down chart fall / Stock analysis or forex charts graph Business and finance money crisis background red negative drop in sales economic fall
Free with trial Crash Economics Ukraine. Red down arrow on the map of Ukraine. Economic decline. Downward trends in the economy. Isolated. Business. Decrease arrow chart illustrations Crash Economics Ukraine. Red down arrow on the map of Ukraine. Economic decline. Downward trends in the economy. Isolated
Free with trial Map of United Kingdom Recession Economic Crisis Creative Concept with Economic Crash Arrow Vector Illustration Design. Decrease arrow chart vectors Map of United Kingdom Recession Economic Crisis Creative Concept with Economic Crash Arrow
Free with trial Fall of the Thailand Economy. Recession graph with a red arrow on the Thailand flag. Economic decline. Decline in the economy of stock trading. Downward trends in the economy. Business. Decrease arrow chart illustrations Fall of the Thailand Economy. Recession graph with a red arrow on the Thailand flag. Economic decline. Decline in the economy of
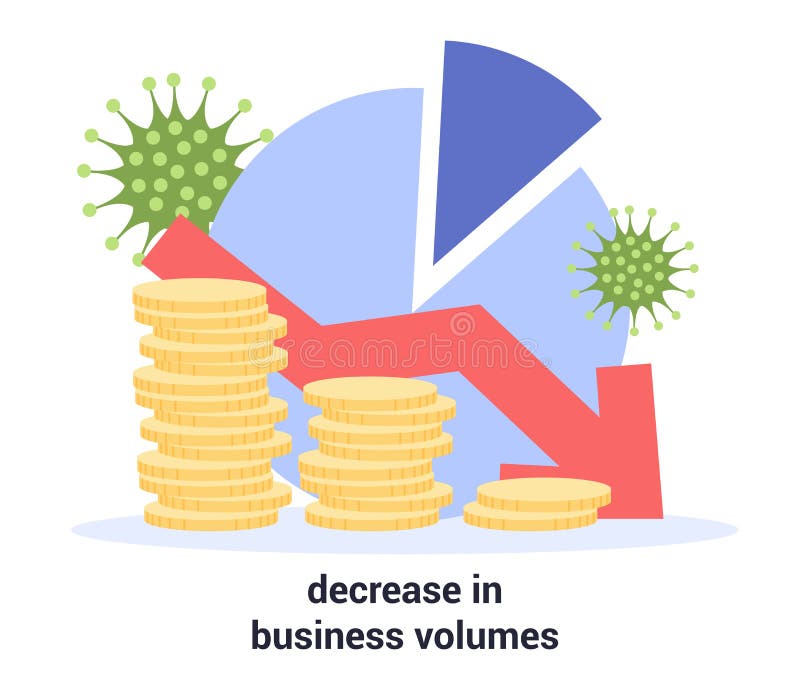
Free with trial Global decrease of business volumes due to COVID-19. 2019-nCoV, pandemic global impact. Isolated vector illustration. Decrease arrow chart vectors Global decrease of business volumes due to COVID-19. 2019-nCoV
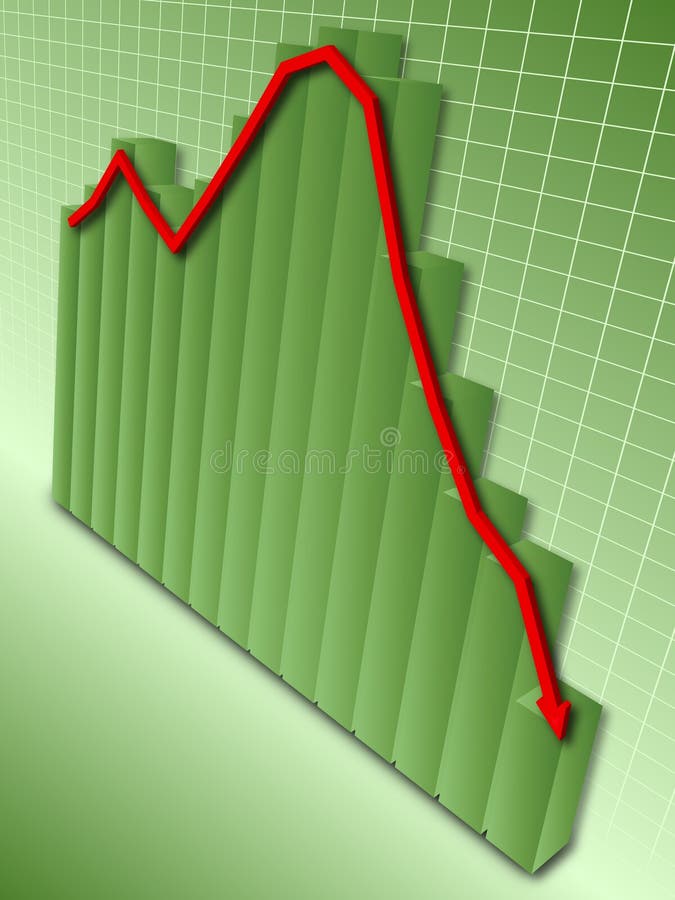
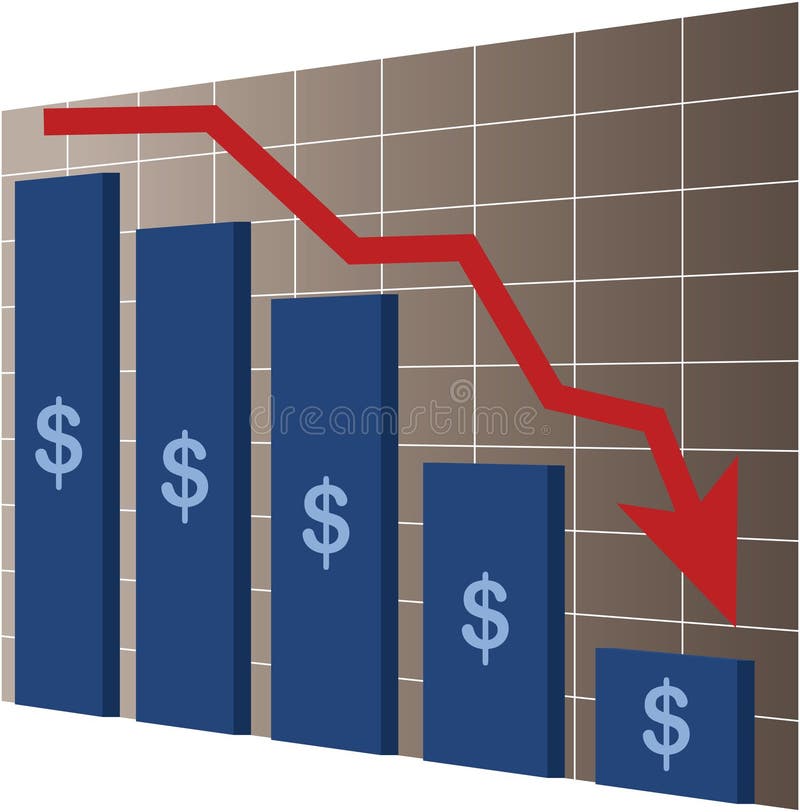
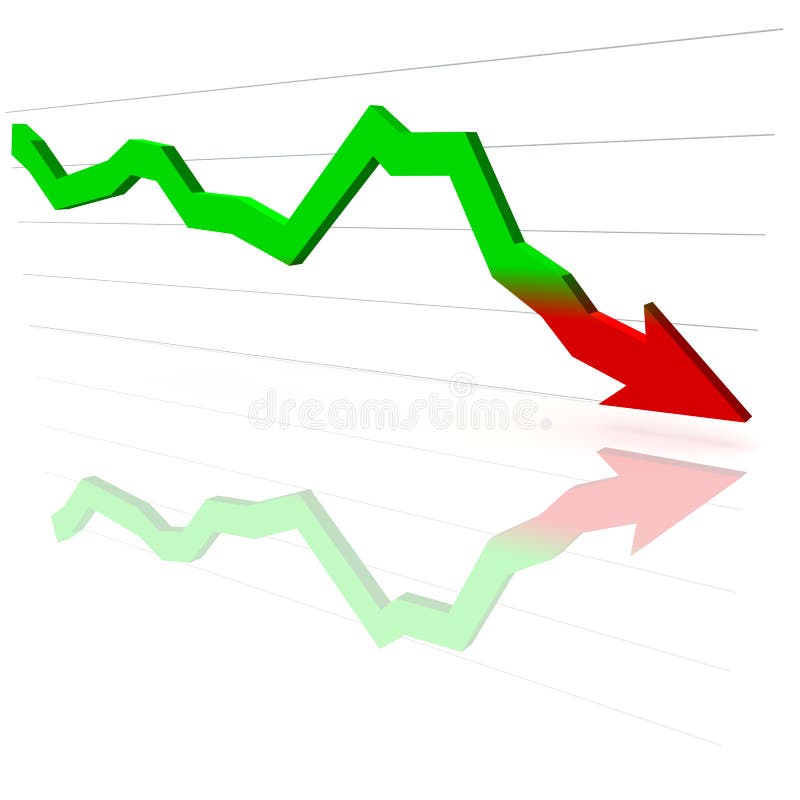
Free with trial Green bar graph with red arrow depicting downward trend of data symbolizing financial loss. Decrease arrow chart vectors Financial Loss
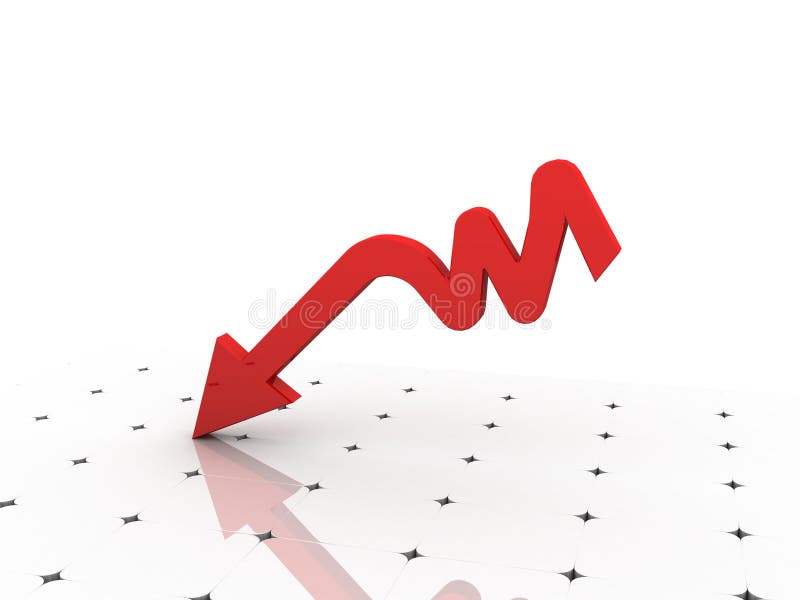
Free with trial Graph showing decrease in profits or earnings in 3D on white background. Decrease arrow chart illustrations Decrease
Free with trial Digital illustration of business graph with arrow showing growth and profit. Decrease arrow chart illustrations Business graph
Free with trial Financial crisis illustration with bars and red arrow. Decrease arrow chart vectors Financial crisis
Free with trial A 3d chart for a bad trend. Decrease arrow chart illustrations Negative trend. A 3d chart for a bad trend
Free with trial Chart of sales is in decline, but the businessman was planning success. Decrease arrow chart vectors Business failure. Chart of sales is in decline, but the businessman was planning success
Free with trial Financial 3D graph showing decrease in profits. Decrease arrow chart illustrations Financial 3D graph
Free with trial Profit warning and economic market value decline as a financial metaphor for falling lower earnings guidance signs as a profits chart casting a down arrow as a 3D illustration. Decrease arrow chart illustrations Profit Warning Financial Idea. Profit warning and economic market value decline as a financial metaphor for falling lower earnings guidance signs as a profits chart casting a down arrow as a 3D illustration.
Free with trial Businessman lifting up gold red from red critical graph, create by vector. Decrease arrow chart vectors Businessman lifting up red arrow from critical. Businessman lifting up gold red from red critical graph, create by vector
Free with trial Colorful graph / diagram with arrow. Decrease arrow chart illustrations Colorful graph
Free with trial Cartoon stick man drawing conceptual illustration of businessman walking on top of chart and facing low profit data. Business concept of bankrupt and crisis. Decrease arrow chart vectors Conceptual Cartoon of Businessman Facing Crisis. Cartoon stick man drawing conceptual illustration of businessman walking on top of chart and facing low profit data. Business concept of bankrupt and crisis.
Free with trial Charts and Diagrams line icons. Report, 3D Chart, Block diagram and Dot Plot graph linear icons. Trend, Pyramid and Pie chart report symbols. Presentation infochart, process flow diagram. Vector. Decrease arrow chart vectors Charts and Diagrams line icons.
Free with trial Digital illustration of business graph with arrow showing growth and profit. Decrease arrow chart illustrations Business graph
Free with trial Illustration of an upset man looking at the declining arrow. Decrease arrow chart illustrations Hopeless man looking at loss. Illustration of an upset man looking at the declining arrow
Free with trial High quality render of concept image for growing sales indicated by growing graph bar and a downwards arrow symbol. The concept is also enchanced with a smooth gradient from blue to red, indicating the decrease of sales. Decrease arrow chart illustrations Sales Drop with arrow symbol (concept image). High quality render of concept image for growing sales indicated by growing graph bar and a downwards arrow symbol. The concept is also enchanced with a smooth gradient from blue to red, indicating the decrease of sales.
Free with trial Businessman with red pencil arrow graph down. Decrease arrow chart illustrations Businessman graph. Businessman with red pencil arrow graph down
Free with trial Digital illustration of business graph with arrow showing growth and profit. Decrease arrow chart illustrations Business graph
Free with trial Income fall. Business recession and financial losses vector illustration, arrow down money budget low, stocks reduction and expenses costs concept, profitability crisis graph downward. Decrease arrow chart vectors Income fall graph downward. Income fall. Business recession and financial losses vector illustration, arrow down money budget low, stocks reduction and expenses costs concept, profitability crisis graph downward
Free with trial 3d render image of golden bars with chart. Decrease arrow chart illustrations 3d render image of golden bars with declining graph. 3d render image of golden bars with chart
Free with trial Graph icons, chart icons set and data form. Decrease arrow chart illustrations Graph icons
Free with trial Digital illustration of business graph with arrow showing growth and profit. Decrease arrow chart illustrations Business graph
Free with trial Graphs with arrows going up and down illustration on white background. Business chart drawing. Decrease arrow chart illustrations Graphs with arrows going up and down freehand drawing. Graphs with arrows going up and down illustration on white background. Business chart drawing
Free with trial Graph showing decrease in profits or earnings in 3D on white background. Decrease arrow chart illustrations Graph showing decrease in profits or earnings
Free with trial Three blue percents with red arrow on the white background. Decrease arrow chart illustrations Interest Dip. Three blue percents with red arrow on the white background.
Free with trial Digital illustration of business graph with arrow showing growth and profit. Decrease arrow chart illustrations Business graph
Free with trial A background of Euros with an arrow going down. Decrease arrow chart illustrations Money going down. A background of Euros with an arrow going down.
Free with trial Financial 3D graph showing decrease in profits. Decrease arrow chart illustrations Financial 3D graph
Free with trial Stock market or crypto currency crash and going down, economic crisis or investing risk, volatility and fluctuation concept, businessman investor rodeo riding uncertainty decline red arrow graph. Decrease arrow chart vectors Stock market or crypto currency crash and going down, economic crisis or investing risk, volatility and fluctuation concept
Free with trial Vector Illustration of Sad Business Man Holding an Arrow Going Down. Decrease arrow chart vectors Sad Business Man Holding an Arrow Going Down
Free with trial An opening in a wall shaped like an arrow graph. Decrease arrow chart illustrations Opening in a wall graph. An opening in a wall shaped like an arrow graph
Free with trial Business concept illustration. Sitting sad businessman. Falling chart on the blue background. Elements are layered separately in vector file. Decrease arrow chart vectors Business concept illustration.
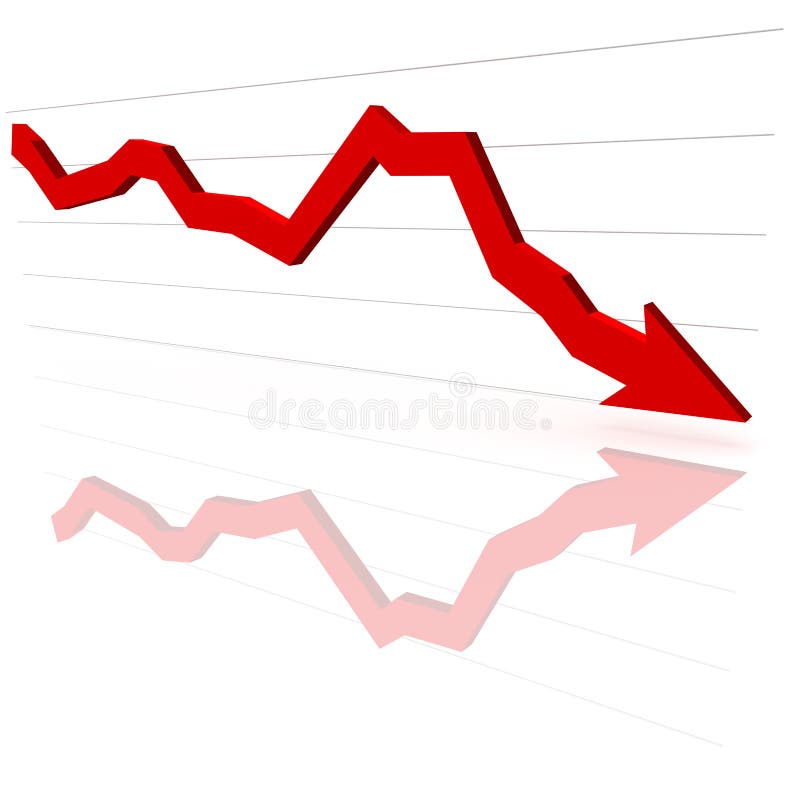
Free with trial A dramatic visual depicting a severe market crash or economic downturn. A vivid red line graph sharply descends, culminating in a downward-pointing arrow, set against a dark, stormy sky infused with abstract digital code elements. The reflective, gridded ground mirrors the ominous trend, amplifying the sense of crisis. This powerful image effectively conveys concepts of financial loss, business failure, data decline, and economic recession, making it suitable for news, financial reports, or presentations on negative market trends and risk. Decrease arrow chart illustrations Market Crash and Economic Downturn: Red Graph in Digital Storm. A dramatic visual depicting a severe market crash or economic downturn. A vivid red line graph. A dramatic visual depicting a severe market crash or economic downturn. A vivid red line graph sharply descends, culminating in a downward-pointing arrow, set against a dark, stormy sky infused with abstract digital code elements. The reflective, gridded ground mirrors the ominous trend, amplifying the sense of crisis. This powerful image effectively conveys concepts of financial loss, business failure, data decline, and economic recession, making it suitable for news, financial reports, or presentations on negative market trends and risk.
Free with trial Business People Group Fall Down Financial Bar Chart Crisis Concept Flat Vector Illustration. Decrease arrow chart vectors Business People Group Fall Down Financial Bar
Free with trial Stock market quotes graph chart loss crisis. Decrease arrow chart illustrations Stock market quotes graph loss crisis.
Free with trial HODL - word in bitcoin trading market data on red background chart. Virtual cryptocurrency concept. Decrease arrow chart illustrations HODL - word in bitcoin trading market
Free with trial Businessmen Show Finance Crisis Negative Graph Red Arrow Down, Business Hands Point Finger on Desk Flat Vector Illustration. Decrease arrow chart vectors Businessmen Show Finance Crisis Negative Graph Red
Free with trial Set statistics icon. Graphic analysis and asset management. Information chart profits. Business efficiency and investment. finance data. Line art, web and mobile app. Decrease arrow chart vectors Set statistics icon
Free with trial A 3D illustration depicting a businessman sitting on a crumbling rock, alongside a sharply falling red arrow, symbolizing market downturn and financial distress. The scene evokes feelings of anxiety and uncertainty related to economic instability and investment loss. Decrease arrow chart illustrations Market Crash Anxiety. A 3D illustration depicting a businessman sitting on a crumbling rock, alongside a sharply falling red arrow, symbolizing market downturn and financial distress. The scene evokes feelings of anxiety and uncertainty related to economic instability and investment loss.
Free with trial A 3D red downward-trending arrow graph with the text "INTEREST RATES" above it, set against a textured beige background. Image. Decrease arrow chart illustrations Interest Rates Downward Trend. A 3D red downward-trending arrow graph with the text "INTEREST RATES" above it, set against a textured beige background. Image
Free with trial A black businessman with falling down chart is confused. Bankruptcy concept. Vector line design illustration. Horizontal layout with a text space. Decrease arrow chart vectors Bankruptcy
Free with trial Set statistics icon. Graphic analysis and asset management. Information chart profits. Business efficiency and investment. finance data. flat design. Decrease arrow chart vectors Set statistics icon
Free with trial Chart with donwards arrow over a map of Asia. Decrease arrow chart illustrations Chart Asia down. Chart with donwards arrow over a map of Asia
Free with trial Revenue Income Costs Chart with sketched charts. Decrease arrow chart vectors Revenue Income Costs
Free with trial Bankrupt businessman standing on a background of decreasing chart. Bancrupt businessman unaware what to do with bankruptcy. Business bankruptcy concept. Vector flat design illustration. Square layout. Decrease arrow chart vectors Bancrupt business man vector illustration. Bankrupt businessman standing on a background of decreasing chart. Bancrupt businessman unaware what to do with bankruptcy. Business bankruptcy concept. Vector flat design illustration. Square layout.
Free with trial A graph showing negative growth with a big green arrow crashing through a floor isolated on a white background. Decrease arrow chart illustrations Sales Through The Floor Graph. A graph showing negative growth with a big green arrow crashing through a floor isolated on a white background
Free with trial A black businessman with falling down chart is confused. Bankruptcy concept. Vector line design illustration. Square layout. Decrease arrow chart vectors Bankruptcy
Free with trial Global economic slowdown, world GDP growth decline or sluggish, recession or growth slowing down concept, businessman pushing slow snail with the earth on GDP growing arrow metaphor of world economy. Decrease arrow chart vectors Global economic slowdown, world GDP growth decline or sluggish, recession or growth slowing down concept, businessman pushing slow
Free with trial Oil stock crisis line icon. linear style sign for mobile concept and web design. Oil price decrease outline vector icon. Symbol, logo illustration. Vector graphics. Decrease arrow chart vectors Oil stock crisis line icon
Free with trial Profit fall in economic recession concept, inflation or interest rate falling down, decrease or reduction, stock market value loss, businessman holding money coin on percentage sign with falling down. Decrease arrow chart vectors Profit fall in economic recession concept
Free with trial Declining graph vector icon. Business decline chart filled flat sign for mobile concept and web design. Negative graph statistics glyph icon. Symbol, logo illustration. Vector graphics. Decrease arrow chart vectors Declining graph vector icon
Free with trial Modern reduction line icon. Premium pictogram isolated on a white background. Vector illustration. Stroke high quality symbol. Decrease icon in modern line style. Decrease arrow chart vectors Modern reduction line icon.
Free with trial Drop in oil. Graph of decline rate of oil industry. Red down arrow. Oil rig, oil pump and lots of money. Oil prices are falling on business market. Oil quotations decrease. Decrease arrow chart vectors Drop in oil. Graph of decline rate of oil industry. Red down ar
Free with trial Unhappy businessman hold arrow facing down distressed with business crisis or failure. Upset stressed man CEO frustrated with economic recession. Bankruptcy concept. Flat vector illustration. Decrease arrow chart vectors Unhappy businessman stressed with business crisis. Unhappy businessman hold arrow facing down distressed with business crisis or failure. Upset stressed man CEO frustrated with economic recession. Bankruptcy concept. Flat vector illustration.
Free with trial Stressed bancrupt standing on the background of decreasing chart. Bancrupt business woman with spread arms. Business bankruptcy concept. Vector flat design illustration isolated on white background. Decrease arrow chart vectors Bancrupt business woman vector illustration. Stressed bancrupt standing on the background of decreasing chart. Bancrupt business woman with spread arms. Business bankruptcy concept. Vector flat design illustration isolated on white background.
Free with trial Muslim bancrupt standing on the background of decreasing chart. Young bancrupt businessman with spread arms. Business bankruptcy concept. Vector flat design illustration isolated on white background. Decrease arrow chart vectors Bancrupt muslim businessman with spread arms. Muslim bancrupt standing on the background of decreasing chart. Young bancrupt businessman with spread arms. Business bankruptcy concept. Vector flat design illustration isolated on white background
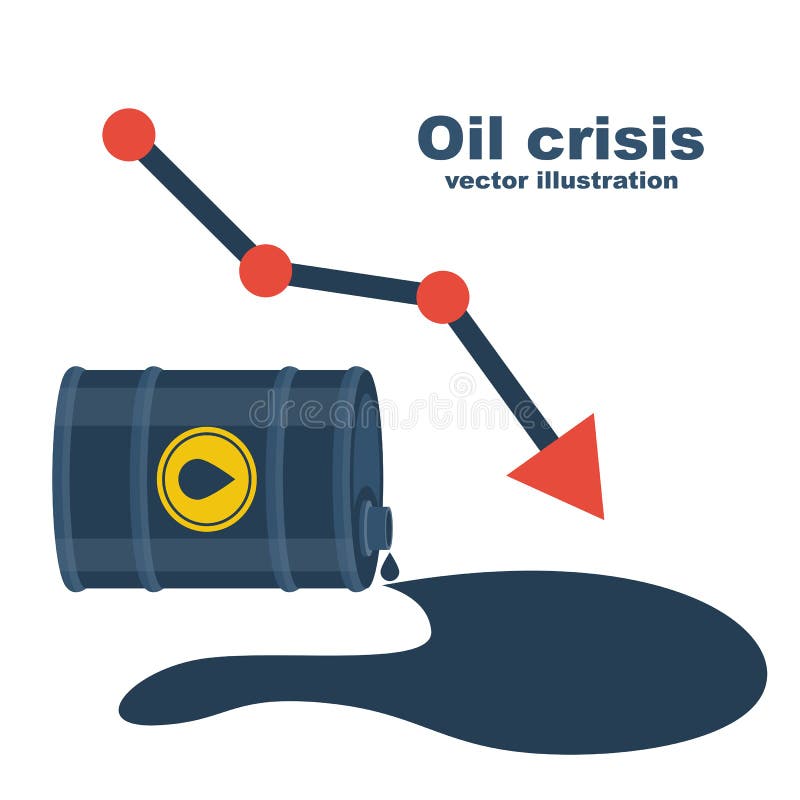
Free with trial World oil crisis. Barrel of gasoline and spilled oil as a symbol of falling value. Price falling concept. Financial chart down. Declining prices. Vector illustration flat design. Landing web page. Decrease arrow chart vectors World oil crisis. Barrel of gasoline and spilled oil as a symbol of falling value
Free with trial Chart down vector line icon isolated on white background. Chart down line icon for infographic, website or app. Scalable icon designed on a grid system. Decrease arrow chart vectors Chart down line icon. Chart down vector line icon isolated on white background. Chart down line icon for infographic, website or app. Scalable icon designed on a grid system.
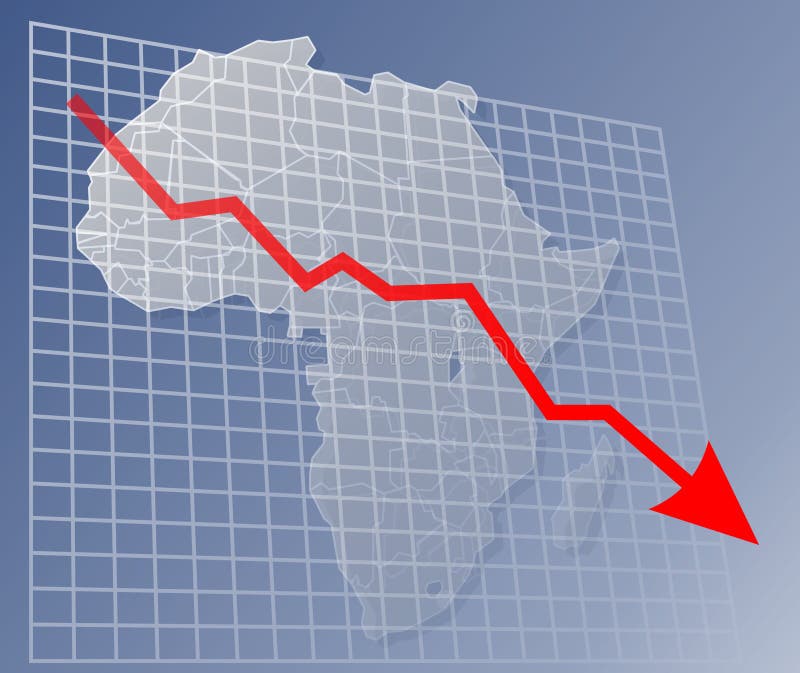
Free with trial Chart with downwards arrow over a map of Africa. Decrease arrow chart illustrations Chart Africa down. Chart with downwards arrow over a map of Africa
Free with trial Stagflation, economic slow down or recession while inflation high up, GDP growth decrease causing by unemployment concept, fearful businessman riding fall down economic graph with inflation high up. Decrease arrow chart vectors Stagflation, economic slow down or recession while inflation high up, GDP growth decrease causing by unemployment concept, fearful
Free with trial Modern reduction line icon. Premium pictogram isolated on a white background. Vector illustration. Stroke high quality symbol. Decrease icon in modern line style. Decrease arrow chart vectors Modern reduction line icon.