Free with trial CO2 inside cloud shape with blue downward arrows indicating reduction, next to bar chart and small cloud. Ideal for sustainability, environment, data, carbon reduction, climate change, eco-friendly. Decrease arrow icon vectors Reducing Carbon Emissions with Data Analysis Highlighted by Cloud Imagery and Downward Arrows. CO2 inside cloud shape with blue downward arrows indicating reduction, next to bar chart and small cloud. Ideal for sustainability, environment, data, carbon reduction, climate change, eco-friendly
Free with trial Two entrepreneurs created a business strategy to reduce project operational costs using laptops. Cost Reduction concept. trend modern vector flat illustration. Decrease arrow icon vectors Two entrepreneurs created a business strategy to reduce project operational costs using laptops. Cost Reduction concept.
Free with trial Percent decrease arrow vector icon. GDP market business profit percent arrow down graph. Decrease arrow icon vectors Percent decrease arrow vector icon. GDP market business percent arrow down. Percent decrease arrow vector icon. GDP market business profit percent arrow down graph
Free with trial A collection of six red downward pointing arrows, each featuring a percentage symbol, presented on a clean white background. Decrease arrow icon illustrations Six red downward arrows with percentage symbols isolated on white background. A collection of six red downward pointing arrows, each featuring a percentage symbol, presented on a clean white background
Free with trial A minimalist graphic features three black chevron arrows stacked vertically, all pointing downwards. The chevrons are outlined with a thin white border, creating a subtle contrast against the pure white background. This design conveys a sense of direction, decline, or a downward sequence. Decrease arrow icon illustrations Three Black Chevron Arrows Pointing Downward on a White Background direction. A minimalist graphic features three black chevron arrows stacked vertically, all pointing downwards. The chevrons are outlined with a thin white border, creating a subtle contrast against the pure white background. This design conveys a sense of direction, decline, or a downward sequence
Free with trial Loan line icons. Social media: share, comment, like icons. Set of Interest rate, Investment and Percentage diagram linear icons. Car leasing, analytics plan, Credit card percent and loan rate. Vector. Decrease arrow icon vectors Loan line icons. Set of Investment, Interest rate and Percentage diagram icons. Social media icons. Vector. Loan line icons. Social media: share, comment, like icons. Set of Interest rate, Investment and Percentage diagram linear icons. Car leasing, analytics plan, Credit card percent and loan rate. Vector
Free with trial The up and down nature of interest rates is the subject of this 3-d illustration with percentage rate symbols indicating either up or down movement. Decrease arrow icon illustrations The up and down nature of interest rates is the subject of this 3-d illustration with percentage rate symbols
Free with trial Tools to maximize and minimize, resize and expand, control size and direction thin black outline symbols vector illustration. Arrows for presentation of growth and scaling line icons set. Decrease arrow icon vectors Arrows for presentation of growth and scaling line icons set, tools to control size. Tools to maximize and minimize, resize and expand, control size and direction thin black outline symbols vector illustration. Arrows for presentation of growth and scaling line icons set.
Free with trial Hand drawn arrows. Set of hand drawn arrows. Vector illustration. Decrease arrow icon vectors Hand drawn arrows. Set of hand drawn arrows. Vector illustration.
Free with trial Hand drawn arrows. Set of hand drawn arrows. Vector illustration. Vector illustration isolated on white background. Decrease arrow icon vectors Hand drawn arrows. Set of hand drawn arrows. Vector illustration.
Free with trial Cost reduction with tiny people concept. Cost reduction management. Businessman cutting cost. set flat vector modern illustration. Decrease arrow icon vectors Cost reduction with tiny people concept. Cost reduction management. Businessman cutting cost.
Free with trial Cost reduction with tiny people concept. Cost reduction management. Businessman cutting cost. set flat vector modern illustration. Decrease arrow icon vectors Cost reduction with tiny people concept. Cost reduction management. Businessman cutting cost.
Free with trial Bar graph with downward trend, arrows indicating loss, and coins falling. Ideal for finance, economics, business, investment, budgeting revenue loss and decline concepts. Simple flat metaphor. Decrease arrow icon illustrations Revenue Decline Illustration with Bar Graph, Arrows, and Falling Coins Symbolizing Financial Loss. Bar graph with downward trend, arrows indicating loss, and coins falling. Ideal for finance, economics, business, investment, budgeting revenue loss and decline concepts. Simple flat metaphor
Free with trial Set of Chart presentation, Report, Increase growth graph icons. Design shape elements. Graph line icons. Analytics testing, Falling demand, Pie chart report. Calendar statistics, Stats. Vector. Decrease arrow icon vectors Graph line icons. Set of Chart presentation, Report and Increase growth graph icons. Design elements. Vector. Set of Chart presentation, Report, Increase growth graph icons. Design shape elements. Graph line icons. Analytics testing, Falling demand, Pie chart report. Calendar statistics, Stats. Vector
Free with trial Bankruptcy concept in flat design business. design vector illustration. Decrease arrow icon vectors Bankruptcy concept in flat design business
Free with trial Set of Investment, Interest rate and Percentage diagram linear icons. Design shape elements. Loan line icons. Car leasing, analytics plan, Credit card percent and loan rate. Vector. Decrease arrow icon vectors Loan line icons. Set of Investment, Interest rate and Percentage diagram icons. Design elements. Vector. Set of Investment, Interest rate and Percentage diagram linear icons. Design shape elements. Loan line icons. Car leasing, analytics plan, Credit card percent and loan rate. Vector
Free with trial This 3D rendering showcases colorful bar graphs, pie charts, and a calculator, vividly illustrating concepts of business growth, financial success, and data analysis. The upward-trending arrow emphasizes positive progress. Decrease arrow icon illustrations Colorful 3D Charts and Calculator Illustrating Business Growth and Financial Success. This 3D rendering showcases colorful bar graphs, pie charts, and a calculator, vividly illustrating concepts of business growth, financial success, and data analysis. The upward-trending arrow emphasizes positive progress.
Free with trial Backup logo design with editable slogan. Business card and branding book template. Decrease arrow icon vectors Backup logo design with editable slogan. Branding book and business card template. Backup logo design with editable slogan. Business card and branding book template.
Free with trial Bankruptcy concept in flat design business. design vector illustration. Decrease arrow icon vectors Business and finance concept bankruptcy flat vector design. bankruptcy concept in flat design business.design vector illustration
Free with trial Report, 3D Chart, Block diagram and Dot Plot graph linear icons. Design shape elements. Charts and Diagrams line icons. Trend, Pyramid and Pie chart report symbols. Vector. Decrease arrow icon vectors Charts and Diagrams line icons. Set of 3D Chart, Block diagram and Dot Plot graph icons. Design elements. Vector. Report, 3D Chart, Block diagram and Dot Plot graph linear icons. Design shape elements. Charts and Diagrams line icons. Trend, Pyramid and Pie chart report symbols. Vector
Free with trial Two glossy, bright yellow arrows are positioned vertically on a light gray background. One arrow points upwards, and the other points downwards, symbolizing direction, change, or contrast. The 3D render is clean and minimalist. Decrease arrow icon illustrations Two Glossy Yellow Arrows Pointing Up and Down on a Light Gray Background image photo. Two glossy, bright yellow arrows are positioned vertically on a light gray background. One arrow points upwards, and the other points downwards, symbolizing direction, change, or contrast. The 3D render is clean and minimalist
Free with trial Bankruptcy concept in flat design business. design vector illustration. Decrease arrow icon vectors Business bankruptcy concept in flat vector design. bankruptcy concept in flat design business.design vector illustration
Free with trial Financial business concept going bankrupt flat vector design. design vector illustration. Decrease arrow icon vectors Financial concept going bankrupt flat vector design illustration. financial business concept going bankrupt flat vector design.design vector illustration
Free with trial "Reduce" encourages minimizing consumption to decrease the amount of waste created. "Reuse" promotes finding new purposes for items instead of discarding them. "Recycle" involves processing used materials into new products, conserving resources and energy. By prioritizing these actions, we can significantly lessen our environmental impact, conserve natural resources, and promote a more sustainable future. Decrease arrow icon illustrations \'Reduce, Reuse, Recycle\' is a fundamental mantra for waste management and environmental sustainability. "Reduce" encourages minimizing consumption to decrease the amount of waste created. "Reuse" promotes finding new purposes for items instead of discarding them. "Recycle" involves processing used materials into new products, conserving resources and energy. By prioritizing these actions, we can significantly lessen our environmental impact, conserve natural resources, and promote a more sustainable future.
Free with trial Financial business concept going bankrupt flat vector design. design vector illustration. Decrease arrow icon vectors Financial concept going bankrupt flat vector design illustration. financial business concept going bankrupt flat vector design.design vector illustration
Free with trial Set line Worker, Credit card, Global economic crisis and. Business infographic template. Vector. Decrease arrow icon vectors Set line Worker, Credit card, Global economic crisis and . Business infographic template. Vector
Free with trial Electric power, Charge station and Electricity price inflation set. Design shape elements. Energy line icons. Eco energy, efficiency consumption and saving electricity line icons. Vector. Decrease arrow icon illustrations Energy line icons. Electric power, Charge station and Electricity price inflation set. Design elements. Vector. Electric power, Charge station and Electricity price inflation set. Design shape elements. Energy line icons. Eco energy, efficiency consumption and saving electricity line icons. Vector
Free with trial Discount tag displays a percentage symbol with arrows pointing up and down indicating fluctuating prices representing sales promotions and marketing offers for retail businesses. Decrease arrow icon illustrations Blue discount tag with percentage sign and arrows indicating price changes on white background. Discount tag displays a percentage symbol with arrows pointing up and down indicating fluctuating prices representing sales promotions and marketing offers for retail businesses
Free with trial Young women calculate rising monthly expenses and decreasing income. Financial Instability concept. trend modern vector flat illustration. Decrease arrow icon vectors Young women calculate rising monthly expenses and decreasing income. Financial Instability concept.
Free with trial Export-import entrepreneurs check the demand for goods to be sent. Demand for goods decreases. Cost Reduction concept. trend modern vector flat illustration. Decrease arrow icon vectors Export-import entrepreneurs check the demand for goods to be sent. Demand for goods decreases. Cost Reduction concept.
Free with trial Businessman hand turn cost dial to low position. Cost reduction management concept. flat vector modern illustration. Decrease arrow icon vectors Businessman hand turn cost dial to low position. Cost reduction management concept.
Free with trial Lower price. Text effect design with modern colors and 3D font look. Decrease arrow icon illustrations Lower price. Text effect with modern colors and 3D font look
Free with trial 3D Hand is holding Diagram and dollar illustration. Dollar value rising. Exchange rate or financial report, economy or investment concept. Trendy and modern vector in 3d style. Decrease arrow icon vectors 3D Hand is holding Diagram and dollar illustration. Dollar value rising. Exchange rate or financial report, economy
Free with trial Set line Global economic crisis, and Calculation of expenses on seamless pattern. Vector. Decrease arrow icon illustrations Set line Global economic crisis, and Calculation of expenses on seamless pattern. Vector
Free with trial Falling chart with coins, symbolizing financial loss, crisis, or declining income. Modern vector illustration isolated on white background, hand drawn, flat design. Decrease arrow icon vectors Falling chart with coins, symbolizing financial loss, crisis, or declining income. Modern vector illustration isolated
Free with trial Financial crisis, savings loss and market downturn set. Trendy modern vector illustration isolated on white background, hand drawn, flat design. Decrease arrow icon vectors Financial crisis, savings loss and market downturn set. Trendy modern vector illustration isolated on white background
Free with trial Fall of the economy, reduction of capital. Bankruptcy and stock decline. Recession sign on economic background. Economic Recession concept. set modern vector flat illustration. Decrease arrow icon vectors Fall of the economy, reduction of capital. Bankruptcy and stock decline. Recession sign on economic background. Economic Recession
Free with trial Rescission chart in modern design style, concept of business loss. Decrease arrow icon vectors Rescission chart in modern design style, concept of business loss
Free with trial Rescission chart in modern design style, concept of business loss. Decrease arrow icon vectors Rescission chart in modern design style, concept of business loss
Free with trial A grid of 28 simple black line art icons on a white background depicting various financial charts graphs and business related symbols including bar charts pie charts computers and money. Decrease arrow icon vectors Collection of 28 minimalist line art icons representing financial data charts and business concepts graph. A grid of 28 simple black line art icons on a white background depicting various financial charts graphs and business related symbols including bar charts pie charts computers and money
Free with trial Young businessman analyzing a descending financial candlestick chart on a computer screen. Financial Instability concept. trend modern vector flat illustration. Decrease arrow icon vectors Young businessman analyzing a descending financial candlestick chart on a computer screen. Financial Instability concept.
Free with trial Men and women who are stressed and have a headache with big bills. Business crises and bankruptcies, unpaid loan debts. Trend Modern vector flat illustration. Decrease arrow icon vectors Men and women who are stressed and have a headache with big bills. Business crises and bankruptcies, unpaid loan debts.
Free with trial Cost reduction concept shows hands typing on a laptop keyboard with a glowing green icon representing financial savings budget management and efficiency optimization for business strategy planning an. Decrease arrow icon illustrations Cost reduction savings finance economy budget management efficiency optimization strategy planning analysis. Cost reduction concept shows hands typing on a laptop keyboard with a glowing green icon representing financial savings budget management and efficiency optimization for business strategy planning an
Free with trial Set line Server with shield, Mobile and password, Cost reduction and Sales funnel gear on seamless pattern. Vector. Decrease arrow icon illustrations Set line Server with shield, Mobile and password, Cost reduction and Sales funnel gear on seamless pattern. Vector
Free with trial Hand drawn bar graph showing a downward trend with a sale tag for discounts price reductions and market decline. Decrease arrow icon vectors Hand drawn bar graph showing a downward trend with a sale tag for discounts price reductions and market decline
Free with trial A green flag waving above pink descending bar chart symbolizing decline or loss in data visualization. Generative AI. Decrease arrow icon illustrations Green flag waving above pink descending bar chart symbolizing decline or loss in data visualization. A green flag waving above pink descending bar chart. A green flag waving above pink descending bar chart symbolizing decline or loss in data visualization. Generative AI
Free with trial Eight circular icons with black backgrounds each feature a different chart or graph symbol. The frames are bordered by a sequence of colorful lines: red, green, blue, and yellow. The icons include bar graphs, line graphs, a pie chart, and scatter plots, all depicted in white. Each symbol includes axes and grid patterns, indicating statistical or financial data representation. The arrangement is in two rows of four, emphasizing symmetry and variety in chart types. A i Generated. Decrease arrow icon vectors Collection of eight different chart and graph icons displayed in circular black frames with colorful borders. Eight circular icons with black backgrounds each feature a different chart or graph symbol. The frames are bordered by a sequence of colorful lines: red, green, blue, and yellow. The icons include bar graphs, line graphs, a pie chart, and scatter plots, all depicted in white. Each symbol includes axes and grid patterns, indicating statistical or financial data representation. The arrangement is in two rows of four, emphasizing symmetry and variety in chart types. A i Generated
Free with trial Businessman holding dollar coin. A businesswoman sits on coins while holding a laptop, calculating declining office finances. Cost Reduction concept. trend modern vector flat illustration. Decrease arrow icon vectors Businessman holding dollar coin. A businesswoman sits on coins while holding a laptop, calculating declining office finances.
Free with trial Businessman analyzes office management. The performance concept improves quality, speed, and efficiency and reduces costs. Cost Reduction concept. trend modern vector flat illustration. Decrease arrow icon vectors Businessman analyzes office management. The performance concept improves quality, speed, and efficiency and reduces costs.
Free with trial Set line Server with shield, Password protection, Cost reduction and Coal mine trolley. Business infographic template. Vector. Decrease arrow icon illustrations Set line Server with shield, Password protection, Cost reduction and Coal mine trolley. Business infographic template
Free with trial Black and white descending graph diagram. loss or decline. flat design style. Suitable for use in reports, illustrations, presentations, etc. vector design template. Decrease arrow icon vectors Black and white descending graph diagram. loss or decline. flat design style. Suitable for use in reports, illustrations
Free with trial Set Hanging sign with Sale, Global economic crisis news and Drop crude oil price. Business infographic template. Vector. Decrease arrow icon vectors Set Hanging sign with Sale, Global economic crisis news and Drop crude oil price. Business infographic template. Vector
Free with trial Data funnel filtering process showing percentage drop in prices or conversion rate on isolated black and white design. Decrease arrow icon vectors Data funnel filtering process showing percentage drop in prices or conversion rate on isolated black and white design
Free with trial Illustration of a graphic diagram going down and being reflected by a shield. . loss or decline. flat design style. Suitable for use in reports, illustrations, presentations, etc. vector design template. Decrease arrow icon vectors Illustration of a graphic diagram going down and being reflected by a shield. . loss or decline. flat design style. Suitable for
Free with trial Graphic diagram illustration taken down and cut using scissors. loss or decline. flat design style. Suitable for use in reports, illustrations, presentations, etc. vector design template. Decrease arrow icon vectors Graphic diagram illustration taken down and cut using scissors. loss or decline. flat design style. Suitable for use in reports
Free with trial Decline prices in 2024. Falling chart. Graph drop. Reduction money. Lower finance. Vector illustration flat design. Isolated on white background. Decrease arrow icon vectors Decline prices in 2024. Falling chart. Graph drop. Reduction money.
Free with trial Botswana oil industry concept, industrial illustration - lowering down chart on Botswana flag background. 3D Illustration. Decrease arrow icon illustrations Lowering down chart on Botswana flag background - industrial illustration of Botswana oil industry or market concept. 3D. Botswana oil industry concept, industrial illustration - lowering down chart on Botswana flag background. 3D Illustration
Free with trial Cost price low decrease and grow increase icon. Vector symbol of arrow and euro for financial rate. Decrease arrow icon vectors Cost price decrease grow vector Euro arrow icon. Cost price low decrease and grow increase icon. Vector symbol of arrow and euro for financial rate
Free with trial Cost price low decrease and grow increase icon. Vector symbol of arrow and dollar for financial rate. Decrease arrow icon vectors Cost price decrease grow vector arrow dollar icon. Cost price low decrease and grow increase icon. Vector symbol of arrow and dollar for financial rate
Free with trial GDP decrease fall, red arrow and percent icon. Vector GDP, investment profit loss arrow down symbol. Decrease arrow icon vectors GDP decrease fall, red arrow percent icon. Vector GDP, investment profit loss arrow down symbol
Free with trial Increase, decrease Arrow symbol set, icon business concept. Vector illustration on white background. Decrease arrow icon vectors Increase, decrease Arrow symbol set, icon business concept. Vector illustration on white background.
Free with trial Down graph chart arrow drop icon. Decrease downward vector market decrease down trend. Decrease arrow icon vectors Down graph chart arrow drop icon. Decrease downward vector market decrease down trend.
Free with trial Cost reduction icon dollar. Price decrease arrow symbol. business sale sign illustration. Decrease arrow icon vectors Cost reduction icon dollar. Price decrease arrow symbol. business sale sign illustration
Free with trial Cost reduction icon dollar. Price decrease arrow symbol. business sale sign illustration. Decrease arrow icon vectors Cost reduction icon dollar. Price decrease arrow symbol. business sale sign illustration
Free with trial Cost reduction icon dollar. Price decrease arrow symbol. business sale sign illustration. Decrease arrow icon vectors Cost reduction icon dollar. Price decrease arrow symbol. business sale sign illustration
Free with trial Dollar rate decrease vector line icon. Money symbol with down arrow. Lower cost icon. Business lost crisis decrease vector illustration. Editable stroke. dollar down icon symbol vector. EPS10. Decrease arrow icon illustrations Dollar rate decrease vector line icon. Money symbol with down arrow. Lower cost icon. Business lost crisis decrease vector
Free with trial Dollar decrease. Vector isolated icon. Dollar crisis down arrow. Dollar vector rate decrease icon. Money fall down symbol. EPS 10. Decrease arrow icon vectors Dollar decrease. Vector isolated icon. Dollar crisis down arrow. Dollar vector rate decrease icon. Money fall down symbol
Free with trial Rissing and falling arrow icon. Business concept. Increase and decrease sign. Vector isolated on white. Decrease arrow icon vectors Rissing and falling arrow icon. Business concept. Increase and decrease sign.
Free with trial Dollar arrow down rate decrease price value finance icon set sign rising business. Vector. Decrease arrow icon vectors Dollar arrow down rate decrease price value finance icon set sign rising business.
Free with trial Dollar arrow decrease icon. Sign arrow down. Vector on isolated white background. EPS 10. Decrease arrow icon vectors Dollar arrow decrease icon. Sign arrow down. Vector on isolated white background. EPS 10
Free with trial Sale, discounts, price decrease icon. Tablet pc with arrow and euro sign. Flat design vector illustration. Decrease arrow icon vectors Sale, discounts, price decrease icon. Tablet pc with arrow and euro sign. Flat design vector illustration
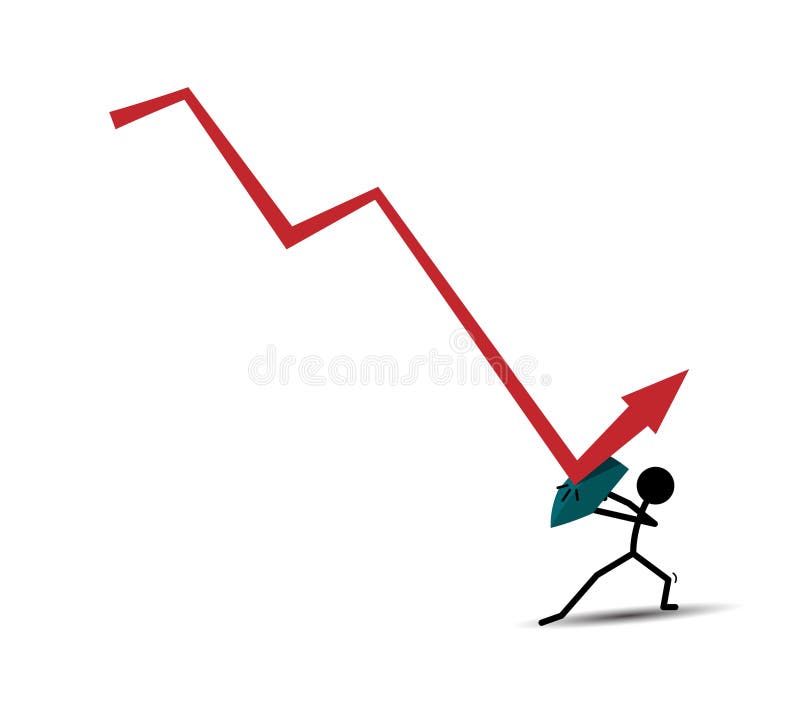
Free with trial Man and decrease arrow flat icon, vector sign, Business crisis colorful pictogram isolated on white. Symbol, logo illustration. Flat style design. Decrease arrow icon vectors Man and decrease arrow flat icon
Free with trial Dollar arrow down rate decrease price payment value finance rising business illustration icon sign. Decrease arrow icon vectors Dollar arrow down rate decrease price payment value finance rising business illustration icon
Free with trial Red arrow down icon. decrease, fall, crash concept. download sign. isolated on white. Vector flat button. Decrease arrow icon illustrations Red arrow down icon. decrease, fall, crash concept. download sign
Free with trial Red arrow down icon. decrease, fall, crash concept. download sign. isolated on white. Vector flat button. Decrease arrow icon illustrations Red arrow down icon. decrease, fall, crash concept. download sign
Free with trial Bars chart with decrease arrow line style icon design, Data analysis and information theme Vector illustration. Decrease arrow icon vectors Bars chart with decrease arrow line style icon vector design. Bars chart with decrease arrow line style icon design, Data analysis and information theme Vector illustration
Free with trial Arrow decrease icon symbol. economy stretching rising drop fall down. Business lost crisis decrease. lower cost, reduction bankrupt icon. vector illustration. Decrease arrow icon vectors Arrow decrease icon symbol. economy stretching rising drop fall down. Business lost crisis decrease. lower cost, reduction
Free with trial Percentage arrow up and down icon. Percent flat icon. Price increase, decrease. Business simple symbol. Vector illustration isolated on white background. Decrease arrow icon vectors Percentage arrow up and down icon. Percent flat icon. Price increase, decrease. Business simple symbol. Vector
Free with trial Man and decrease arrow vector icon. filled flat sign for mobile concept and web design. Businessman and falling down arrow glyph icon. Business crisis symbol, logo illustration. Vector graphics. Decrease arrow icon vectors Man and decrease arrow vector icon
Free with trial Arrow decrease icon symbol. economy stretching rising drop fall down. Business lost crisis decrease. lower cost, reduction bankrupt icon. vector illustration. Decrease arrow icon vectors Arrow decrease icon symbol. economy stretching rising drop fall down. Business lost crisis decrease. lower cost, reduction