Free with trial Dollar price up and down outline icon. USD coin growth and decline sign symbol vector. Decrease arrows vectors Dollar price up and down outline icon. USD coin growth and decline sign symbol
Free with trial Hand Drawn Down Arrow Illustration. Pointing Sign Sketch, Outline Graphic Symbol. Decrease arrows vectors Hand Drawn Down Arrow Illustration. Pointing Sign Sketch, Outline Graphic Symbol
Free with trial Hand Drawn Illustration Showing Bar Graph and Downward Arrow for Losses or Declines. Decrease arrows vectors Hand Drawn Illustration Showing Bar Graph and Downward Arrow for Losses or Declines
Free with trial A bright purple upward-pointing arrow stands next to a soft pink downward-pointing arrow against a neutral gray background. The arrows are rendered in a smooth, 3D style, representing concepts of choice, direction, comparison, or opposing forces. Decrease arrows illustrations Purple Up Arrow and Pink Down Arrow on Gray Background image photo. A bright purple upward-pointing arrow stands next to a soft pink downward-pointing arrow against a neutral gray background. The arrows are rendered in a smooth, 3D style, representing concepts of choice, direction, comparison, or opposing forces
Free with trial Red arrow pointing right labeled "UP" and a green arrow pointing left labeled "DOWN" on a light background. The arrows symbolize directional movement, conveying concepts of increase and decrease. The use of contrasting colors highlights the difference in direction or choice. The simplicity of the design aids in quick understanding and recognition. Decrease arrows illustrations Up and down arrow concepts for methods or systems of raising or lowering Fed interest rates. Red arrow pointing right labeled "UP" and a green arrow pointing left labeled "DOWN" on a light background. The arrows symbolize directional movement, conveying concepts of increase and decrease. The use of contrasting colors highlights the difference in direction or choice. The simplicity of the design aids in quick understanding and recognition.
Free with trial This dynamic 3D render visualizes financial growth and market trends. A series of green bars represents increasing values, overlaid by a prominent green arrow pointing upwards, symbolizing success and positive performance. Contrasting this, a red arrow also indicates a trend, though its path suggests volatility or a different metric. Below, a complex network graph with interconnected nodes and lines adds a layer of data analysis and interconnectedness, suitable for concepts like investment, analytics, and economic forecasting. Decrease arrows illustrations Upward Trend: Green and Red Arrows Over Bar Chart and Network Graph. This dynamic 3D render visualizes financial growth and market trends. A series of green bars represents increasing values, overlaid by a prominent green arrow pointing upwards, symbolizing success and positive performance. Contrasting this, a red arrow also indicates a trend, though its path suggests volatility or a different metric. Below, a complex network graph with interconnected nodes and lines adds a layer of data analysis and interconnectedness, suitable for concepts like investment, analytics, and economic forecasting.
Free with trial This image shows colorful financial charts and graphs, generated by AI, illustrating various data points and percentages. The overlaid arrows suggest a downward trend, potentially indicating a negative market shift or economic decline. The visual representation aids in quick understanding of compl. Decrease arrows illustrations Financial Data Analysis. This image shows colorful financial charts and graphs, generated by AI, illustrating various data points and percentages. The overlaid arrows suggest a downward trend, potentially indicating a negative market shift or economic decline. The visual representation aids in quick understanding of compl
Free with trial Beverage Cup with Green Drop and Orange Arrow Pointing Downward. Decrease arrows vectors Beverage Cup with Green Drop and Orange Arrow Pointing Downward
Free with trial This icon represents the concept of compressing, condensing, or applying downward pressure. Decrease arrows illustrations Three arrows pointing down to three horizontal lines showing compressing concept. This icon represents the concept of compressing, condensing, or applying downward pressure
Free with trial Cartoon Red Sweater with Down Arrow Symbol Isolated Illustration. Decrease arrows vectors Cartoon Red Sweater with Down Arrow Symbol Isolated Illustration
Free with trial A professional businessman showcases the concept of increasing quality while decreasing costs, using a hologram display with upward and downward arrows, while working on a laptop in an office setting. Decrease arrows illustrations Businessman presents rising quality and decreasing cost concept. A professional businessman showcases the concept of increasing quality while decreasing costs, using a hologram display with upward and downward arrows, while working on a laptop in an office setting
Free with trial Up and down direction arrow icon illustration in circle line. Decrease arrows vectors Up and down direction arrow icon in circle line. Up and down direction arrow icon illustration in circle line
Free with trial Up and down direction arrow icon on circle line. Download and upload concept. Decrease arrows vectors Up and down direction arrow icon on circle line
Free with trial Dollar price up and down icon on black circle. USD growth and decline sign symbol vector. Decrease arrows vectors Dollar price up and down icon on black circle. USD growth and decline sign symbol
Free with trial Growth and decline percent arrow icon. Percentage up and down sign. Discount symbol vector. Decrease arrows vectors Growth and decline percent arrow icon. Percentage up and down sign. Discount symbol
Free with trial Digita blue bar charts descend steadily across a digital grid, illustrating a decline in financial performance and market trends. Downward arrows emphasize loss, negative growth, and economic challenges, while smooth transitions and a tech-inspired layout enhance the visual impact of the data downturn. Decrease arrows illustrations Digital blue bar chart with decreasing business concept. Digita blue bar charts descend steadily across a digital grid, illustrating a decline in financial performance and market trends. Downward arrows emphasize loss, negative growth, and economic challenges, while smooth transitions and a tech-inspired layout enhance the visual impact of the data downturn.
Free with trial This image shows a graph depicting a sharp market downturn, generated by AI. The downward trend is emphasized by large black arrows, illustrating a significant and rapid decline. The rolled-up paper suggests the ongoing nature of the crisis, implying further potential losses. Decrease arrows illustrations Market Crash Visualization. This image shows a graph depicting a sharp market downturn, generated by AI. The downward trend is emphasized by large black arrows, illustrating a significant and rapid decline. The rolled-up paper suggests the ongoing nature of the crisis, implying further potential losses.
Free with trial Hand drawn arrow design, pointing down, business and graphic concept. Decrease arrows vectors Hand drawn arrow design, pointing down, business and graphic concept
Free with trial Research axes icon, multifaceted scalability, comprehensive minimize, flat symbol on white background - vector illustration. Decrease arrows vectors Research axes icon, multifaceted scalability, comprehensive minimize, flat symbol
Free with trial A conceptual infographic visually representing the economic trend of rising prices contrasted with falling income, depicted by upward and downward arrows. Decrease arrows illustrations Infographic showing rising prices and falling income. A conceptual infographic visually representing the economic trend of rising prices contrasted with falling income, depicted by upward and downward arrows.
Free with trial Percent growth and decline arrow icon vector on black circle. Decrease arrows vectors Percent growth and decline arrow icon on black circle
Free with trial Up and down direction arrow icon set on black circle. Upward and downward illustration concept. Decrease arrows vectors Up and down direction arrow icon set on black circle. Upward and downward concept
Free with trial Scalability flat white icons on round color backgrounds. Decrease arrows vectors Scalability flat round icons. Scalability flat white icons on round color backgrounds
Free with trial CO2 cloud with downward arrows, small graph showing fluctuation and falling coins. Ideal for climate change, sustainability, economy, environment, cost, finance emissions. Simple flat metaphor. Decrease arrows vectors Carbon Emissions Reduction and Economic Impact Illustrated with Graph and Coin Elements. CO2 cloud with downward arrows, small graph showing fluctuation and falling coins. Ideal for climate change, sustainability, economy, environment, cost, finance emissions. Simple flat metaphor
Free with trial Two red, downward trending arrow graphs illustrate a significant market decline, representing financial loss or economic downturn. The jagged lines show fluctuating decline. Decrease arrows vectors Red Downward Trending Arrows Indicating Market Decline, Financial Loss. Two red, downward trending arrow graphs illustrate a significant market decline, representing financial loss or economic downturn. The jagged lines show fluctuating decline
Free with trial Decreasing bar chart diagram with down arrow showing negative growth. Decrease arrows vectors Decreasing bar chart diagram with down arrow showing negative growth
Free with trial This vector illustration shows a circular icon featuring a thermometer with arrows indicating temperature fluctuation. Perfect for apps, websites, or presentations related to climate, weather, or any temperature-sensitive application. Decrease arrows vectors Circular Thermometer Icon: Temperature Control and Monitoring System. This vector illustration shows a circular icon featuring a thermometer with arrows indicating temperature fluctuation. Perfect for apps, websites, or presentations related to climate, weather, or any temperature-sensitive application.
Free with trial Percent growth and decline outline icon in rounded corner. Percentage arrow up and down sign symbol vector. Decrease arrows vectors Percent growth and decline outline icon in rounded corner. Percentage arrow up and down sign symbol
Free with trial Simple bar graph showing downward trend with arrow, decline in progress. Decrease arrows vectors Simple bar graph showing downward trend with arrow, decline in progress
Free with trial Growth and decline percent arrow icon on black circle. Percentage up and down sign. Discount symbol vector. Decrease arrows vectors Growth and decline percent arrow icon on black circle. Percentage up and down sign. Discount symbol
Free with trial Hand drawn 3D up and down arrow sketch icon for direction or navigation. Decrease arrows vectors Hand drawn 3D up and down arrow sketch icon for direction or navigation
Free with trial Resize horizontal outline flat white icons on round color backgrounds. 17 background color variations are included. Decrease arrows vectors Resize horizontal outline flat white icons on round color backgrounds
Free with trial Up and down arrow line icon. Upward and downward sign symbol vector. Decrease arrows vectors Up and down arrow line icon. Upward and downward sign symbol
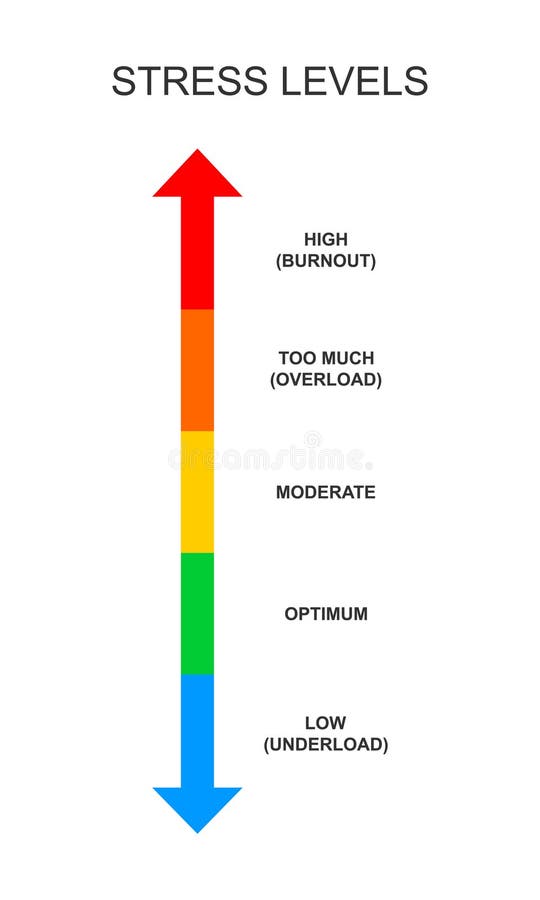
Free with trial Stress meter vertical scale. Mental or emotional pressure levels from underload to burnout. Colorful chart with opposites arrows for overworking, nervous, crisis diagnosis. Vector flat illustration. Decrease arrows vectors Stress meter vertical scale. Mental or emotional pressure levels from underload to burnout. Colorful chart with
Free with trial Sixteen black glyph icons arranged in a grid pattern, including arrows, pause, and paw print icons. Decrease arrows vectors Collection of sixteen different black glyph icons on a white sheet design. sixteen black glyph icons arranged in a grid pattern, including arrows, pause, and paw print icons.
Free with trial Three nested arrowheads pointing right are enclosed within a circle. The arrows decrease in size from right to left, creating a sense of direction and movement. All elements are outlined in black on a white background, offering a crisp, minimalist design. The geometry is precise, with sharp angles and symmetrical alignment, enhancing the overall simplicity and clarity of the image. Decrease arrows illustrations Triple bullet arrow with circle. Three nested arrowheads pointing right are enclosed within a circle. The arrows decrease in size from right to left, creating a sense of direction and movement. All elements are outlined in black on a white background, offering a crisp, minimalist design. The geometry is precise, with sharp angles and symmetrical alignment, enhancing the overall simplicity and clarity of the image.
Free with trial A minimalist graphic featuring two black chevron arrows pointing downwards, stacked one above the other. The arrows are solid black shapes with clean lines and are presented on a plain white background, creating a stark contrast. This symbol is commonly used for navigation or indicating a downward direction. Decrease arrows illustrations Black Double Chevron Down Arrow Symbol on White Background image photo. A minimalist graphic featuring two black chevron arrows pointing downwards, stacked one above the other. The arrows are solid black shapes with clean lines and are presented on a plain white background, creating a stark contrast. This symbol is commonly used for navigation or indicating a downward direction
Free with trial Simple up and down arrow line icon on black circle. Upward and downward sign symbol vector in rounded corner. Decrease arrows vectors Simple up and down arrow line icon on black circle. Upward and downward sign symbol in rounded corner
Free with trial Up and down percent outline icon on circle line. Lower and higher price arrow sign symbol vector. Decrease arrows vectors Up and down percent outline icon on circle line. Lower and higher price arrow sign symbol
Free with trial Up and down arrow icon set on black circle. Upward and downward illustration. Decrease arrows vectors Up and down arrow icon set on black circle
Free with trial A collection of modern, minimalist icons related to business, finance, and data analysis. The icons feature upward and downward trends, graphs, arrows, checkmarks, targets, and warning signs. The color scheme is primarily black and green, creating a clean and professional look. Ideal for presentations, websites, infographics, and marketing materials. Decrease arrows vectors Set of Business and Finance Icons. A collection of modern, minimalist icons related to business, finance, and data analysis. The icons feature upward and downward trends, graphs, arrows, checkmarks, targets, and warning signs. The color scheme is primarily black and green, creating a clean and professional look. Ideal for presentations, websites, infographics, and marketing materials.
Free with trial Hand Drawn Graphic Showing Decline Bar Chart with Arrow Pointing Downward. Decrease arrows vectors Hand Drawn Graphic Showing Decline Bar Chart with Arrow Pointing Downward
Free with trial Green Arrow Pointing Down in a Yellow Coin Illustration for Download Icon. Decrease arrows vectors Green Arrow Pointing Down in a Yellow Coin Illustration for Download Icon
Free with trial Percent growth and decline icon in rounded corner. Percentage arrow up and down sign symbol vector. Decrease arrows vectors Percent growth and decline icon in rounded corner. Percentage arrow up and down sign symbol
Free with trial Dollar arrow growth and decline icon vector. USD up and down sign symbol. Decrease arrows vectors Dollar arrow growth and decline icon. USD up and down sign symbol
Free with trial Dollar up and down arrow icon vector. USD growth and decline sign symbol. Decrease arrows vectors Dollar up and down arrow icon. USD growth and decline sign symbol
Free with trial Down arrow with percentage symbol showing price reduction or discount offer. Decrease arrows vectors Down arrow with percentage symbol showing price reduction or discount offer
Free with trial Declining Bar Graph with Red Arrow Down and Sad Emoji, Financial Loss Symbol. Decrease arrows vectors Declining Bar Graph with Red Arrow Down and Sad Emoji, Financial Loss Symbol
Free with trial Business portfolio with three arrows pointing down, representing a decrease in value or career prospects. Decrease arrows vectors Portfolio under pressure falling business icon showing decreasing career opportunities. Business portfolio with three arrows pointing down, representing a decrease in value or career prospects
Free with trial Up and down direction arrow icon on black circle. Upward and downward illustration concept. Decrease arrows vectors Up and down direction arrow icon on black circle. Upward and downward concept
Free with trial A professional businessman showcases the concept of increasing quality while decreasing costs, using a hologram display with upward and downward arrows, while working on a laptop in an office setting. Decrease arrows illustrations Businessman presents rising quality and decreasing cost concept. A professional businessman showcases the concept of increasing quality while decreasing costs, using a hologram display with upward and downward arrows, while working on a laptop in an office setting
Free with trial Up and down percent outline icon vector. Lower and higher arrow sign symbol. Decrease arrows vectors Up and down percent outline icon. Lower and higher arrow sign symbol
Free with trial The up and down nature of interest rates is the subject of this 3-d illustration with percentage rate symbols indicating either up or down movement. Decrease arrows illustrations The up and down nature of interest rates is the subject of this 3-d illustration with percentage rate symbols
Free with trial Illustration of a baby stroller interwoven with statistical graphs representing demographic trends, particularly highlighting declining birth rates and societal focus on family-related economics. Decrease arrows illustrations Baby stroller illustration with declining demographic trends and graphical analytics. Illustration of a baby stroller interwoven with statistical graphs representing demographic trends, particularly highlighting declining birth rates and societal focus on family-related economics
Free with trial Dollar price up and down icon. USD coin growth and decline sign symbol vector. Decrease arrows vectors Dollar price up and down icon. USD coin growth and decline sign symbol
Free with trial Percent arrow up and down icon. Percentage growth and decline sign symbol vector. Decrease arrows vectors Percent arrow up and down icon. Percentage growth and decline sign symbol
Free with trial Up and down arrow icon in rounded corner. Upward and downward sign symbol vector. Decrease arrows vectors Up and down arrow icon in rounded corner. Upward and downward sign symbol
Free with trial A man in a blue suit holds a glowing blue bar graph showing increasing quality and decreasing cost with arrows and text. Decrease arrows illustrations Businessman holding glowing bar graph showing cost reduction and quality increase. A man in a blue suit holds a glowing blue bar graph showing increasing quality and decreasing cost with arrows and text
Free with trial Up and down percent arrow outline icon vector. Lower and higher price sign symbol. Decrease arrows vectors Up and down percent arrow outline icon. Lower and higher price sign symbol
Free with trial Meta tags with sample numbers for stock market. Decrease arrows illustrations Meta tags with sample numbers for stock market
Free with trial Meta tags with sample numbers for stock market. Decrease arrows illustrations Meta tags with sample numbers for stock market
Free with trial Meta tags with sample numbers for stock market. Decrease arrows illustrations Meta tags with sample numbers for stock market
Free with trial Meta tags with sample numbers for stock market. Decrease arrows illustrations Meta tags with sample numbers for stock market
Free with trial A hand draws upward trending arrows on a chalkboard, showing sales, margin, and profitability increasing while costs decrease. Decrease arrows illustrations Chalkboard illustrating rising sales margin and profitability with decreasing costs. A hand draws upward trending arrows on a chalkboard, showing sales, margin, and profitability increasing while costs decrease
Free with trial Up and down arrow direction icon set in generic style. Upward and downward sign symbol illustration. Decrease arrows vectors Up and down arrow direction icon set in generic style. Upward and downward sign symbol
Free with trial A 3D pie chart with three colored segments (pink, blue, and teal) is shown against a solid purple background. A yellow circle with a white upward arrow is positioned to the left of the chart, and a pink circle with a white downward arrow is to the right. Decrease arrows illustrations 3D Pie Chart With Up and Down Arrows Indicating Growth and Decline on a Purple Background. A 3D pie chart with three colored segments (pink, blue, and teal) is shown against a solid purple background. A yellow circle with a white upward arrow is positioned to the left of the chart, and a pink circle with a white downward arrow is to the right
Free with trial Cyborg robot in front of digital stock market chart with red downward arrows on dark background, concept of financial crisis and automation. 3D Rendering. Decrease arrows illustrations Futuristic robot analyzing falling stock market chart on dark background with red indicators and downward trend line representing. Cyborg robot in front of digital stock market chart with red downward arrows on dark background, concept of financial crisis and automation. 3D Rendering
Free with trial Up and down sign arrow icon set. Directional Navigation Symbol. Upward, downward arrows in isolated on white background. Decrease arrows vectors Up and down sign arrow icon set. Directional Navigation Symbol. Upward, downward arrows in isolated on white background
Free with trial Hand drawn arrow pointing down isolated vector illustration doodle sketch line art icon. Decrease arrows vectors Hand drawn arrow pointing down isolated vector illustration doodle sketch line art icon
Free with trial Up and down arrow icon set in generic style. Upward and downward sign symbol illustration. Decrease arrows vectors Up and down arrow icon set in generic style. Upward and downward sign symbol
Free with trial Decreasing bar chart with downward arrow illustrates economic downturn stock market trend. Decrease arrows vectors Decreasing bar chart with downward arrow illustrates economic downturn stock market trend
Free with trial Economic recession symbol with a sharp jagged arrow pointing down indicating a market crash. Decrease arrows vectors Economic recession symbol with a sharp jagged arrow pointing down indicating a market crash
Free with trial Human Interaction and Movement Line Icon Set. Social Dynamics, Communication, Group Behavior Outline Symbol Collection. Growth and Movement Concept. Editable Stroke. Isolated Vector Illustration. Decrease arrows vectors Human Interaction and Movement Line Icon Set. Social Dynamics, Communication, Group Behavior Outline Symbol Collection
Free with trial Up and down dollar arrow icon on circle line. USD growth and decline sign symbol vector. Decrease arrows vectors Up and down dollar arrow icon on circle line. USD growth and decline sign symbol
Free with trial Dollar arrow growth and decline icon on circle line. USD up and down sign symbol vector. Decrease arrows vectors Dollar arrow growth and decline icon on circle line. USD up and down sign symbol
Free with trial Vector icon of a clock with a downward arrow symbolizing time reduction, delay, or history log. Decrease arrows vectors Vector icon of a clock with a downward arrow symbolizing time reduction, delay, or history log
Free with trial Percent arrow growth and decline outline icon vector. Percentage up and down sign symbol. Decrease arrows vectors Percent arrow growth and decline outline icon. Percentage up and down sign symbol
Free with trial Three stacks of golden coins are arranged on a white surface. A prominent red arrow, indicating a downward trend, is positioned diagonally above the coins, pointing towards the right. The arrow's sharp angles and vibrant red color convey a sense of financial decline or loss. The coins are depicted in varying heights, with a single coin resting on top of the middle stack. Decrease arrows illustrations Red downward trending graph arrow over stacks of gold coins on a white background finance. Three stacks of golden coins are arranged on a white surface. A prominent red arrow, indicating a downward trend, is positioned diagonally above the coins, pointing towards the right. The arrow's sharp angles and vibrant red color convey a sense of financial decline or loss. The coins are depicted in varying heights, with a single coin resting on top of the middle stack
Free with trial Up and down arrow dollar icon on black circle. USD growth and decline sign symbol vector. Decrease arrows vectors Up and down arrow dollar icon on black circle. USD growth and decline sign symbol
Free with trial Dollar arrow growth and decline icon on black circle. USD up and down sign symbol vector. Decrease arrows vectors Dollar arrow growth and decline icon on black circle. USD up and down sign symbol