Free with trial The image displays six identical red arrows pointing downward, each containing a white percentage symbol. These arrows are arranged in a two-by-three grid pattern on a neutral, slightly textured background, symbolizing a decrease or decline in percentages, often used in financial or statistical contexts to indicate a reduction or drop. Decrease arrows illustrations Six red downward percentage arrows on a neutral background. The image displays six identical red arrows pointing downward, each containing a white percentage symbol. These arrows are arranged in a two-by-three grid pattern on a neutral, slightly textured background, symbolizing a decrease or decline in percentages, often used in financial or statistical contexts to indicate a reduction or drop
Free with trial Three red, 3D arrows curving downwards, generated by AI, symbolize decline, decrease, or downturn. The image offers a visual representation of negative trends or a downward trajectory, suitable for presentations or reports. Decrease arrows illustrations Red Arrows Pointing Down. Three red, 3D arrows curving downwards, generated by AI, symbolize decline, decrease, or downturn. The image offers a visual representation of negative trends or a downward trajectory, suitable for presentations or reports.
Free with trial Black and white icon of a dollar coin with three arrows pointing down, illustrating a decrease in value. Decrease arrows vectors Dollar coin with three down arrows representing decreasing value. Black and white icon of a dollar coin with three arrows pointing down, illustrating a decrease in value
Free with trial A set of four black and white oil barrels with green downward arrows, symbolizing decline, reduction, or decrease in oil prices or supply. Decrease arrows illustrations Four Oil Barrels with Green Down Arrows Symbolizing Decline. A set of four black and white oil barrels with green downward arrows, symbolizing decline, reduction, or decrease in oil prices or supply
Free with trial Three vibrant red arrows with a distinct zigzag or wavy shape pointing downwards. Arranged vertically, each arrow has a unique zigzag pattern. Isolated on a clean white background. Symbolizes decline, decrease, drop, negative trend, crisis, warning, movement. Decrease arrows illustrations Three red zigzag arrows pointing downwards on white background. Three vibrant red arrows with a distinct zigzag or wavy shape pointing downwards. Arranged vertically, each arrow has a unique zigzag pattern. Isolated on a clean white background. Symbolizes decline, decrease, drop, negative trend, crisis, warning, movement
Free with trial A collection of 50 black and white line that visually represent increase and decrease trends. The include various styles of graphs, charts, and arrows, depicted in a minimalist and clean flat Each uses simple lines and shapes to convey different types of data trends, such as upward and downward movements, comparisons, and statistical representations. The are designed with editable strokes,. Decrease arrows vectors Set of 50 black and white line showing increase and decrease trends. a collection of 50 black and white line that visually represent increase and decrease trends. The include various styles of graphs, charts, and arrows, depicted in a minimalist and clean flat Each uses simple lines and shapes to convey different types of data trends, such as upward and downward movements, comparisons, and statistical representations. The are designed with editable strokes,
Free with trial The image displays a bar chart with eight vertical bars of varying heights. Each bar is colored in teal, and there are red arrows pointing downward on top of each bar, suggesting a decrease in the values they represent. The bars are arranged in a slightly irregular pattern, with the tallest bar positioned in the center of the chart. Decrease arrows illustrations A bar chart with red arrows indicating a downward trend in data values. The image displays a bar chart with eight vertical bars of varying heights. Each bar is colored in teal, and there are red arrows pointing downward on top of each bar, suggesting a decrease in the values they represent. The bars are arranged in a slightly irregular pattern, with the tallest bar positioned in the center of the chart
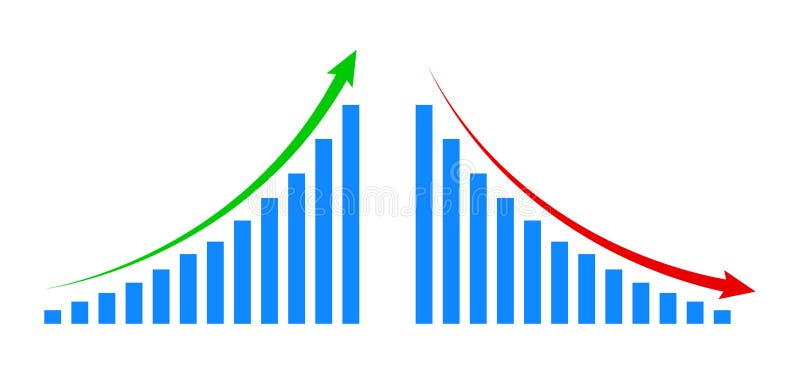
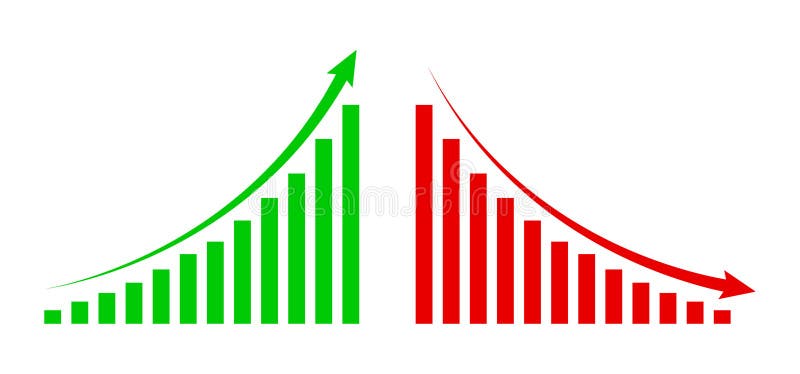
Free with trial The image displays two large, contrasting arrows: a green upward-pointing arrow on the left and a red downward-pointing arrow on the right, commonly used to represent increase and decrease, positive and negative trends, growth and decline, or improvement and deterioration. Decrease arrows illustrations Opposing directional arrows indicating positive and negative trends. The image displays two large, contrasting arrows: a green upward-pointing arrow on the left and a red downward-pointing arrow on the right, commonly used to represent increase and decrease, positive and negative trends, growth and decline, or improvement and deterioration
Free with trial A red graph with arrows illustrating decrease and increase, representing data analysis and performance evaluation in business. Suitable for reports and presentations. Decrease arrows vectors Vector art of red graph with arrow, illustrating decrease and increase, representing data analysis and performance evaluation in. A red graph with arrows illustrating decrease and increase, representing data analysis and performance evaluation in business. Suitable for reports and presentations
Free with trial The image shows two large, bold arrows pointing in opposite directions. The arrow on the left is green and points upward, while the arrow on the right is red and points downward. The arrows are simple and visually distinct, likely representing concepts like increase and decrease, growth and decline, or positive and negative trends. Decrease arrows illustrations Contrasting upward and downward directional arrows in green and red colors. The image shows two large, bold arrows pointing in opposite directions. The arrow on the left is green and points upward, while the arrow on the right is red and points downward. The arrows are simple and visually distinct, likely representing concepts like increase and decrease, growth and decline, or positive and negative trends
Free with trial The image shows two arrows, one green pointing upward labeled increase and another red pointing downward labeled decrease, commonly used to indicate trends or changes in data. Decrease arrows illustrations Visual representation of increase and decrease indicators using arrows. The image shows two arrows, one green pointing upward labeled increase and another red pointing downward labeled decrease, commonly used to indicate trends or changes in data
Free with trial A glass jar with bills and coins, against a background of graphs with green arrows pointing downward. Concept decline in interest rates and potential decrease in income. Decrease arrows illustrations A glass jar with bills and coins, against a background of graphs with green arrows pointing downward. Concept decline in interest
Free with trial A graphic illustration featuring three identical green arrows, each prominently displaying a white percentage symbol. The arrows are positioned side-by-side and are all directed downwards, visually representing a decline, reduction, or decrease in a quantifiable metric such as price, value, or performance. The background is a neutral, light gray, ensuring the focus remains on the symbolic arrows. Decrease arrows illustrations Three green arrows with percentage signs pointing downwards symbolizing a decrease in value or price. A graphic illustration featuring three identical green arrows, each prominently displaying a white percentage symbol. The arrows are positioned side-by-side and are all directed downwards, visually representing a decline, reduction, or decrease in a quantifiable metric such as price, value, or performance. The background is a neutral, light gray, ensuring the focus remains on the symbolic arrows.
Free with trial The image shows two large arrows pointing in opposite directions, one red arrow pointing downward with a percent symbol indicating a decrease, and one green arrow pointing upward with a percent symbol indicating an increase. This visual metaphor is often used to represent contrasting financial or statistical trends, such as growth versus decline. Decrease arrows vectors Graphic illustration of opposing percentage trends with directional arrows. The image shows two large arrows pointing in opposite directions, one red arrow pointing downward with a percent symbol indicating a decrease, and one green arrow pointing upward with a percent symbol indicating an increase. This visual metaphor is often used to represent contrasting financial or statistical trends, such as growth versus decline
Free with trial The image displays a simple bar chart composed of five red bars of varying heights. Each bar has arrows pointing upward or downward, indicating an increase or decrease in values. The chart visually represents fluctuations in data, with the tallest bar in the center and the shortest bars on the far left and right. Decrease arrows illustrations Red bar chart with upward and downward directional arrows indicating trends. The image displays a simple bar chart composed of five red bars of varying heights. Each bar has arrows pointing upward or downward, indicating an increase or decrease in values. The chart visually represents fluctuations in data, with the tallest bar in the center and the shortest bars on the far left and right
Free with trial The image features a golden dollar symbol surrounded by two opposing arrows, one green pointing upward and the other red pointing downward, symbolizing financial increase and decrease or economic fluctuations. Decrease arrows illustrations Dynamic arrows illustrating financial growth and decline with dollar symbol. The image features a golden dollar symbol surrounded by two opposing arrows, one green pointing upward and the other red pointing downward, symbolizing financial increase and decrease or economic fluctuations
Free with trial The image shows a central upward-pointing red arrow with a percent sign, indicating an increase, flanked by two downward-pointing red arrows on either side, symbolizing decreases or fluctuations in percentage values. This visual metaphor is often used to represent changes in metrics, financial trends, or statistical variations. Decrease arrows illustrations Graphic illustrating percentage increase and decrease with directional arrows. The image shows a central upward-pointing red arrow with a percent sign, indicating an increase, flanked by two downward-pointing red arrows on either side, symbolizing decreases or fluctuations in percentage values. This visual metaphor is often used to represent changes in metrics, financial trends, or statistical variations
Free with trial Depicts a green dollar bill, two gold coins, and two red downward pointing arrows. Represents decrease, low earnings, reduced budget or expense reduction. Decrease arrows vectors Money decrease illustration with downward arrows icon on transparent background. Depicts a green dollar bill, two gold coins, and two red downward pointing arrows. Represents decrease, low earnings, reduced budget or expense reduction.
Free with trial The image shows two large, opposing arrows side by side. The arrow on the left is red and points downward, symbolizing a decline or decrease. The arrow on the right is green and points upward, representing growth or increase. Both arrows are bold and filled with their respective colors. Decrease arrows illustrations Opposing directional arrows indicating decline and growth in contrasting colors. The image shows two large, opposing arrows side by side. The arrow on the left is red and points downward, symbolizing a decline or decrease. The arrow on the right is green and points upward, representing growth or increase. Both arrows are bold and filled with their respective colors
Free with trial The image shows two large arrows pointing in opposite directions. The left arrow is red with a downward direction and labeled with a negative percentage sign, indicating a decrease. The right arrow is green with an upward direction and labeled with a positive percentage sign, indicating an increase. The arrows are visually contrasting to represent opposing trends or changes in percentage values. Decrease arrows vectors Arrows indicating negative and positive percentage changes in contrasting colors. The image shows two large arrows pointing in opposite directions. The left arrow is red with a downward direction and labeled with a negative percentage sign, indicating a decrease. The right arrow is green with an upward direction and labeled with a positive percentage sign, indicating an increase. The arrows are visually contrasting to represent opposing trends or changes in percentage values
Free with trial The image displays two three-dimensional arrows placed side by side on a flat surface. The arrow on the left is red and points upward, symbolizing increase or growth. The arrow on the right is green and points downward, indicating decrease or decline. The simplicity of the design and contrasting colors emphasize the opposing concepts. Decrease arrows illustrations Contrasting arrows symbolizing growth and decline in a minimalist design setting. The image displays two three-dimensional arrows placed side by side on a flat. The image displays two three-dimensional arrows placed side by side on a flat surface. The arrow on the left is red and points upward, symbolizing increase or growth. The arrow on the right is green and points downward, indicating decrease or decline. The simplicity of the design and contrasting colors emphasize the opposing concepts
Free with trial The image shows three identical red downward-pointing arrows, each containing a white percentage symbol. These arrows are commonly used to visually represent a decrease, discount, reduction, or decline in percentages across various contexts such as finance, sales, or statistics. Decrease arrows illustrations Three downward arrows with percentage symbols indicating a decline or reduction trend. The image shows three identical red downward-pointing arrows, each containing a white percentage symbol. These arrows are commonly used to visually represent a decrease, discount, reduction, or decline in percentages across various contexts such as finance, sales, or statistics
Free with trial This image displays two simple, contrasting arrows: one pointing upwards and the other pointing downwards. Both arrows are solid grey with a white background, representing opposite directions or concepts commonly used in user interfaces, charts, or diagrams to indicate increase and decrease. Decrease arrows illustrations Two opposing arrows indicating upward and downward directions in a minimalist design. This image displays two simple, contrasting arrows: one pointing upwards and the other pointing downwards. Both arrows are solid grey with a white background, representing opposite directions or concepts commonly used in user interfaces, charts, or diagrams to indicate increase and decrease
Free with trial The image displays three bold red arrows pointing downward, each containing a percentage symbol. This visual metaphor typically represents a decline, reduction, or drop in percentage-based metrics, often used in financial contexts to indicate decreases in stocks, interest rates, or other economic indicators. Decrease arrows illustrations Three downward arrows symbolizing a decrease in percentage values or financial decline. The image displays three bold red arrows pointing downward, each containing a percentage symbol. This visual metaphor typically represents a decline, reduction, or drop in percentage-based metrics, often used in financial contexts to indicate decreases in stocks, interest rates, or other economic indicators
Free with trial The image displays two contrasting zigzag arrows, one green ascending arrow and one red descending arrow, symbolizing opposing trends or market movements. The green arrow indicates growth, increase, or positive progression, while the red arrow signifies decline, decrease, or negative progression. This visual is often used in financial contexts to represent bullish and bearish market trends,. Decrease arrows illustrations Contrasting upward and downward zigzag arrows representing market or trend fluctuations. The image displays two contrasting zigzag arrows, one green ascending arrow and one red descending arrow, symbolizing opposing trends or market movements. The green arrow indicates growth, increase, or positive progression, while the red arrow signifies decline, decrease, or negative progression. This visual is often used in financial contexts to represent bullish and bearish market trends,
Free with trial The image shows two arrows, one red with a downward direction and a percentage symbol indicating a decrease, and another green with an upward direction and a percentage symbol indicating an increase. These visuals are commonly used to represent opposing trends, such as declines and rises in data like stock prices, economic indicators, or performance metrics. Decrease arrows illustrations Opposing trends represented by percentage change indicators with upward and downward arrows. The image shows two arrows, one red with a downward direction and a percentage symbol indicating a decrease, and another green with an upward direction and a percentage symbol indicating an increase. These visuals are commonly used to represent opposing trends, such as declines and rises in data like stock prices, economic indicators, or performance metrics
Free with trial The image displays three large red downward-pointing arrows, each containing a percentage symbol inside them. The arrows are evenly spaced horizontally and suggest a trend of decreasing values, discounts, or reductions in percentage terms. The design is bold and straightforward, emphasizing a visual representation of decline or savings. Decrease arrows illustrations Three downward arrows indicating a percentage decrease or discount trend on a white background. The image displays three large red downward-pointing arrows, each containing a percentage symbol inside them. The arrows are evenly spaced horizontally and suggest a trend of decreasing values, discounts, or reductions in percentage terms. The design is bold and straightforward, emphasizing a visual representation of decline or savings
Free with trial The image shows a stack of gold-colored coins with two red arrows superimposed on it. One arrow points upward, indicating an increase, while the other points downward, suggesting a decrease, which visually represents financial fluctuations or market volatility. The coins are neatly piled, symbolizing wealth or economic stability, contrasted by the arrows depicting instability or changes in value. Decrease arrows illustrations Stack of coins with upward and downward trending red arrows indicating financial volatility. The image shows a stack of gold-colored coins with two red arrows superimposed on it. One arrow points upward, indicating an increase, while the other points downward, suggesting a decrease, which visually represents financial fluctuations or market volatility. The coins are neatly piled, symbolizing wealth or economic stability, contrasted by the arrows depicting instability or changes in value
Free with trial The image shows a 3D bar graph with blue bars of varying heights. Two large red arrows cross over the graph: one pointing upward to the right, symbolizing growth or increase, and the other pointing downward to the right, symbolizing decline or decrease. This visual metaphor emphasizes conflicting trends or mixed signals in data. Decrease arrows illustrations Contradictory growth and decline indicators represented by a bar graph with crossed arrows. The image shows a 3D bar graph with blue bars of varying heights. Two large red arrows cross over the graph: one pointing upward to the right, symbolizing growth or increase, and the other pointing downward to the right, symbolizing decline or decrease. This visual metaphor emphasizes conflicting trends or mixed signals in data
Free with trial The image shows two arrows, one red pointing downward and the other green pointing upward, each accompanied by a percentage symbol. This visual metaphor typically represents a decrease and an increase in percentage values, respectively. Such symbols are often used in financial, statistical, or performance contexts to indicate trends or changes over time. Decrease arrows illustrations Visual representation of increasing and decreasing percentage trends with directional arrows. The image shows two arrows, one red pointing downward and the other green pointing upward, each accompanied by a percentage symbol. This visual metaphor typically represents a decrease and an increase in percentage values, respectively. Such symbols are often used in financial, statistical, or performance contexts to indicate trends or changes over time
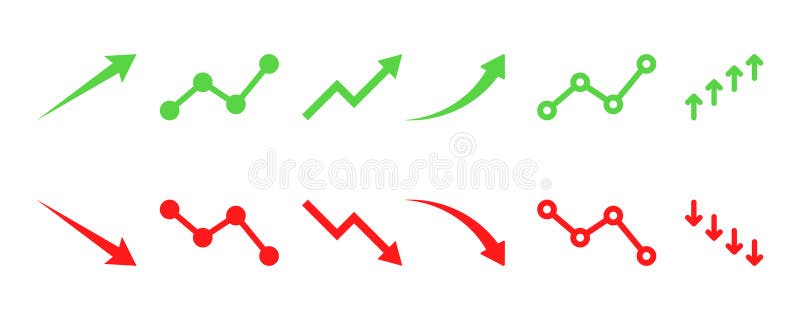
Free with trial Set of financial arrows up and down. Green and red arrows with shadow. Increase and decrease. Vector 10 EPS. Decrease arrows illustrations Set of financial arrows up and down. Green and red arrows with shadow.
Free with trial Close up of a business professional in a blue suit presenting a digital graphic with arrows showing increase in quality and decrease in cost with percentage signs for business efficiency financial planning and effective strategies. Decrease arrows illustrations Hand presenting digital arrows pointing up for quality and down for cost in business strategy concept. Close up of a business professional in a blue suit presenting a digital graphic with arrows showing increase in quality and decrease in cost with percentage signs for business efficiency financial planning and effective strategies
Free with trial Graphic illustration of a dollar sign with downward arrows depicting financial decrease for business concepts. Decrease arrows vectors Graphic illustration of a dollar sign with downward arrows depicting financial decrease for business concepts
Free with trial Illustration of three dollar coins with arrows pointing downwards, signifying financial decrease. Simple, vector-style flat design on a black background. Decrease arrows vectors Three Dollar Coins with Arrows Pointing Downward Signifying Financial Decrease or Investment Loss. Illustration of three dollar coins with arrows pointing downwards, signifying financial decrease. Simple, vector-style flat design on a black background.
Free with trial The up and down arrows represent movement and choices. The up arrow indicates an increase or forward direction, while the down arrow signifies a decrease or backward movement. Together, they guide users in navigating options or adjusting settings. Decrease arrows illustrations Up down arrows symbol. The up and down arrows represent movement and choices. The up arrow indicates an increase or forward direction, while the down arrow signifies a decrease or backward movement. Together, they guide users in navigating options or adjusting settings.
Free with trial Simple black outline icon of a brick wall with arrows pointing down, indicating decrease or collapse. Decrease arrows vectors Brick wall icon with downward arrows. Simple black outline icon of a brick wall with arrows pointing down, indicating decrease or collapse
Free with trial Financial arrows up and down. Green and red arrow. Increase and decrease. Vector 10 EPS. Decrease arrows illustrations Financial arrows up and down. Green and red arrow. Increase and decrease.
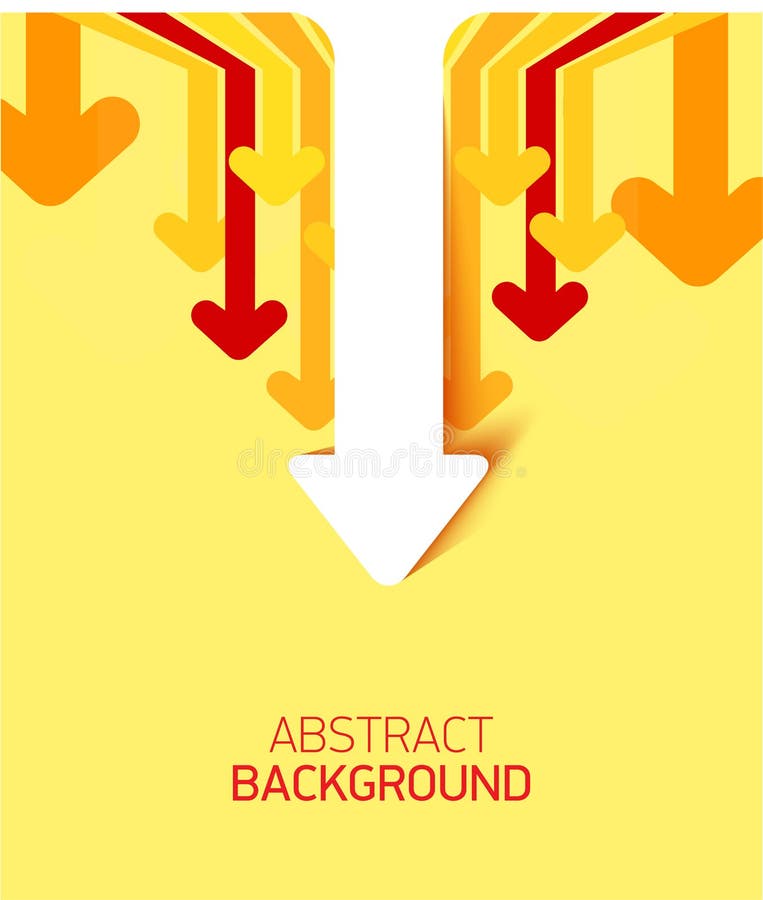
Free with trial Abstract financial background with arrows going down. Concept decrease. Vector illustration. Abstract background with white paper arrows. Decrease arrows vectors Abstract financial background with arrows Concept decrease. Vector illustration. Abstract financial background with arrows going down. Concept decrease. Vector illustration. Abstract background with white paper arrows.
Free with trial This image displays a grid of nine red percentage symbols, each paired with a directional arrow. The arrows point either upward, downward, or are neutral, indicating trends of increase, decrease, or no change respectively. The symbols are arranged in three rows and three columns, with each symbol and arrow combination repeated in different positions. Decrease arrows illustrations Collection of red percentage symbols with directional arrows indicating increase or decrease. This image displays a grid of nine red percentage symbols, each paired with a directional arrow. The arrows point either upward, downward, or are neutral, indicating trends of increase, decrease, or no change respectively. The symbols are arranged in three rows and three columns, with each symbol and arrow combination repeated in different positions
Free with trial Three dimensional blue arrows and plus sign representing growth, progress, increase, decrease, statistics, data analysis, business, finance, charts, and trends. Decrease arrows vectors Three dimensional blue arrows and plus sign symbolizing growth progress increase decrease statistics data analysis. Three dimensional blue arrows and plus sign representing growth, progress, increase, decrease, statistics, data analysis, business, finance, charts, and trends
Free with trial Set of financial arrows up and down. Green and red arrows. Increase and decrease. Vector 10 EPS. Decrease arrows illustrations Set of financial arrows up and down. Green and red arrows.
Free with trial Line art icon of a dollar coin with three arrows pointing down, representing a decrease in value. Decrease arrows vectors Dollar coin decreasing in value with three down arrows. Line art icon of a dollar coin with three arrows pointing down, representing a decrease in value
Free with trial This icon represents a financial transaction, showing money flow with arrows pointing both up and down, symbolizing the fluctuation of value in investments. Decrease arrows vectors Vector art of financial transaction icon, depicting money flow with arrows indicating both increase and decrease in value or. This icon represents a financial transaction, showing money flow with arrows pointing both up and down, symbolizing the fluctuation of value in investments
Free with trial Financial arrows up and down. Green and red arrow. Increase and decrease. Vector 10 EPS. Decrease arrows illustrations Financial arrows up and down. Green and red arrow.
Free with trial Black upward and downward arrows on a white background. The upward arrow on the left points vertically, indicating an increase or upward direction, while the downward arrow on the right points down, suggesting a decrease or downward direction. Both arrows are solid and bold, facilitating clear visibility and distinction. Decrease arrows illustrations Black upward and downward arrows on a white background. The upward arrow on the
Free with trial Three red percentage symbols are shown with arrows pointing downward, representing a decline. Each symbol is positioned above words: "Economy," "Growth," and "Stocks," indicating a decrease in these areas. The arrows are bold and the symbols feature a glossy finish, emphasizing the visual concept of reduction or negative trend. The overall design highlights financial or economic themes. Decrease arrows illustrations Three red percentage symbols are shown with arrows pointing downward
Free with trial Red downward-pointing 3D arrows fill the space, each adorned with white percentage signs. The arrangement suggests a theme of reduction or decline, commonly used in financial or sales contexts to indicate a decrease in values, prices, or rates. The arrows vary slightly in size and orientation, creating a dynamic sense of movement against a plain white background. Decrease arrows illustrations Red downward-pointing 3D arrows fill the space, each adorned with white
Free with trial Red 3D arrows pointing downward with white percentage signs (%) on each. The arrows vary in size, creating a dynamic visual suggesting a reduction or decrease, commonly associated with price drops, discounts, or economic decline. The background is plain white, emphasizing the bold, glossy red of the arrows, which have a smooth texture and a reflective surface. This imagery is frequently used in financial or marketing contexts to indicate downward trends or sales promotions. Decrease arrows illustrations Red 3D arrows pointing downward with white percentage signs (%) on each. The
Free with trial Three red arrows pointing down represent a reduction or decrease, suitable for presentations. Decrease arrows illustrations Red Arrows Pointing Down Symbol. Three red arrows pointing down represent a reduction or decrease, suitable for presentations
Free with trial This icon represents a decrease trend with multiple arrows pointing down. Decrease arrows vectors Arrows pointing down representing decrease trend icon. This icon represents a decrease trend with multiple arrows pointing down
Free with trial Three red, downward-pointing arrows are presented against a black background. Each arrow displays a white percentage symbol "%", signifying a decrease or reduction. The central arrow is larger than the two side arrows, drawing attention to the concept of percentage decline or a sale. Decrease arrows illustrations Three Red Arrows With Percentage Symbols down arrows. Three red, downward-pointing arrows are presented against a black background. Each arrow displays a white percentage symbol "%", signifying a decrease or reduction. The central arrow is larger than the two side arrows, drawing attention to the concept of percentage decline or a sale
Free with trial Percent arrow icon. Growth, increase, decrease arrow filled icons. Up arrows, down arrows. Vector. Decrease arrows illustrations Percent arrow icon. Growth, increase, decrease arrow filled icons.
Free with trial Combines the Greek letter Psi (Ψ) often representing psychology, with downward pointing arrows on either side. Represents a decrease or decline related to mental health, psychological states worsening, data points decreasing in psychology research, or possibly therapy effectiveness trends negatively. Specific concept symbol. vector design Generative AI. Decrease arrows vectors Psi Psychology Symbol Down Arrows Decline Concept, vector design Generative AI. Combines the Greek letter Psi (Ψ) often representing psychology, with downward pointing arrows on either side. Represents a decrease or decline related to mental health, psychological states worsening, data points decreasing in psychology research, or possibly therapy effectiveness trends negatively. Specific concept symbol. vector design Generative AI
Free with trial A simple outline icon featuring two prominent downward-pointing arrows, commonly used to denote download, decrease, or specific direction. Versatile for user interfaces, data metrics, or instructional graphics. Represents clear indication and action, vector design Generative AI. Decrease arrows vectors Two Downward Arrows Icon for Download and Direction, vector design Generative AI. A simple outline icon featuring two prominent downward-pointing arrows, commonly used to denote download, decrease, or specific direction. Versatile for user interfaces, data metrics, or instructional graphics. Represents clear indication and action, vector design Generative AI
Free with trial Abstract 3D rendering of a red sphere adorned with white stripes featuring downward-pointing arrows. Perfect for concepts of decline, decrease, or reduction. Ideal for presentations or websites. Decrease arrows illustrations Red and White Sphere with Arrows: 3D Render. Abstract 3D rendering of a red sphere adorned with white stripes featuring downward-pointing arrows. Perfect for concepts of decline, decrease, or reduction. Ideal for presentations or websites.
Free with trial The up and down arrows represent movement and choices. The up arrow indicates an increase or forward direction, while the down arrow signifies a decrease or backward movement. Together, they guide users in navigating options or adjusting settings. Decrease arrows illustrations Up down arrows symbol. The up and down arrows represent movement and choices. The up arrow indicates an increase or forward direction, while the down arrow signifies a decrease or backward movement. Together, they guide users in navigating options or adjusting settings.
Free with trial The up and down arrows represent movement and choices. The up arrow indicates an increase or forward direction, while the down arrow signifies a decrease or backward movement. Together, they guide users in navigating options or adjusting settings. Decrease arrows illustrations Up down arrows symbol. The up and down arrows represent movement and choices. The up arrow indicates an increase or forward direction, while the down arrow signifies a decrease or backward movement. Together, they guide users in navigating options or adjusting settings.
Free with trial The up and down arrows represent movement and choices. The up arrow indicates an increase or forward direction, while the down arrow signifies a decrease or backward movement. Together, they guide users in navigating options or adjusting settings. Decrease arrows illustrations Up down arrows symbol. The up and down arrows represent movement and choices. The up arrow indicates an increase or forward direction, while the down arrow signifies a decrease or backward movement. Together, they guide users in navigating options or adjusting settings.
Free with trial The up and down arrows represent movement and choices. The up arrow indicates an increase or forward direction, while the down arrow signifies a decrease or backward movement. Together, they guide users in navigating options or adjusting settings. Decrease arrows illustrations Up down arrows symbol. The up and down arrows represent movement and choices. The up arrow indicates an increase or forward direction, while the down arrow signifies a decrease or backward movement. Together, they guide users in navigating options or adjusting settings.
Free with trial The image shows four blue arrows, outlined with a neon blue glow, pointing to the right. The arrows decrease in size from left to right. Decrease arrows illustrations Four blue arrows with neon outlines pointing right, ai generated. The image shows four blue arrows, outlined with a neon blue glow, pointing to the right. The arrows decrease in size from left to right.
Free with trial Abstract financial background with arrows going forward. Concept decrease. Vector illustration. Abstract background with white paper arrows. Decrease arrows vectors Abstract financial background with arrows Concept decrease. Vector illustration. Abstract financial background with arrows going forward. Concept decrease. Vector illustration. Abstract background with white paper arrows.
Free with trial Graph going Up and Down sign with green and red arrows. graph increase, decrease sign design. Decrease arrows vectors Graph going Up and Down sign with green and red arrows. graph increase, decrease sign
Free with trial Clean vector illustration features two sets of parallel arrows against a white background. One set of three arrows is colored bright red and points upwards, each arrow slightly offset from the others, creating a dynamic visual. The second set of three arrows is colored vibrant blue and points downwards, mirroring the arrangement of the red arrows. This contrasting imagery of upward and downward movement is ideal for illustrating concepts of growth versus decline, increase versus decrease, success versus recession, or positive versus negative trends in business, finance, or other data-driven contexts. Decrease arrows illustrations Vector Illustration of Contrasting Red Upward and Blue Downward Arrows. clean vector illustration features two sets of parallel arrows against a white background. One set of three arrows is colored bright red and points upwards, each arrow slightly offset from the others, creating a dynamic visual. The second set of three arrows is colored vibrant blue and points downwards, mirroring the arrangement of the red arrows. This contrasting imagery of upward and downward movement is ideal for illustrating concepts of growth versus decline, increase versus decrease, success versus recession, or positive versus negative trends in business, finance, or other data-driven contexts.
Free with trial Graph going up and down sign financial arrows. chart increase, decrease sign with green and red arrows. vector graph with green and red arrows. Decrease arrows vectors Graph going up and down sign financial arrows. chart increase, decrease sign with green and red arrows. vector graph
Free with trial Three stacks of coins with downward pointing arrows illustrating decrease or cost. Decrease arrows vectors Three stacks of coins with downward pointing arrows illustrating decrease or cost
Free with trial Two prominent blue three-dimensional arrows are positioned vertically against a stark white background. One arrow points directly upwards, and the other points directly downwards, symbolizing opposing directions or concepts such as increase and decrease. Decrease arrows illustrations Two Blue 3D Arrows Pointing Up and Down on a White Background Keywords: arrow, arrows, up arrow, down arrow, direction, movement. Two prominent blue three-dimensional arrows are positioned vertically against a stark white background. One arrow points directly upwards, and the other points directly downwards, symbolizing opposing directions or concepts such as increase and decrease
Free with trial Photo vertical collage picture person holding two arrows up down percentage balance profit increase decrease stress price. Decrease arrows illustrations Photo vertical collage picture person holding two arrows up down percentage balance profit increase decrease stress
Free with trial Tariffs word with downward arrows showing falling trade taxes decrease. Tariffs background. Decrease arrows vectors Tariffs word with downward arrows showing falling trade taxes decrease. Green background. Tariffs word with downward arrows showing falling trade taxes decrease. Tariffs background. Tariffs word with downward arrows showing falling trade taxes decrease. Tariffs background
Free with trial Clock With Arrows Line And Solid Icon Set. Time Management, Efficiency, And Productivity Symbol Collection. Directional Arrows Indicating Increase And Decrease. Isolated Vector Illustration. Decrease arrows vectors Clock With Arrows Line And Solid Icon Set. Time Management, Efficiency, And Productivity Symbol Collection. Directional
Free with trial Percentage rate arrow icon set. Percent arrow up and down symbol. Price increase and decrease vector illustration. Profit sign. Up and down arrows with percentage pictogram. Financial growth concept. Decrease arrows vectors Percentage rate arrow icon set. Percent arrow up and down symbol. Price increase and decrease vector illustration. Profit sign. Up
Free with trial Four stacks of Canadian coins, varying in height, are shown with red downward-pointing arrows on their sides. The isolated object on a white background symbolizes a decrease in currency value or economic downturn. created Ai. Decrease arrows illustrations Canadian currency stacks with downward red arrows indicating financial decline isolated on white background. Four stacks of Canadian coins, varying in height, are shown with red downward-pointing arrows on their sides. The isolated object on a white background symbolizes a decrease in currency value or economic downturn. created Ai
Free with trial The image features two glossy, metallic red arrows pointing downwards against a stark black background. The arrows appear to be three dimensional with a reflective surface. They suggest a decline, decrease, or a negative trend. Decrease arrows vectors Two Glossy Red Arrows Pointing Downwards on a Black Background Representing a Sharp Decrease or a Sharp Negative Trend. The image features two glossy, metallic red arrows pointing downwards against a stark black background. The arrows appear to be three dimensional with a reflective surface. They suggest a decline, decrease, or a negative trend
Free with trial A 3D rendered image featuring two arrows pointing downwards on a white background. A bold red arrow descends sharply, while a thinner blue arrow follows a slightly different path. A small red ring is depicted at the point where the red arrow touches the surface, suggesting a low point or impact. This visual represents a concept of decline or loss. Decrease arrows illustrations Red and Blue Arrows Pointing Downward on White Background Representing Decline Keywords: arrow, down, decline, decrease, loss, red. A 3D rendered image featuring two arrows pointing downwards on a white background. A bold red arrow descends sharply, while a thinner blue arrow follows a slightly different path. A small red ring is depicted at the point where the red arrow touches the surface, suggesting a low point or impact. This visual represents a concept of decline or loss