Free with trial This abstract 3D composition features purple graphs symbolizing growth and decline, set against a soft purple backdrop, ideal for business concepts. Decrease background illustrations Abstract 3D Purple Graphs Representing Growth and Decline on a Soft Purple Background. This abstract 3D composition features purple graphs symbolizing growth and. This abstract 3D composition features purple graphs symbolizing growth and decline, set against a soft purple backdrop, ideal for business concepts
Free with trial Red arrow declining on bar graph, business finance chart, downward trend, recession, financial data, blue background. Decrease background illustrations Red arrow graph showing decline, business finance chart, downward trend, recession. Red arrow declining on bar graph, business finance chart, downward trend. Red arrow declining on bar graph, business finance chart, downward trend, recession, financial data, blue background
Free with trial Cost reduction icon. Image isolated on white background. Vector illustration. Decrease background vectors Cost reduction icon. Image isolated on white background. Vector illustration. Cost reduction icon. Image isolated on white background. Vector illustration
Free with trial A 3D rendered bar chart composed of four colored blocks of varying heights. The blocks are blue, yellow, red, and white, arranged from shortest to tallest from left to right. The chart is presented on a clean white background, with subtle shadows beneath the blocks. Decrease background illustrations Colorful 3D Bar Chart with Varying Heights on a White Background graph statistics. A 3D rendered bar chart composed of four colored blocks of varying heights. A 3D rendered bar chart composed of four colored blocks of varying heights. The blocks are blue, yellow, red, and white, arranged from shortest to tallest from left to right. The chart is presented on a clean white background, with subtle shadows beneath the blocks
Free with trial Abstract close-up view of a digital display showing a fluctuating financial chart. The orange graph line is highlighted against a dark blue background with a complex grid pattern, suggesting data streaming and analysis. The image evokes a sense of technology, market trends, and financial information. Suitable for use in articles, presentations, or websites related to finance, technology, data analysis, and business. Decrease background illustrations Dynamic Financial Data Visualization. Abstract close-up view of a digital display showing a fluctuating financial chart. The orange graph line is highlighted. Abstract close-up view of a digital display showing a fluctuating financial chart. The orange graph line is highlighted against a dark blue background with a complex grid pattern, suggesting data streaming and analysis. The image evokes a sense of technology, market trends, and financial information. Suitable for use in articles, presentations, or websites related to finance, technology, data analysis, and business.
Free with trial The image shows a three-dimensional, gold-colored percentage sign floating against a neutral white backdrop. The symbol has a reflective, metallic surface that gives it a polished and luxurious appearance, emphasizing its importance and prominence in financial, statistical, or analytical contexts. Decrease background illustrations A shiny golden percentage symbol displayed prominently against a plain background. The image shows a three-dimensional, gold-colored percentage sign floating. The image shows a three-dimensional, gold-colored percentage sign floating against a neutral white backdrop. The symbol has a reflective, metallic surface that gives it a polished and luxurious appearance, emphasizing its importance and prominence in financial, statistical, or analytical contexts
Free with trial Hot deal button. On white background. Decrease background illustrations Hot deal button. On white background
Free with trial A vibrant 3D bar chart icon isolated on a clean white background. This minimalist data visualization features five colorful bars in a soft, pastel palette of yellow, pink, and purple, arranged in descending order. The clean, modern render is perfect for illustrating concepts like business statistics, financial reports, market analysis, and performance metrics. An ideal graphic element for presentations, infographics, websites, and educational materials, symbolizing data, comparison, and analytics in a visually appealing way. 3D illustration. Decrease background illustrations 3D Colorful Bar Chart for Business and Data Analysis. A vibrant 3D bar chart icon isolated on a clean white background. This minimalist data visualization. A vibrant 3D bar chart icon isolated on a clean white background. This minimalist data visualization features five colorful bars in a soft, pastel palette of yellow, pink, and purple, arranged in descending order. The clean, modern render is perfect for illustrating concepts like business statistics, financial reports, market analysis, and performance metrics. An ideal graphic element for presentations, infographics, websites, and educational materials, symbolizing data, comparison, and analytics in a visually appealing way. 3D illustration.
Free with trial A red arrow pointing downwards with a drop of particles. On a grey background. Decrease background illustrations A red arrow pointing downwards with a drop of particles. On a grey background
Free with trial A 3D rendered icon of a bar chart with four ascending bars. The bars are a deep blue color and are heavily covered in realistic ice and snow, dripping from the tops. The chart is framed by metallic gray and dark gray. The icon is presented on a white background. Decrease background illustrations 3D Bar Chart Icon With Blue Bars Covered in Ice and Snow. A 3D rendered icon of a bar chart with four ascending bars. The bars are a deep blue color and are. A 3D rendered icon of a bar chart with four ascending bars. The bars are a deep blue color and are heavily covered in realistic ice and snow, dripping from the tops. The chart is framed by metallic gray and dark gray. The icon is presented on a white background
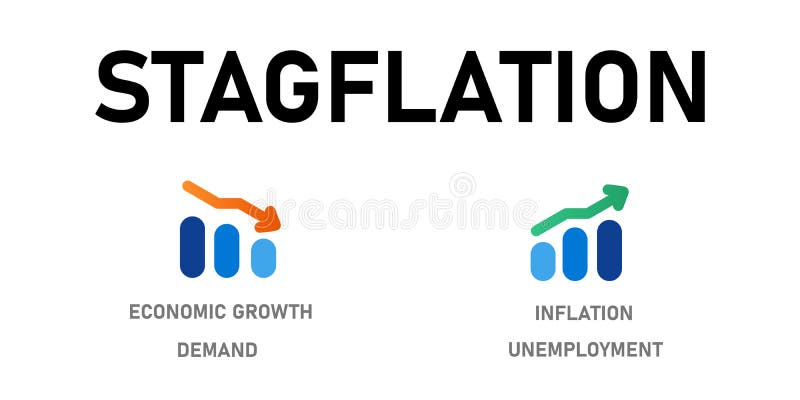
Free with trial Stagflation economic condition with high inflation increase price unemployment but low decrease economic growth and. Demand chart vector. Decrease background vectors Stagflation economic condition with high inflation increase price unemployment but low decrease economic growth and. Demand chart vector
Free with trial A dynamic 3D visualization showcasing financial data. The scene features a rising bar chart with an upward trend arrow, symbolizing growth and success. Adjacent to it, a colorful pie chart represents data segmentation and distribution. The background is a dark, textured surface with subtle grid lines and abstract chart elements, creating a sophisticated and modern aesthetic. This imagery is ideal for presentations, reports, and digital content related to finance, business, economics, and data analysis. Decrease background illustrations 3D Financial Data Visualization: Growth Charts and Pie Graph. A dynamic 3D visualization showcasing financial data. The scene features a rising bar chart with an. A dynamic 3D visualization showcasing financial data. The scene features a rising bar chart with an upward trend arrow, symbolizing growth and success. Adjacent to it, a colorful pie chart represents data segmentation and distribution. The background is a dark, textured surface with subtle grid lines and abstract chart elements, creating a sophisticated and modern aesthetic. This imagery is ideal for presentations, reports, and digital content related to finance, business, economics, and data analysis.
Free with trial A polished metallic arrow signifying a downward direction against a clean, bright backdrop. Decrease background illustrations A gleaming golden arrow points downward casting a subtle shadow on a white background. A polished metallic arrow signifying a downward direction against a clean. A polished metallic arrow signifying a downward direction against a clean, bright backdrop
Free with trial Money loss coins down solid icon. A solid icon depicting a stack of coins with an arrow pointing downwards, presented isolated on a clean white background. Decrease background vectors Money loss coins down solid icon. A solid icon depicting a stack of coins with an arrow pointing downwards, presented isolated on a clean white background
Free with trial Black wave patterns on a white background. The designs include six solid silhouettes on the left with various wave formations, and six halftone-style waves on the right. The halftone effect creates a gradient appearance as dots decrease in density away from the crest. These abstract representations convey movement and fluidity, illustrating stylized ocean waves common in graphic design and print media. Decrease background vectors Black Abstract dotted halftone wave design dot patterns. Black wave patterns on a white background. The designs include six solid silhouettes on the left with. Black wave patterns on a white background. The designs include six solid silhouettes on the left with various wave formations, and six halftone-style waves on the right. The halftone effect creates a gradient appearance as dots decrease in density away from the crest. These abstract representations convey movement and fluidity, illustrating stylized ocean waves common in graphic design and print media.
Free with trial A 3D rendered image depicts a bold red arrow curving downwards, symbolizing a decline or loss. Three gold coins, each featuring a dollar sign, are scattered around the arrow, reinforcing the financial context. The image is presented on a white background, making the elements stand out clearly. This visual represents financial downturns, economic recession, or decreasing value. Decrease background illustrations Red Downward Arrow with Gold Dollar Coins red arrow. A 3D rendered image depicts a bold red arrow curving downwards, symbolizing a decline or loss. Three gold. A 3D rendered image depicts a bold red arrow curving downwards, symbolizing a decline or loss. Three gold coins, each featuring a dollar sign, are scattered around the arrow, reinforcing the financial context. The image is presented on a white background, making the elements stand out clearly. This visual represents financial downturns, economic recession, or decreasing value
Free with trial A bright green, three-dimensional arrow is depicted pointing directly downwards. The arrow has a bold, geometric shape with clean lines and a slightly rounded appearance. It is presented in isolation against a plain white background, with a subtle shadow cast beneath it, suggesting it is floating slightly above the surface. Decrease background illustrations Green 3D Arrow Pointing Downward on White Background direction symbol. A bright green, three-dimensional arrow is depicted pointing directly downwards. The arrow. A bright green, three-dimensional arrow is depicted pointing directly downwards. The arrow has a bold, geometric shape with clean lines and a slightly rounded appearance. It is presented in isolation against a plain white background, with a subtle shadow cast beneath it, suggesting it is floating slightly above the surface
Free with trial A captivating abstract geometric pattern featuring a dynamic spiral composed of numerous black squares on a pristine white background. The squares progressively decrease in size and density towards the center, creating a powerful sense of depth, movement, and an optical illusion of rotation or a vortex. This minimalist and high-contrast design is ideal for modern backgrounds, technology-related visuals, branding, or any project requiring a sophisticated and eye-catching graphic element. Decrease background vectors Abstract Black and White Spiral Squares Geometric Pattern. A captivating abstract geometric pattern featuring a dynamic spiral composed of numerous black squares. A captivating abstract geometric pattern featuring a dynamic spiral composed of numerous black squares on a pristine white background. The squares progressively decrease in size and density towards the center, creating a powerful sense of depth, movement, and an optical illusion of rotation or a vortex. This minimalist and high-contrast design is ideal for modern backgrounds, technology-related visuals, branding, or any project requiring a sophisticated and eye-catching graphic element.
Free with trial A red neon arrow points downward reflecting in puddles on a wet surface against a blurred cityscape in the background, likely used to represent a decline or downturn. Decrease background illustrations Red Neon Arrow Downward on Rainy Night. A red neon arrow points downward reflecting in puddles on a wet surface against a blurred cityscape in the background. A red neon arrow points downward reflecting in puddles on a wet surface against a blurred cityscape in the background, likely used to represent a decline or downturn
Free with trial A minimalist abstract image featuring a horizontal sequence of circles or rings set against a pure black background. The circles are rendered in a glowing neon yellow-green, and they progressively decrease in size from the large circle on the left to the smallest on the far right. This arrangement suggests a visual progression, scale, diminishing distance, or a visualization of frequency decay, creating a highly organized and technological aesthetic. Decrease background illustrations Neon Ring Progression on Black. A minimalist abstract image featuring a horizontal sequence of circles or rings set against a pure black background. The circles. A minimalist abstract image featuring a horizontal sequence of circles or rings set against a pure black background. The circles are rendered in a glowing neon yellow-green, and they progressively decrease in size from the large circle on the left to the smallest on the far right. This arrangement suggests a visual progression, scale, diminishing distance, or a visualization of frequency decay, creating a highly organized and technological aesthetic.
Free with trial An abstract digital financial chart features multiple vibrant, fluctuating neon lines in blue, green, pink, and white, set against a dark grid background. Prominent red upward and downward arrows, along with a green downward arrow, clearly indicate market trends, growth, and decline. Interspersed geometric shapes connected by lines suggest complex data points and network connections. This dynamic visualization is ideal for illustrating concepts of stock market data, cryptocurrency trends, business analytics, investment volatility, big data, AI, and financial technology, suitable for modern business and tech-related projects. Decrease background illustrations Digital Financial Data Chart with Fluctuating Lines and Arrows. An abstract digital financial chart features multiple vibrant, fluctuating neon lines in blue. An abstract digital financial chart features multiple vibrant, fluctuating neon lines in blue, green, pink, and white, set against a dark grid background. Prominent red upward and downward arrows, along with a green downward arrow, clearly indicate market trends, growth, and decline. Interspersed geometric shapes connected by lines suggest complex data points and network connections. This dynamic visualization is ideal for illustrating concepts of stock market data, cryptocurrency trends, business analytics, investment volatility, big data, AI, and financial technology, suitable for modern business and tech-related projects.
Free with trial A striking 3D golden percentage sign displaying fifty-three percent, ideal for financial, statistical, or promotional designs. Decrease background illustrations Large golden 3d percentage sign fifty three percent isolated on white background. A striking 3D golden percentage sign displaying fifty-three percent, ideal for. A striking 3D golden percentage sign displaying fifty-three percent, ideal for financial, statistical, or promotional designs
Free with trial Minimalist downgrade button with arrow symbol on sleek dark interface, ideal for software and app design projects. Decrease background vectors Digital downgrade button icon with downward arrow on dark background for UI design. Minimalist downgrade button with arrow symbol on sleek dark interface, ideal. Minimalist downgrade button with arrow symbol on sleek dark interface, ideal for software and app design projects
Free with trial Round icon of reduce screen size. Flat style illustration with long shadow in five variants background color. Decrease background vectors Round icon of reduce screen size. Flat style illustration with long shadow in five variants background color
Free with trial A flat grayscale bar chart icon presented on a black background, ideal for data-driven presentations and dashboards. Decrease background vectors Simple grayscale bar chart icon on black background for data analysis and reporting. A flat grayscale bar chart icon presented on a black background, ideal for. A flat grayscale bar chart icon presented on a black background, ideal for data-driven presentations and dashboards.
Free with trial The image depicts a red line graph that shows a downward trend. The graph has a prominent red arrow pointing downwards, indicating a significant decline. The background is dark, which makes the red line and arrow stand out prominently. Decrease background illustrations A vivid red downward trending line graph with a prominent arrow pointing downwards. The image depicts a red line graph that shows a downward trend. The graph has. The image depicts a red line graph that shows a downward trend. The graph has a prominent red arrow pointing downwards, indicating a significant decline. The background is dark, which makes the red line and arrow stand out prominently
Free with trial A seamless pattern featuring a grid of hexagon shapes that gradually decrease in size from left to right across the frame. Decrease background vectors Seamless hexagonal grid pattern, Abstract honeycomb shape design, Monochrome vector background, Repeating geometric element. A seamless pattern featuring a grid. A seamless pattern featuring a grid of hexagon shapes that gradually decrease in size from left to right across the frame
Free with trial Abstract background with sun ray and dots. Summer vector illustration. For design. Decrease background vectors Abstract background with sun ray and dots. Summer vector illustration. For design
Free with trial Abstract background with sun ray and dots. Summer vector illustration. For design. Decrease background vectors Abstract background with sun ray and dots. Summer vector illustration. For design
Free with trial Abstract background with sun ray and dots. Summer vector illustration. For design. Decrease background vectors Abstract background with sun ray and dots. Summer vector illustration. For design
Free with trial Gold 3d object box, Goldmine on black background, wealth business concept idea. Decrease background vectors Isolated golden cube pyramid with world major currencies US dollar sign, euro, Japanese yen icon. Gold 3d object box, Goldmine on black background, wealth. Gold 3d object box, Goldmine on black background, wealth business concept idea
Free with trial Graph down. Black Icon graph decline with arrow isolated on white background. Hologram statistic. Deficit direction for business concept design. Analysis information forecast. Vector illustration. Decrease background vectors Graph down. Black Icon graph decline with arrow isolated on white background. Hologram deficit direction for business design. Graph down. Black Icon graph. Graph down. Black Icon graph decline with arrow isolated on white background. Hologram statistic. Deficit direction for business concept design. Analysis information forecast. Vector illustration
Free with trial Audio / volume icon button red. Audio / volume icon button - search web button - vector illustration on isolated white background with reflection shadow. Decrease background illustrations Audio / volume icon button red. Audio / volume icon button - search web button - vector illustration on isolated white background with reflection shadow
Free with trial Audio / volume icon button red. Audio / volume icon button - search web button - vector illustration on isolated white background with reflection shadow. Decrease background illustrations Audio / volume icon button red. Audio / volume icon button - search web button - vector illustration on isolated white background with reflection shadow
Free with trial Audio / volume icon button red. Audio / volume icon button - search web button - vector illustration on isolated white background with reflection shadow. Decrease background illustrations Audio / volume icon button red. Audio / volume icon button - search web button - vector illustration on isolated white background with reflection shadow
Free with trial Do Not Decrease The Goal. Inspirational motivational quote about efforts. Poster design for wall. Decrease background vectors Do Not Decrease The Goal. Inspirational motivational quote about efforts. Poster design for wall.
Free with trial Audio / volume icon button red. Audio / volume icon button - search web button - vector illustration on isolated white background with reflection shadow. Decrease background illustrations Audio / volume icon button red. Audio / volume icon button - search web button - vector illustration on isolated white background with reflection shadow
Free with trial Audio / volume icon button red. Audio / volume icon button - search web button - vector illustration on isolated white background with reflection shadow. Decrease background illustrations Audio / volume icon button red. Audio / volume icon button - search web button - vector illustration on isolated white background with reflection shadow
Free with trial Audio / volume icon button red. Audio / volume icon button - search web button - vector illustration on isolated white background with reflection shadow. Decrease background illustrations Audio / volume icon button red. Audio / volume icon button - search web button - vector illustration on isolated white background with reflection shadow
Free with trial Blue downward-pointing arrow with a stylized, curved design. The arrow is vibrant blue and features a slightly brush-like texture, giving it a dynamic, flowing appearance. The background is plain white, emphasizing the arrow's color and shape. Decrease background vectors Blue arrow pointing down. Blue downward-pointing arrow with a stylized, curved design. The arrow is vibrant blue and features a slightly brush-like texture. Blue downward-pointing arrow with a stylized, curved design. The arrow is vibrant blue and features a slightly brush-like texture, giving it a dynamic, flowing appearance. The background is plain white, emphasizing the arrow's color and shape.
Free with trial A minimalist, flat design illustration of a bar chart featuring three vertical bars of varying heights. The bars are colored in orange, teal, and a lighter orange, set against a clean white background. This graphic represents data visualization, trends, and comparisons, suitable for business reports, educational materials, or web design elements. Decrease background illustrations Simple Bar Chart with Three Bars. A minimalist, flat design illustration of a bar chart featuring three vertical bars of varying heights. The bars are colored in. A minimalist, flat design illustration of a bar chart featuring three vertical bars of varying heights. The bars are colored in orange, teal, and a lighter orange, set against a clean white background. This graphic represents data visualization, trends, and comparisons, suitable for business reports, educational materials, or web design elements.
Free with trial Concept of low yield of production 3d sign. On grey background. Decrease background illustrations Concept of low yield of production 3d sign. On grey background
Free with trial Audio / volume icon button red. Audio / volume icon button - search web button - vector illustration on isolated white background with reflection shadow. Decrease background illustrations Audio / volume icon button red. Audio / volume icon button - search web button - vector illustration on isolated white background with reflection shadow
Free with trial A glowing red 3D coin with a downward arrow symbol, floating against a digital background featuring declining bar charts and bearish market indicators. The neon red lighting emphasizes loss, downturn, risk, volatility, and negative financial trends. Ideal for illustrating stock market crashes, crypto decline, recession concepts, falling prices, and economic downturn visuals. This image is Generated with the help of AI. Decrease background illustrations Bearish red 3D coin with down arrow and falling market chart. A glowing red 3D coin with a downward arrow symbol, floating against a digital background featuring. A glowing red 3D coin with a downward arrow symbol, floating against a digital background featuring declining bar charts and bearish market indicators. The neon red lighting emphasizes loss, downturn, risk, volatility, and negative financial trends. Ideal for illustrating stock market crashes, crypto decline, recession concepts, falling prices, and economic downturn visuals. This image is Generated with the help of AI.
Free with trial A 3D abstract composition featuring rows of glowing blue spheres arranged in a converging tunnel shape. The spheres decrease in size toward a bright, radiant white light source at the center. Decrease background illustrations Abstract 3 d background, with glowing blue, spheres arranged in, a converging tunnel, pattern, leading to, a bright central, light. A 3D abstract composition. A 3D abstract composition featuring rows of glowing blue spheres arranged in a converging tunnel shape. The spheres decrease in size toward a bright, radiant white light source at the center
Free with trial A solid blue arrow graphic indicates a downward and leftward direction against a plain white backdrop. Decrease background vectors Blue Arrow Pointing Down-Left on White Background, Simple Graphic, Directional Symbol. A solid blue arrow graphic indicates a downward and leftward direction. A solid blue arrow graphic indicates a downward and leftward direction against a plain white backdrop
Free with trial Conceptual line art depicting a decrease in gold prices. Decrease background illustrations Gold Price Drop Magnifying Glass Showing Decreasing Value. Conceptual line art depicting a decrease in gold prices. Conceptual line art depicting a decrease in gold prices.
Free with trial A 3D white cloud floats above a series of decreasing tealcolored bars on a teal background The bars decrease in size from left to right The cloud consists of multiple rounded shapes The background is a uniform teal color. Decrease background illustrations 3D cloud floating above decreasing teal bar chart graph. A 3D white cloud floats above a series of decreasing tealcolored bars on a teal background The bars. A 3D white cloud floats above a series of decreasing tealcolored bars on a teal background The bars decrease in size from left to right The cloud consists of multiple rounded shapes The background is a uniform teal color.
Free with trial A striking visual depicting a golden coin with intricate patterns standing upright against a dark, reflective background. A vibrant, glowing red arrow dramatically points downwards towards the coin, symbolizing financial decline, market downturn, or a significant loss in value. This powerful image effectively conveys concepts like investment risk, economic crisis, depreciation of assets, and falling prices. Ideal for illustrating articles, reports, or presentations on financial challenges, stock market crashes, investment warnings, and economic trends. Decrease background illustrations Golden Coin and Red Downward Arrow: Financial Decline Concept. A striking visual depicting a golden coin with intricate patterns standing upright against a dark. A striking visual depicting a golden coin with intricate patterns standing upright against a dark, reflective background. A vibrant, glowing red arrow dramatically points downwards towards the coin, symbolizing financial decline, market downturn, or a significant loss in value. This powerful image effectively conveys concepts like investment risk, economic crisis, depreciation of assets, and falling prices. Ideal for illustrating articles, reports, or presentations on financial challenges, stock market crashes, investment warnings, and economic trends.
Free with trial A black icon showing a bar graph with a downward trending arrow indicating a decline. Decrease background illustrations Black bar graph with downward trending arrow icon on white background chart decline. A black icon showing a bar graph with a downward trending arrow indicating a. A black icon showing a bar graph with a downward trending arrow indicating a decline
Free with trial A black silhouette of a bar chart with a vertical scale and grid lines, representing data analysis. Decrease background illustrations Black bar chart icon with grid lines and scale on white background graph statistics. A black silhouette of a bar chart with a vertical scale and grid lines. A black silhouette of a bar chart with a vertical scale and grid lines, representing data analysis
Free with trial A sequence of blue arrows pointing leftward, decreasing in size and color saturation from left to right. Decrease background illustrations Series of arrows pointing to the left in gradual decrease in size and color intensity. A sequence of blue arrows pointing leftward, decreasing in size and color. A sequence of blue arrows pointing leftward, decreasing in size and color saturation from left to right
Free with trial Graph. Digital illustration of graph in colour background. Decrease background illustrations Graph. Digital illustration of graph in colour background
Free with trial Two translucent, glowing blue 3D arrows are positioned against a light gray background. One arrow points directly upwards, while the other points downwards, symbolizing concepts like increase and decrease, upload and download, or progress and decline. The arrows have a sleek, modern design with illuminated edges. Decrease background illustrations Two Glowing Blue 3D Arrows, One Pointing Up and One Pointing Down up arrow down arrow. Two translucent, glowing blue 3D arrows are positioned against a light. Two translucent, glowing blue 3D arrows are positioned against a light gray background. One arrow points directly upwards, while the other points downwards, symbolizing concepts like increase and decrease, upload and download, or progress and decline. The arrows have a sleek, modern design with illuminated edges
Free with trial The image features a grid of eight red downward-pointing arrows, each containing a percentage symbol. The arrows are arranged in two rows of four, creating a symmetrical pattern. The arrows are identical in design and color, with the percentage symbol prominently displayed in the center of each arrow. The background is plain and white, which contrasts with the vibrant red of the arrows, making. Decrease background illustrations Set of eight red downward arrows with percentage symbols. The image features a grid of eight red downward-pointing arrows, each containing a percentage symbol. The image features a grid of eight red downward-pointing arrows, each containing a percentage symbol. The arrows are arranged in two rows of four, creating a symmetrical pattern. The arrows are identical in design and color, with the percentage symbol prominently displayed in the center of each arrow. The background is plain and white, which contrasts with the vibrant red of the arrows, making
Free with trial Cracked iceberg pieces with water gap middle background template. Global warming and environmental conditions 3D illustration render. Decrease background illustrations Cracked iceberg pieces with water gap middle background template. Global warming and environmental conditions 3D illustration render
Free with trial The image displays a financial stock market chart with various colored candlesticks and multiple technical indicators overlaid on a grid background. Decrease background illustrations Detailed financial stock market chart with technical indicators and price movements. The image displays a financial stock market chart with various colored. The image displays a financial stock market chart with various colored candlesticks and multiple technical indicators overlaid on a grid background
Free with trial A stack of black oil barrels is visually represented with a sharp red downward-trending arrow, symbolizing a significant economic decline or price drop in the oil industry. Decrease background illustrations Oil barrel decline indicated by red arrow on white background. A stack of black oil barrels is visually represented with a sharp red downward-trending arrow. A stack of black oil barrels is visually represented with a sharp red downward-trending arrow, symbolizing a significant economic decline or price drop in the oil industry
Free with trial A stark red arrow graph descends sharply, symbolizing a significant downturn or loss, set against a minimalist blue backdrop. Decrease background illustrations Red arrow graph shows steep decline against blue background. A stark red arrow graph descends sharply, symbolizing a significant downturn or loss, set against a. A stark red arrow graph descends sharply, symbolizing a significant downturn or loss, set against a minimalist blue backdrop
Free with trial A collection of black and white crochet symbols and instructions displayed on a white background. The image features various crochet stitch symbols, including chain, slip stitch, single crochet, treble crochet, half double crochet, and more. The clean design and clear typography make this image suitable for educational materials, tutorials, or craft-related content. It can be used for illustrating crochet patterns, explaining techniques, or as a design element in craft projects. Decrease background illustrations Crochet Symbols and Instructions. A collection of black and white crochet symbols and instructions displayed on a white background. The image features various. A collection of black and white crochet symbols and instructions displayed on a white background. The image features various crochet stitch symbols, including chain, slip stitch, single crochet, treble crochet, half double crochet, and more. The clean design and clear typography make this image suitable for educational materials, tutorials, or craft-related content. It can be used for illustrating crochet patterns, explaining techniques, or as a design element in craft projects.
Free with trial A black and white image of a dollar sign with a curved arrow. A black dollar sign with a curved arrow pointing down and to the right, on a white background. Decrease background vectors A black and white image of a dollar sign with a curved arrow. A black dollar sign with a curved arrow pointing down and to the right, on a white background
Free with trial Endorphin high button on white. Background. Decrease background illustrations Endorphin high button on white. Background
Free with trial Black smooth arrow moving in a downward and leftward direction, featuring three thin lines at its pointed tip, isolated on white background. Decrease background vectors Abstract smooth black arrow pointing down left with three lines at tip. Black smooth arrow moving in a downward and leftward direction, featuring three thin. Black smooth arrow moving in a downward and leftward direction, featuring three thin lines at its pointed tip, isolated on white background
Free with trial Black smooth arrow moving in a downward and leftward direction, featuring three thin lines at its pointed tip, isolated on white background. Decrease background vectors Abstract smooth black arrow pointing down left with three lines at tip. Black smooth arrow moving in a downward and leftward direction, featuring three thin. Black smooth arrow moving in a downward and leftward direction, featuring three thin lines at its pointed tip, isolated on white background
Free with trial Black icon of a jagged downward trend line within a circle on a white background. Clear details and vibrant co. Decrease background illustrations Circular Icon With Downward Jagged Trend Line graph chart. Black icon of a jagged downward trend line within a circle on a white background. Clear details and. Black icon of a jagged downward trend line within a circle on a white background. Clear details and vibrant co
Free with trial A simple and clean line art icon of a graph, isolated on a white background. This vector illustration features a line chart with axes, showing a fluctuating trend with distinct data points. The minimalist design makes it perfect for various applications related to business, finance, and data analysis. Ideal for use in presentations, infographics, websites, mobile apps, and user interfaces to represent concepts like statistics, growth, market trends, performance reports, and financial analytics. A versatile symbol for progress and data visualization. Decrease background illustrations Analytics Line Graph Vector Icon. A simple and clean line art icon of a graph, isolated on a white background. This vector illustration features a line chart. A simple and clean line art icon of a graph, isolated on a white background. This vector illustration features a line chart with axes, showing a fluctuating trend with distinct data points. The minimalist design makes it perfect for various applications related to business, finance, and data analysis. Ideal for use in presentations, infographics, websites, mobile apps, and user interfaces to represent concepts like statistics, growth, market trends, performance reports, and financial analytics. A versatile symbol for progress and data visualization.
Free with trial A gold shattered Bitcoin coin with a falling red chart, symbolizing a cryptocurrency crash and economic crisis, set against a dark, reflective background. Image is generated using AI. Decrease background illustrations Bitcoin Falling, Economic Crisis, Red Chart. A gold shattered Bitcoin coin with a falling red chart, symbolizing a cryptocurrency crash and economic crisis, set. A gold shattered Bitcoin coin with a falling red chart, symbolizing a cryptocurrency crash and economic crisis, set against a dark, reflective background. Image is generated using AI
Free with trial This image is a flat design showing a decreasing red bar graph on a black background. It symbolizes a decline or negative trend. Decrease background vectors Decreasing Red Bar Graph on Black Background Representing Decline or Negative Trends. This image is a flat design showing a decreasing red bar graph on a black. This image is a flat design showing a decreasing red bar graph on a black background. It symbolizes a decline or negative trend.
Free with trial Three green arrows pointing downwards, each displaying a white percentage symbol. Isolated on a transparent background. Decrease background vectors Three Green Downward Arrows with Percent Symbol isolated on a transparent background. Three green arrows pointing downwards, each displaying a white percentage. Three green arrows pointing downwards, each displaying a white percentage symbol. Isolated on a transparent background
Free with trial Red downward arrow. A detailed image of a red downward arrow with a gradient effect, pointing downwards. The arrow is centered on a plain white background. Decrease background illustrations Red downward arrow. A detailed image of a red downward arrow with a gradient effect, pointing downwards. The arrow is centered on a plain white background
Free with trial Image Compression Outline Icon Vector Linear File Shrink Symbol for Web Optimization Isolated on White Background. Image Compression Outline Icon Vector Linear. Decrease background vectors Image Compression Outline Icon Vector Linear File Shrink Symbol for Web Optimization Isolated on White Background. Image Compression Outline Icon Vector Linear
Free with trial Four icons depict rising and falling percentage values with arrows and curved lines on a white background. Decrease background illustrations Arrows indicating percentage increase and decrease in finance. Four icons depict rising and falling percentage values with arrows and curved lines on a white. Four icons depict rising and falling percentage values with arrows and curved lines on a white background
Free with trial Red sphere with downward arrow icon. A glossy red sphere with a white downward pointing arrow symbol on a clean white background. Decrease background illustrations Red sphere with downward arrow icon. A glossy red sphere with a white downward pointing arrow symbol on a clean white background
Free with trial Set of Candlestick chart with banknote on white background. For currency exchange rate concept. Decrease background vectors Set of Candlestick chart with banknote on white background.For currency exchange rate concept
Free with trial Colorful bar graph chart depicted with crayons. Set against a rustic wooden background, implying decline or financial loss. Perfect for business, economics, and data visualization concepts. Decrease background illustrations Falling Bar Graph with Crayons Good Resolution Stock Photo. Colorful bar graph chart depicted with crayons. Set against a rustic wooden background, implying. Colorful bar graph chart depicted with crayons. Set against a rustic wooden background, implying decline or financial loss. Perfect for business, economics, and data visualization concepts.
Free with trial A bold, red arrow with a zig-zag pattern points downwards, symbolizing a decline or negative trend. The arrow is rendered in a 3D style with subtle shading, giving it depth. It is isolated on a transparent background, making it versatile for various design applications. This graphic is ideal for representing financial losses, market downturns, declining performance, or any concept associated with a downward trajectory. Decrease background illustrations Red Downward Trend Arrow. A bold, red arrow with a zig-zag pattern points downwards, symbolizing a decline or negative trend. The arrow is rendered in a 3D style. A bold, red arrow with a zig-zag pattern points downwards, symbolizing a decline or negative trend. The arrow is rendered in a 3D style with subtle shading, giving it depth. It is isolated on a transparent background, making it versatile for various design applications. This graphic is ideal for representing financial losses, market downturns, declining performance, or any concept associated with a downward trajectory.
Free with trial Percentage symbol combined with rotating curved arrow representing rate change concept. On white background. Decrease background vectors Percentage symbol combined with rotating curved arrow representing rate change concept. On white background
Free with trial The image shows a stock market crash represented by a downward-sloping line graph against a backdrop of a galaxy filled with stars and nebulous clouds. the line graph, rendered in a light purple hue, indicates a significant decline, culminating in a sharp drop represented by an arrow pointing downwards. the background galaxy adds a dramatic and symbolic layer, suggesting a cosmic scale of economic downturn. Decrease background illustrations Stock market crash in a galaxy background. The image shows a stock market crash represented by a downward-sloping line graph against a backdrop of a galaxy. the image shows a stock market crash represented by a downward-sloping line graph against a backdrop of a galaxy filled with stars and nebulous clouds. the line graph, rendered in a light purple hue, indicates a significant decline, culminating in a sharp drop represented by an arrow pointing downwards. the background galaxy adds a dramatic and symbolic layer, suggesting a cosmic scale of economic downturn.
Free with trial Coin cryptocurrency Tron and skeletonon a background chart. Decrease background illustrations Coin cryptocurrency TRX and skeletonon a background chart. Coin cryptocurrency Tron and skeletonon a background chart. Coin cryptocurrency Tron and skeletonon a background chart.
 Sign in