Free with trial Business growth and decline icon in black circle. Up and down trend chart symbol illustration. Increase and decrease bar graph concept. Decrease bar chart icon set vectors Business growth and decline icon in black circle. Up and down trend chart symbol. Increase and decrease bar graph concept
Free with trial Decrease vector icon on the white background. EPS 10. Decrease bar chart icon set vectors Decrease thin line vector icon set. Decrease vector icon on the white background. EPS 10
Free with trial Decrease vector icon on the white background. EPS 10. Decrease bar chart icon set vectors Decrease thin line vector icon set. Decrease vector icon on the white background. EPS 10
Free with trial Up and down arrow on bar chart icon set. Growth and decline graph symbol illustration. Financial trend concept. Decrease bar chart icon set vectors Up and down arrow on bar chart icon set. Growth and decline graph symbol. Financial trend concept
Free with trial Bar Chart With Arrows Line And Solid Icon Set. Financial Growth And Decline Trend Analysis Symbol Collection. Economic Performance Indicators. Isolated Vector Illustration. Decrease bar chart icon set vectors Bar Chart With Arrows Line And Solid Icon Set. Financial Growth And Decline Trend Analysis Symbol Collection. Economic
Free with trial Declining Bar Chart With Downward Arrow Line And Solid Icon Set. Financial Loss, Economic Downturn, And Business Decline Symbol Collection. Risk Assessment. Isolated Vector Illustration. Decrease bar chart icon set vectors Declining Bar Chart With Downward Arrow Line And Solid Icon Set. Financial Loss, Economic Downturn, And Business Decline
Free with trial 3d Up and Down sign with red arrows vector collection. Design vector illustration concept of sales bar chart symbol icon set with arrow moving down and sales bar chart with arrow moving up. Decrease bar chart icon set vectors 3d Up and Down sign with red arrows vector collection. Design vector illustration concept of sales bar chart symbol icon set
Free with trial Graph going Up and Down sign with green and red arrows vector set. Flat design vector set of a concept of sales bar chart symbol icon with arrow moving down and sales bar chart with arrow moving up. Decrease bar chart icon set vectors Graph going Up and Down sign with green and red arrows vector set. Vector set of a concept of sales bar chart symbol icon. Graph going Up and Down sign with green and red arrows vector set. Flat design vector set of a concept of sales bar chart symbol icon with arrow moving down and sales bar chart with arrow moving up.
Free with trial Trend chart icon set. Growth and decline symbol. Up and down arrow with bar graph illustration. Decrease bar chart icon set vectors Trend chart icon set. Growth and decline symbol. Up and down arrow with bar graph
Free with trial Business chart icon set with graph, statistic, line and bar diagram for finance or analysis. Pie graphics with horizontal and donut layout for data growth. Vector report for trend or economy by pictogram scheme. Decrease bar chart icon set vectors Business chart icon set with graph, statistic, line and bar diagram for finance or analysis. Pie graphics with
Free with trial Bar Chart Growth And Decline Line And Solid Icon Set. Financial Performance, Economic Trends, Business Analysis Symbol Collection. Data Visualization And Market Trends. Isolated Vector Illustration. Decrease bar chart icon set vectors Bar Chart Growth And Decline Line And Solid Icon Set. Financial Performance, Economic Trends, Business Analysis Symbol
Free with trial Business growth and decline icon in circular outline. Up and down trend chart symbol illustration. Increase and decrease bar graph concept. Decrease bar chart icon set vectors Business growth and decline icon in circular outline. Up and down trend chart symbol. Increase and decrease bar graph concept
Free with trial Bar Chart With Arrows Line And Solid Icon Set. Data Analysis, Trend Indication, Business Performance Tracking Symbols. Visual Representation Of Growth And Decline. Isolated Vector Illustration. Decrease bar chart icon set vectors Bar Chart With Arrows Line And Solid Icon Set. Data Analysis, Trend Indication, Business Performance Tracking Symbols
Free with trial A black and white circular icon depicting a bar chart with three bars of decreasing height. A diagonal arrow points downwards from the tallest bar to the shortest, indicating a downward trend or decline. The icon is set against a white background. Decrease bar chart icon set illustrations Black and White Icon of a Downward Trending Bar Chart in a Circle graph decrease. A black and white circular icon depicting a bar chart with three bars of decreasing height. A diagonal arrow points downwards from the tallest bar to the shortest, indicating a downward trend or decline. The icon is set against a white background
Free with trial Loss Bar Chart Icon vector set collection for web vector set collection for app ui. Decrease bar chart icon set vectors Loss Bar Chart Icon vector set collection for web
Free with trial Graph going Up and Down sign with green and red arrows vector set. Flat design vector set of a concept of sales bar chart symbol icon with arrow moving down and sales bar chart with arrow moving up. Decrease bar chart icon set vectors Graph going Up and Down sign with green and red arrows vector set. Flat design vector set of a concept of sales bar chart arrows. Graph going Up and Down sign with green and red arrows vector set. Flat design vector set of a concept of sales bar chart symbol icon with arrow moving down and sales bar chart with arrow moving up.
Free with trial Up and Down sign with green and red arrows set vector illustration. Set of a Concept of sales bar chart symbol icon with arrow moving down and sales bar chart with arrow moving up. Decrease bar chart icon set vectors Up and Down sign with green and red arrows set vector illustration. Set of a Concept of sales bar chart symbol icon with arrows. Up and Down sign with green and red arrows set vector illustration. Set of a Concept of sales bar chart symbol icon with arrow moving down and sales bar chart with arrow moving up.
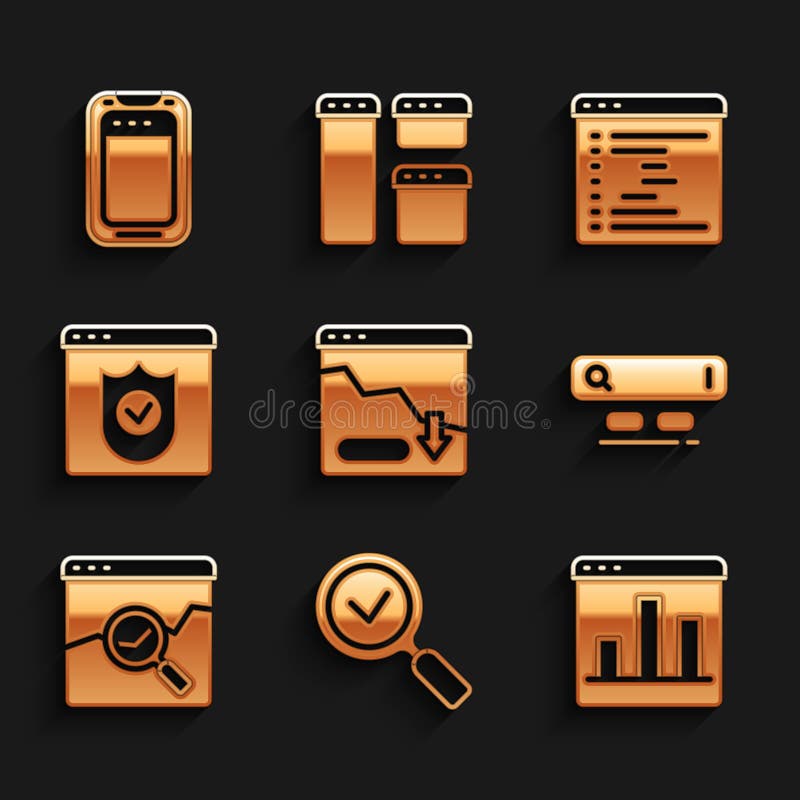
Free with trial Set Financial growth decrease Magnifying glass with check mark Graph chart infographic Search engine Website stocks market Browser shield window and Mobile phone icon. Vector. Decrease bar chart icon set illustrations Set Financial growth decrease, Magnifying glass with check mark, Graph chart infographic, Search engine, Website stocks. Set Financial growth decrease Magnifying glass with check mark Graph chart infographic Search engine Website stocks market Browser shield window and Mobile phone icon. Vector.
Free with trial A modern flat design graphic set featuring two icons: opposing arrows indicating increase decrease and a bar chart showing financial growth or decline, perfect for business concepts. Decrease bar chart icon set vectors Increase and decrease arrows with bar chart icon. A modern flat design graphic set featuring two icons: opposing arrows indicating increase decrease and a bar chart showing financial growth or decline, perfect for business concepts
Free with trial Percentage Decrease Bar Chart Icons for Financial Reports and Analytics. Vol 34492. Decrease bar chart icon set vectors Percentage Decrease Bar Chart Icons for Financial Reports and Analytics. Vol 34492
Free with trial Basic charts line icon set. Bar diagram, pie and histogram graph. Data visualization, growth and distribution analysis for business and finance. Vector illustration Editable Stroke. Decrease bar chart icon set illustrations Basic charts line icon set. Bar diagram, pie and histogram graph. Data visualization, growth and distribution analysis
Free with trial A minimalist, black and white vector icon representing a bar chart or graph. The icon features a series of vertical bars of varying heights, set against a base of horizontal lines. This clean and modern design is ideal for representing data, statistics, progress, growth, or financial information in digital and print media. Its simple aesthetic makes it versatile for use in presentations, websites, apps, and infographics. Decrease bar chart icon set vectors Abstract Bar Chart Icon. A minimalist, black and white vector icon representing a bar chart or graph. The icon features a series of vertical bars of varying heights, set against a base of horizontal lines. This clean and modern design is ideal for representing data, statistics, progress, growth, or financial information in digital and print media. Its simple aesthetic makes it versatile for use in presentations, websites, apps, and infographics.
Free with trial Set of 16 black and white graph icons in a 4x4 grid. Each icon depicts variations of bar charts with upward and downward arrows, suggesting growth or decline. Some include additional elements like magnifying glasses, checkmarks, and data points connected by lines. Icons vary slightly in design, representing different data trends with simple, bold lines on a white background, ideal for business and statistical representation. Decrease bar chart icon set vectors Graph icon set. Increase and decrease graph icon. Growth icon. Graph chart icons. Icon set. 16 icons. Set of 16 black and white graph icons in a 4x4 grid. Each icon depicts variations of bar charts with upward and downward arrows, suggesting growth or decline. Some include additional elements like magnifying glasses, checkmarks, and data points connected by lines. Icons vary slightly in design, representing different data trends with simple, bold lines on a white background, ideal for business and statistical representation.
Free with trial A black icon depicting a bar graph with three bars of decreasing height, representing a downward trend. A black arrow points diagonally downwards from the top right, indicating a decline. The icon is enclosed within a black circle and set against a white background. Decrease bar chart icon set illustrations Black Downward Trend Bar Graph Icon with Arrow Inside Circle chart decrease. A black icon depicting a bar graph with three bars of decreasing height, representing a downward trend. A black arrow points diagonally downwards from the top right, indicating a decline. The icon is enclosed within a black circle and set against a white background
Free with trial Graph and Chart icon set. Containing data, increase, growth, pie chart, data analytics, business and more. Vector graph icon set. Decrease bar chart icon set vectors Graph and Chart icon set. Containing data, increase, growth, pie chart, data analytics, business and more.
Free with trial Line art bar graph icon set featuring upward and downward trend arrows for business analysis. Decrease bar chart icon set vectors Line art bar graph icon set featuring upward and downward trend arrows for business analysis
Free with trial Reduction chart icon set depicting data reduction symbols, ideal for business analytics and performance visuals. Decrease bar chart icon set vectors Reduction chart icon set depicting data reduction symbols.Vector illustration. Reduction chart icon set depicting data reduction symbols, ideal for business analytics and performance visuals
Free with trial Reduction chart icon Vector symbol or sign set collection in black and white outline. Decrease bar chart icon set vectors Decline Chart Icon Illustrating Decrease in Performance, Economic Downturn, and Analytical Data. Reduction chart icon Vector symbol or sign set collection in black and white outline
Free with trial Chat arrow down icon Vector set on white background. EPS 10. Decrease bar chart icon set vectors Chart arrow down icon set. decline downward chart vector symbol. stock trend downturn graph sign. negative economy bar Chart. Chat arrow down icon Vector set on white background. EPS 10
Free with trial Chat arrow down icon Vector set on white background. EPS 10. Decrease bar chart icon set vectors Chart arrow down icon set. decline downward chart vector symbol. stock trend downturn graph sign. negative economy bar Chart. Chat arrow down icon Vector set on white background. EPS 10
Free with trial Chat arrow down icon Vector set on white background. EPS 10. Decrease bar chart icon set vectors Chart arrow down icon set. decline downward chart vector symbol. stock trend downturn graph sign. negative economy bar Chart. Chat arrow down icon Vector set on white background. EPS 10
Free with trial Statistics icon set, bar diagram illustration, business graph logo icon vector. Decrease bar chart icon set vectors Statistics icon set, bar diagram illustration, business graph logo icon vector
Free with trial Diagram icons set in outline stroke design for web. Pack line pictograms with growth bar chart, pie data, datum, marketing, analyzing finance, flow, infographic, statistic, other. Vector illustration. Decrease bar chart icon set vectors Diagram icons set in outline stroke design for web. Pack line pictograms with growth bar chart, pie data, datum
Free with trial Trend chart icon in circular outline. Growth and decline symbol. Up and down arrow with bar graph illustration. Decrease bar chart icon set vectors Trend chart icon in circular outline. Growth and decline symbol. Up and down arrow with bar graph
Free with trial Trend chart icon in black circle. Growth and decline symbol. Up and down arrow with bar graph illustration. Decrease bar chart icon set vectors Trend chart icon in black circle. Growth and decline symbol. Up and down arrow with bar graph
Free with trial Falling bar chart icons set with downward arrow �\' decline, loss and recession analytics �\' black business vector. Decrease bar chart icon set vectors . Falling bar chart icons set with downward arrow �' decline, loss and recession analytics black business vector
Free with trial Reduction chart icon Black line art vector in black and white outline set collection sign. Decrease bar chart icon set vectors Decline Chart Icon Illustrating Decrease in Performance, Economic Downturn, and Analytical Data. Reduction chart icon Black line art vector in black and white outline set collection sign
Free with trial Financial Loss, Economic Downturn, And Business Decline Symbol Collection. Declining Bar Chart With Downward Arrow Line And Solid Icon Set. Market Analysis. Isolated Vector Illustration. Decrease bar chart icon set vectors Financial Loss, Economic Downturn, And Business Decline Symbol Collection. Declining Bar Chart With Downward Arrow Line
Free with trial Set line Website with stocks market Financial growth decrease Browser window and Cloud technology data transfer icon. Vector. Decrease bar chart icon set illustrations Set line Website with stocks market, Financial growth decrease, Browser window and Cloud technology data transfer icon
Free with trial Chat arrow down icon Vector set on white background. EPS 10. Decrease bar chart icon set vectors Chart arrow down icon set. decline downward chart vector symbol. stock trend downturn graph sign. negative economy bar Chart. Chat arrow down icon Vector set on white background. EPS 10
Free with trial Chat arrow down icon Vector set on white background. EPS 10. Decrease bar chart icon set vectors Chart arrow down icon set. decline downward chart vector symbol. stock trend downturn graph sign. negative economy bar Chart. Chat arrow down icon Vector set on white background. EPS 10
Free with trial Chat arrow down icon Vector set on white background. EPS 10. Decrease bar chart icon set vectors Chart arrow down icon set. decline downward chart vector symbol. stock trend downturn graph sign. negative economy bar Chart. Chat arrow down icon Vector set on white background. EPS 10
Free with trial Chat arrow down icon Vector set on white background. EPS 10. Decrease bar chart icon set vectors Chart arrow down icon set. decline downward chart vector symbol. stock trend downturn graph sign. negative economy bar Chart. Chat arrow down icon Vector set on white background. EPS 10
Free with trial This image displays a set of stylized bar chart icons representing financial and business trends. The leftmost icon features green bars increasing in height, accompanied by a green upward-pointing arrow, symbolizing growth and success. The middle icon shows red bars decreasing in height, with a black downward-pointing arrow indicating decline and loss. The right side presents two smaller black and white bar charts, also depicting downward trends. These icons are ideal for illustrating concepts like profit, loss, market trends, economic performance, and data analysis. Decrease bar chart icon set illustrations Growth and Decline Bar Chart Icons. This image displays a set of stylized bar chart icons representing financial and business trends. The leftmost icon features green bars increasing in height, accompanied by a green upward-pointing arrow, symbolizing growth and success. The middle icon shows red bars decreasing in height, with a black downward-pointing arrow indicating decline and loss. The right side presents two smaller black and white bar charts, also depicting downward trends. These icons are ideal for illustrating concepts like profit, loss, market trends, economic performance, and data analysis.
Free with trial A stylized, flat design illustration of a bar chart depicting a downward trend. The bars are colored red, yellow, and blue, arranged in decreasing height from left to right. A prominent red arrow points downwards across the chart, emphasizing the decline. The graphic is set against a clean white background, making it ideal for presentations, reports, and financial concepts related to loss, decrease, or negative performance. Decrease bar chart icon set illustrations Declining Bar Chart with Downward Arrow. A stylized, flat design illustration of a bar chart depicting a downward trend. The bars are colored red, yellow, and blue, arranged in decreasing height from left to right. A prominent red arrow points downwards across the chart, emphasizing the decline. The graphic is set against a clean white background, making it ideal for presentations, reports, and financial concepts related to loss, decrease, or negative performance.
Free with trial Business Chart and Graph Set with Line, Bar, and Pie Icons for Data Analysis or Statistics in Reports and Research. Vector. Editable stroke. Decrease bar chart icon set vectors Business Chart and Graph Set with Line, Bar, and Pie Icons for Data Analysis or Statistics in Reports and Research
Free with trial A comprehensive collection of hand-drawn business and data visualization icons. This doodle-style set features a variety of essential elements, including different types of arrows, bar graphs, line charts, and pie charts. The sketchy, black and white illustrations are perfect for infographics, presentations, financial reports, and marketing materials. Each icon is isolated on a white background, representing concepts like growth, statistics, process flow, and direction. This versatile vector set is ideal for adding a creative, hand-made touch to any project related to analytics, finance, or strategy. Decrease bar chart icon set illustrations Hand Drawn Business and Finance Doodle Icon Set. A comprehensive collection of hand-drawn business and data visualization icons. This doodle-style set features a variety of essential elements, including different types of arrows, bar graphs, line charts, and pie charts. The sketchy, black and white illustrations are perfect for infographics, presentations, financial reports, and marketing materials. Each icon is isolated on a white background, representing concepts like growth, statistics, process flow, and direction. This versatile vector set is ideal for adding a creative, hand-made touch to any project related to analytics, finance, or strategy.
Free with trial A versatile collection of flat vector icons illustrating concepts of decline, decrease, and loss. This set features various graphics, including downward-pointing arrows, negative trend line graphs, and falling bar charts in multiple colors. These symbols are perfect for representing financial crisis, economic recession, stock market crash, business failure, or any form of reduction. Ideal for use in infographics, presentations, financial reports, websites, and data visualization projects, these modern icons effectively communicate negative trends and downturns. Isolated on a white background for easy integration into any design. Decrease bar chart icon set illustrations Financial Decline and Recession Vector Icon Set. A versatile collection of flat vector icons illustrating concepts of decline, decrease, and loss. This set features various graphics, including downward-pointing arrows, negative trend line graphs, and falling bar charts in multiple colors. These symbols are perfect for representing financial crisis, economic recession, stock market crash, business failure, or any form of reduction. Ideal for use in infographics, presentations, financial reports, websites, and data visualization projects, these modern icons effectively communicate negative trends and downturns. Isolated on a white background for easy integration into any design.
Free with trial A flat, high-contrast, black-and-white icon depicting a bar graph with a downward-pointing arrow. The bars represent a data set that is shrinking or declining over time, with the final arrow emphasizing a negative or losing trend in business or financial metrics. Decrease bar chart icon set vectors A minimalist black and white icon showing a downward bar chart indicating a significant loss trend. A flat, high-contrast, black-and-white icon depicting a bar graph with a downward-pointing arrow. The bars represent a data set that is shrinking or declining over time, with the final arrow emphasizing a negative or losing trend in business or financial metrics
Free with trial Decrease vector icon on the white background. EPS 10. Decrease bar chart icon set vectors Decrease thin line vector icon set. Decrease vector icon on the white background. EPS 10
Free with trial Decrease vector icon on the white background. EPS 10. Decrease bar chart icon set vectors Decrease thin line vector icon set. Decrease vector icon on the white background. EPS 10
Free with trial Decrease vector icon on the white background. EPS 10. Decrease bar chart icon set vectors Decrease thin line vector icon set. Decrease vector icon on the white background. EPS 10
Free with trial Decrease vector icon on the white background. EPS 10. Decrease bar chart icon set vectors Decrease thin line vector icon set. Decrease vector icon on the white background. EPS 10
Free with trial Decrease vector icon on the white background. EPS 10. Decrease bar chart icon set vectors Decrease thin line vector icon set. Decrease vector icon on the white background. EPS 10
Free with trial Decrease vector icon on the white background. EPS 10. Decrease bar chart icon set vectors Decrease thin line vector icon set. Decrease vector icon on the white background. EPS 10
Free with trial Decrease vector icon on the white background. EPS 10. Decrease bar chart icon set vectors Decrease thin line vector icon set. Decrease vector icon on the white background. EPS 10
Free with trial Decrease vector icon on the white background. EPS 10. Decrease bar chart icon set vectors Decrease thin line vector icon set. Decrease vector icon on the white background. EPS 10
Free with trial Up and Down sign with green and red arrows isolated on a blue background vector illustration. Concept of sales bar chart symbol icon with arrow moving down and sales bar chart with arrow moving up. Decrease bar chart icon set vectors Up and Down sign with green and red arrows vector illustration. Concept of sales bar chart symbol icon with arrows. Up and Down sign with green and red arrows isolated on a blue background vector illustration. Concept of sales bar chart symbol icon with arrow moving down and sales bar chart with arrow moving up.
Free with trial Up and Down sign with green and red arrows vector illustration. Concept of sales bar chart symbol icon with arrow moving down and sales bar chart with arrow moving up. Decrease bar chart icon set vectors Up and Down sign with green and red arrows vector illustration. Concept of sales bar chart symbol icon with arrows. Up and Down sign with green and red arrows vector illustration. Concept of sales bar chart symbol icon with arrow moving down and sales bar chart with arrow moving up.
Free with trial Up and Down sign with green and red arrows vector illustration. Concept of sales bar chart symbol icon with arrow moving down and sales bar chart with arrow moving up. Decrease bar chart icon set vectors Up and Down sign with green and red arrows vector illustration. Concept of sales bar chart symbol icon with arrows. Up and Down sign with green and red arrows vector illustration. Concept of sales bar chart symbol icon with arrow moving down and sales bar chart with arrow moving up.
Free with trial Up and Down sign with green and red arrows vector illustration. Concept of sales bar chart symbol icon with arrow moving down and sales bar chart with arrow moving up. Decrease bar chart icon set vectors Up and Down sign with green and red arrows vector illustration. Concept of sales bar chart symbol icon with arrows. Up and Down sign with green and red arrows vector illustration. Concept of sales bar chart symbol icon with arrow moving down and sales bar chart with arrow moving up.
Free with trial A versatile set of business and finance icons isolated on a white background. This collection features various data visualization elements, including bar charts, line graphs, pie charts, and diagrams. The clean, vector style represents concepts like statistical analysis, market growth, financial reporting, and economic trends. These infographic elements are perfect for presentations, business reports, websites, and marketing materials to illustrate progress, performance, and data-driven insights. Decrease bar chart icon set vectors Business and Finance Chart and Graph Icon Set. A versatile set of business and finance icons isolated on a white background. This collection features various data visualization elements, including bar charts, line graphs, pie charts, and diagrams. The clean, vector style represents concepts like statistical analysis, market growth, financial reporting, and economic trends. These infographic elements are perfect for presentations, business reports, websites, and marketing materials to illustrate progress, performance, and data-driven insights.
Free with trial A clean, minimalist bar chart illustration set against a solid green background. The chart features three white vertical bars of different heights, representing data points or progress over time. A simple white grid and axes are visible, indicating a clear visual representation of statistics. This versatile graphic is ideal for conveying concepts of business growth, financial analysis, market trends, statistical reporting, or educational content in a modern, easy-to-understand format. Perfect for presentations, infographics, websites, and applications. Decrease bar chart icon set vectors Minimalist Bar Chart Icon on Green Background. A clean, minimalist bar chart illustration set against a solid green background. The chart features three white vertical bars of different heights, representing data points or progress over time. A simple white grid and axes are visible, indicating a clear visual representation of statistics. This versatile graphic is ideal for conveying concepts of business growth, financial analysis, market trends, statistical reporting, or educational content in a modern, easy-to-understand format. Perfect for presentations, infographics, websites, and applications.
Free with trial Decrease vector icon on the white background. EPS 10. Decrease bar chart icon set vectors Decrease thin line vector icon set. Decrease vector icon on the white background. EPS 10
Free with trial Decrease vector icon on the white background. EPS 10. Decrease bar chart icon set vectors Decrease thin line vector icon set. Decrease vector icon on the white background. EPS 10
Free with trial Decrease vector icon on the white background. EPS 10. Decrease bar chart icon set vectors Decrease thin line vector icon set. Decrease vector icon on the white background. EPS 10
Free with trial Decrease vector icon on the white background. EPS 10. Decrease bar chart icon set vectors Decrease thin line vector icon set. Decrease vector icon on the white background. EPS 10
Free with trial Decrease vector icon on the white background. EPS 10. Decrease bar chart icon set vectors Decrease thin line vector icon set. Decrease vector icon on the white background. EPS 10
Free with trial Decrease vector icon on the white background. EPS 10. Decrease bar chart icon set vectors Decrease thin line vector icon set. Decrease vector icon on the white background. EPS 10
Free with trial Decrease vector icon on the white background. EPS 10. Decrease bar chart icon set vectors Decrease thin line vector icon set. Decrease vector icon on the white background. EPS 10
Free with trial Decrease vector icon on the white background. EPS 10. Decrease bar chart icon set vectors Decrease thin line vector icon set. Decrease vector icon on the white background. EPS 10
Free with trial Decrease vector icon on the white background. EPS 10. Decrease bar chart icon set vectors Decrease thin line vector icon set. Decrease vector icon on the white background. EPS 10
Free with trial Decrease vector icon on the white background. EPS 10. Decrease bar chart icon set vectors Decrease thin line vector icon set. Decrease vector icon on the white background. EPS 10
Free with trial Decrease vector icon on the white background. EPS 10. Decrease bar chart icon set vectors Decrease thin line vector icon set. Decrease vector icon on the white background. EPS 10
Free with trial Decrease vector icon on the white background. EPS 10. Decrease bar chart icon set vectors Decrease thin line vector icon set. Decrease vector icon on the white background. EPS 10