Free with trial Crypto Trading Data Visualization vector Candlestick Chart concept colored icon or symbol. Decrease bar vectors Crypto Trading Data Visualization vector Candlestick Chart colored icon or symbol
Free with trial Stock Market Crash Illustration with Decreasing Graph Going Down. decreasing graph and arrow on red background. Decrease bar vectors Stock Market Crash Illustration with Decreasing Graph Going Down
Free with trial Line icon of a flip chart showing decreasing bars, suggesting a negative trend during a business presentation. Decrease bar vectors Flip chart showing decreasing bars graphic for business presentation. Line icon of a flip chart showing decreasing bars, suggesting a negative trend during a business presentation
Free with trial A graph with a red arrow pointing upward. The graph is orange and blue. The graph is a representation of a trend or growth. Decrease bar vectors A graph with a red arrow pointing upward
Free with trial Collection of red infographic elements including charts, graphs, diagrams and icons. Perfect for presentations, reports, and data visualization. Clean, modern design. Decrease bar illustrations Red Infographic Elements
Free with trial Web report line icon. Neumorphic, Red gradient, 3d pin buttons. Column graph sign. Growth diagram symbol. Line icons. Neumorphic buttons with outline signs. Vector. Decrease bar illustrations Web report line icon. Column graph sign. Line icons. Vector. Web report line icon. Neumorphic, Red gradient, 3d pin buttons. Column graph sign. Growth diagram symbol. Line icons. Neumorphic buttons with outline signs. Vector
Free with trial Economics Financial Loss Analytics chart vector illustration. Decrease bar vectors Economics Financial Loss Analytics chart
Free with trial Crypto Trading Data Visualization vector Candlestick Chart concept colored seamless pattern. Decrease bar vectors Crypto Trading Data Visualization vector Candlestick Chart colored seamless pattern
Free with trial Orange Downward Arrow With Gradient Effect. Decrease bar vectors Orange Downward Arrow With Gradient Effect
Free with trial A clean and modern vector illustration of a percentage sign, featuring two pale yellow circles with maroon outlines and a light blue diagonal bar also outlined in maroon. This simple graphic is set against a crisp white background, making it versatile for various design projects. It effectively conveys concepts of discounts, sales, financial rates, statistics, and promotions. Ideal for use in business presentations, marketing materials, educational content, websites, and mobile applications to highlight numerical data or special offers. Decrease bar vectors Percentage Sign Vector Icon Illustration. A clean and modern vector illustration of a percentage sign, featuring two pale yellow circles with maroon outlines and a light blue diagonal bar also outlined in maroon. This simple graphic is set against a crisp white background, making it versatile for various design projects. It effectively conveys concepts of discounts, sales, financial rates, statistics, and promotions. Ideal for use in business presentations, marketing materials, educational content, websites, and mobile applications to highlight numerical data or special offers.
Free with trial Downward Trend Financial Graph Illustration. Decrease bar vectors Downward Trend Financial Graph Illustration
Free with trial 3D icon featuring a golden bear and a descending red arrow above blue bars, symbolizing a bearish trend in financial markets. Decrease bar vectors Bear Market Graph with Downward Trend 3D Icon. 3D icon featuring a golden bear and a descending red arrow above blue bars, symbolizing a bearish trend in financial markets
Free with trial Wooden blocks with arrow up and down on Balance scale of percentage icon. Business planning for target achievement. Measure of performance for a specific objective. 3d render. Decrease bar illustrations Wooden blocks with arrow up and down on Balance scale of percentage icon
Free with trial Business graph is being drawn on a piece of paper with a pencil. Decrease bar illustrations Pencil drawing business graph on paper with pie chart. Business graph is being drawn on a piece of paper with a pencil
Free with trial Statistic Up icon outline collection or set in black and white. Decrease bar vectors Statistic Up icon Line Art Logo set. Statistic Up icon outline collection or set in black and white
Free with trial Stacked gold bars with fluctuating market graph in background. Generative AI. Decrease bar illustrations Stacked gold bars with fluctuating market graph in background
Free with trial Bitcoin chart icons set outline vector. Benefit fintech. Cash coin thin line color flat on white. Decrease bar vectors Bitcoin chart icons set vector color line. Bitcoin chart icons set outline vector. Benefit fintech. Cash coin thin line color flat on white
Free with trial Close-up of various financial charts and graphs displayed on a dark screen, with blue and orange color schemes. Image. Decrease bar illustrations Financial Data Charts and Graphs on Screen. Close-up of various financial charts and graphs displayed on a dark screen, with blue and orange color schemes. Image
Free with trial A conceptual 3D illustration depicting a white growth arrow on a collapsing bar chart. The crumbling blocks and debris symbolize a dramatic failure or downturn. This powerful metaphor represents concepts such as financial crisis, economic recession, stock market crash, business bankruptcy, or unsustainable growth built on a fragile foundation. The minimalist gray background focuses attention on the central theme of collapse and risk, making it ideal for financial reports, business presentations, and articles about economic instability. Decrease bar illustrations Economic Crisis and Crumbling Growth Chart. A conceptual 3D illustration depicting a white growth arrow on a collapsing bar chart. The crumbling blocks and debris symbolize a dramatic failure or downturn. This powerful metaphor represents concepts such as financial crisis, economic recession, stock market crash, business bankruptcy, or unsustainable growth built on a fragile foundation. The minimalist gray background focuses attention on the central theme of collapse and risk, making it ideal for financial reports, business presentations, and articles about economic instability.
Free with trial Online Candlestick Chart vector Professional Financial Trading concept colored seamless pattern. Decrease bar vectors Online Candlestick Chart vector Professional Financial Trading colored seamless pattern
Free with trial Nickel bars with red downward arrow. 3D rendering isolated on white background. Decrease bar illustrations Nickel bars with red downward arrow. 3D rendering
Free with trial Decreasing graph line icon. Neumorphic, Green gradient, 3d pin buttons. Column chart sign. Crisis diagram symbol. Line icons. Neumorphic buttons with outline signs. Vector. Decrease bar illustrations Decreasing graph line icon. Crisis chart sign. Line icons. Vector. Decreasing graph line icon. Neumorphic, Green gradient, 3d pin buttons. Column chart sign. Crisis diagram symbol. Line icons. Neumorphic buttons with outline signs. Vector
Free with trial Magnifier with Candlestick Chart vector Successful Stock Market Investing concept icon or symbol. Decrease bar vectors Magnifier with Candlestick Chart vector Successful Stock Market Investing icon or symbol
Free with trial Stock Market Data Visualization vector Cryptocurrency Candlestick Chart concept seamless pattern. Decrease bar vectors Stock Market Data Visualization vector Cryptocurrency Candlestick Chart seamless pattern
Free with trial Report statistics line icon. Neumorphic, Green gradient, 3d pin buttons. Column graph sign. Growth diagram symbol. Line icons. Neumorphic buttons with outline signs. Vector. Decrease bar vectors Report statistics line icon. Column graph sign. Line icons. Vector. Report statistics line icon. Neumorphic, Green gradient, 3d pin buttons. Column graph sign. Growth diagram symbol. Line icons. Neumorphic buttons with outline signs. Vector
Free with trial Business data visualization with various charts white background. Decrease bar illustrations Business data visualization with various charts
Free with trial A turquoise moon hovers above a stock market graph with rising and falling arrows indicating market trends, useful for illustrating financial concepts. Decrease bar illustrations Stock Market Graph with Moon and Arrow Trends. A turquoise moon hovers above a stock market graph with rising and falling arrows indicating market trends, useful for illustrating financial concepts
Free with trial A hand-drawn illustration depicting a presentation on data trends. A stick figure presenter, holding a microphone, points to a chart on a screen labeled "DATA TRENDS. " The chart displays a line graph and bar graphs, suggesting growth and analysis. This image is suitable for illustrating business concepts, data analysis, presentations, and financial reports. It conveys a sense of information, communication, and progress. Decrease bar vectors Data Presentation: Business Trends and Analysis. A hand-drawn illustration depicting a presentation on data trends. A stick figure presenter, holding a microphone, points to a chart on a screen labeled "DATA TRENDS." The chart displays a line graph and bar graphs, suggesting growth and analysis. This image is suitable for illustrating business concepts, data analysis, presentations, and financial reports. It conveys a sense of information, communication, and progress.
Free with trial A modern 3D rendered abstract illustration featuring a prominent light blue downward-pointing arrow as its base. On top, a geometric structure is composed of a rectangular block, two stylized bar chart-like elements, and a central dark grey multifaceted polyhedron. Set against a clean white background, this graphic symbolizes concepts like data analysis, business trends, financial decline, foundational structures, or urban development. Its minimalist and digital aesthetic makes it suitable for technology, finance, and corporate presentations, infographics, and web design. Decrease bar vectors Abstract 3D Data Structure with Downward Arrow. A modern 3D rendered abstract illustration featuring a prominent light blue downward-pointing arrow as its base. On top, a geometric structure is composed of a rectangular block, two stylized bar chart-like elements, and a central dark grey multifaceted polyhedron. Set against a clean white background, this graphic symbolizes concepts like data analysis, business trends, financial decline, foundational structures, or urban development. Its minimalist and digital aesthetic makes it suitable for technology, finance, and corporate presentations, infographics, and web design.
Free with trial Red and Green Candlestick Chart vector Crypto Trading and Price Action concept colored seamless pattern. Decrease bar vectors Red and Green Candlestick Chart vector Crypto Trading and Price Action colored seamless pattern
Free with trial Digital graph showing significant drop in stock prices. Background includes various financial data and email icons, indicating a business or financial context. Decrease bar illustrations Digital graph showing significant drop in stock prices
Free with trial A stack of coins with a green arrow pointing down. The coins are stacked on top of each other, with the bottom coin being the largest. Concept of decline or decrease, as the arrow points downward. Decrease bar illustrations A stack of coins with a green arrow pointing down
Free with trial Stock Market Data Visualization vector Cryptocurrency Candlestick Chart concept icon or logo element. Decrease bar vectors Stock Market Data Visualization vector Cryptocurrency Candlestick Chart icon or logo element
Free with trial Business growth presentation with charts and graphs showing progress, statistics, and performance. The image showcases key financial indicators in a clear, concise format. Decrease bar vectors Financial Data Analysis Report on Screen Display. Business growth presentation with charts and graphs showing progress, statistics, and performance. The image showcases key financial indicators in a clear, concise format.
Free with trial Online Candlestick Chart vector Professional Financial Trading concept colored icon or design element. Decrease bar vectors Online Candlestick Chart vector Professional Financial Trading colored icon or design element
Free with trial Abstract 3D rendering of a golden bar graph, depicting data fluctuations Represents growth and market trends. Decrease bar illustrations Golden Data Visualization. AI Generated. Abstract 3D rendering of a golden bar graph, depicting data fluctuations Represents growth and market trends
Free with trial Three line graphs, data visualization, chart comparison. Decrease bar vectors Three line graphs, data visualization, chart comparison
Free with trial Business graphic chart line, round and candlestick graph trend with glassmorphism effect. Transparent blur glass on gradient arrow vector set. Financial diagram on black. Marketing analytics. Decrease bar illustrations Business graphic chart line round and candlestick graph trend with glassmorphism effect vector set, arrows on black. Business graphic chart line, round and candlestick graph trend with glassmorphism effect. Transparent blur glass on gradient arrow vector set. Financial diagram on black. Marketing analytics
Free with trial A minimalist 3D render featuring two soft, pastel-colored arrows, one light blue and one pink, intersecting over a pale purple bar. The arrangement visually suggests a percentage symbol. The objects are rendered with smooth, rounded edges and a subtle sheen, set against a clean white background. This graphic is ideal for representing concepts like discounts, sales, growth, decline, comparison, or financial metrics in a modern and appealing way. Decrease bar vectors 3D Arrows Intersecting with Percentage Symbol Shape. A minimalist 3D render featuring two soft, pastel-colored arrows, one light blue and one pink, intersecting over a pale purple bar. The arrangement visually suggests a percentage symbol. The objects are rendered with smooth, rounded edges and a subtle sheen, set against a clean white background. This graphic is ideal for representing concepts like discounts, sales, growth, decline, comparison, or financial metrics in a modern and appealing way.
Free with trial A girl stands confidently, pointing at a finance chart displayed on a large screen. Her expression is focused and determined, highlighting key trends and data that drive her presentation. Decrease bar illustrations The girl is pointing at the finance chart. A girl stands confidently, pointing at a finance chart displayed on a large screen. Her expression is focused and determined, highlighting key trends and data that drive her presentation.
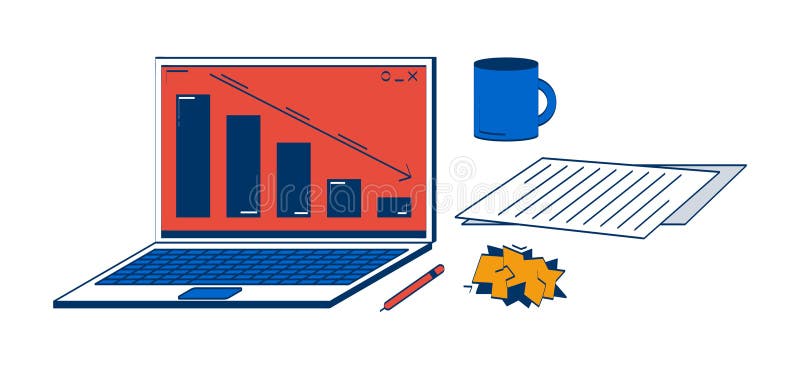
Free with trial Laptop with declining graph and office supplies 2D doodle objects set. Downward bar chart, mug cartoon elements flat vector cliparts isolated on white background. Hand drawn illustrations collection. Decrease bar vectors Laptop with declining graph and office supplies 2D doodle objects set
Free with trial A row of wooden figures, each with a spherical top and a rectangular or cylindrical base, are arranged in descending order of height from left to right. The figures vary in color, starting with a deep red, followed by orange, yellow, green, and then several shades of brown and natural wood. The background is a muted, textured beige. Decrease bar illustrations Wooden figures arranged in descending height order. A row of wooden figures, each with a spherical top and a rectangular or cylindrical base, are arranged in descending order of height from left to right. The figures vary in color, starting with a deep red, followed by orange, yellow, green, and then several shades of brown and natural wood. The background is a muted, textured beige
Free with trial A 3D icon featuring a dark square base with a gold border. On the base are four vertical bars of varying heights, colored in shades of beige and gold. A red zigzag line representing a downward trend is positioned above the bars, with its peak resting on the tallest bar and its subsequent segments descending. The icon is isolated on a clean white background. Decrease bar illustrations Downward financial trend graph icon chart business. A 3D icon featuring a dark square base with a gold border. On the base are four vertical bars of varying heights, colored in shades of beige and gold. A red zigzag line representing a downward trend is positioned above the bars, with its peak resting on the tallest bar and its subsequent segments descending. The icon is isolated on a clean white background
Free with trial Red and Green Candlestick Chart vector Crypto Trading and Price Action concept colored icon or logo element. Decrease bar vectors Red and Green Candlestick Chart vector Crypto Trading and Price Action colored icon or logo element
Free with trial Silver bullion broken showing economic recession and market crash. Silver bullion broken with a red down arrow symbolizing financial crisis and falling markets. Decrease bar illustrations Silver bullion broken showing economic recession and market crash. Silver bullion broken with a red down arrow symbolizing financial crisis and falling markets
Free with trial Falling Performance Shown in 3D Business Data Chart - 3D chart displays a decline in business performance, highlighting negative growth. Decrease bar illustrations Falling Performance Shown in 3D Business Data Chart
Free with trial This vector icon set features graph diagrams with arrows indicating growth and decline. The icons represent business metrics and financial performance, with arrows pointing upward for growth and downward for decline. These symbols are ideal for visualizing trends, success, and changes in finance reports or business charts. The clean, simple design ensures clarity, making these icons suitable for use in presentations, reports, or dashboards to effectively communicate financial or business performance. Decrease bar vectors Growing up and down vector icon set. Graph diagram with arrow. Business growth success chart. Finance report symbol. This vector icon set features graph diagrams with arrows indicating growth and decline. The icons represent business metrics and financial performance, with arrows pointing upward for growth and downward for decline. These symbols are ideal for visualizing trends, success, and changes in finance reports or business charts. The clean, simple design ensures clarity, making these icons suitable for use in presentations, reports, or dashboards to effectively communicate financial or business performance.
Free with trial Economy crisis icon Vector symbol or sign set collection in black and white outline. Decrease bar vectors Economy crisis flat line icon set. Economy crisis Thin line illustration vector. Economy crisis icon Vector symbol or sign set collection in black and white outline
Free with trial Elephant and increase diagram illustration design vector, Elephants are herbivorous animals that have wide ears and a trunk. Decrease bar vectors Elephant and increase diagram illustration design vector
Free with trial A futuristic concept of financial trading and data analysis. A glowing holographic stock market chart, with candlesticks and graphs, is projected onto a modern office desk. The scene includes a laptop and coffee, set against a large window with a blurry night city skyline. This image represents concepts like fintech, investment, big data, economic growth, and innovative business technology. Ideal for illustrating topics on digital finance, stock exchange, forex trading, and corporate strategy in a high-tech world. Decrease bar illustrations Futuristic Financial Trading Hologram on Office Desk. A futuristic concept of financial trading and data analysis. A glowing holographic stock market chart, with candlesticks and graphs, is projected onto a modern office desk. The scene includes a laptop and coffee, set against a large window with a blurry night city skyline. This image represents concepts like fintech, investment, big data, economic growth, and innovative business technology. Ideal for illustrating topics on digital finance, stock exchange, forex trading, and corporate strategy in a high-tech world.
Free with trial A cheerful cartoon businessman in a suit stands proudly beside a rising bar graph, illustrating positive financial growth and business success. Decrease bar illustrations Smiling Businessman Presenting Financial Growth Chart. A cheerful cartoon businessman in a suit stands proudly beside a rising bar graph, illustrating positive financial growth and business success.
Free with trial A vibrant 3D representation of a business graph and chart, showcasing data analysis and financial trends with colorful bars and a dynamic line, isolated on a clean white background. Decrease bar illustrations 3d graph and chart icons isolated on white background. A vibrant 3D representation of a business graph and chart, showcasing data analysis and financial trends with colorful bars and a dynamic line, isolated on a clean white background
Free with trial Checklist line icon. Continuous line with 3d star. Graph chart sign. Growth diagram symbol. 3d star in speech bubble. Checklist single line ribbon. Loop curve pattern. Vector. Decrease bar vectors Checklist line icon. Graph chart sign. Continuous line with 3d star. Vector. Checklist line icon. Continuous line with 3d star. Graph chart sign. Growth diagram symbol. 3d star in speech bubble. Checklist single line ribbon. Loop curve pattern. Vector
Free with trial This 3D graphic depicts a sharp market downturn, visualized with a red arrow plummeting downwards along a gridded bar chart. The image is generated by AI, offering a compelling visual representation of economic decline and financial loss. It showcases the potential for significant drops in various. Decrease bar illustrations AI-Generated Market Decline Visualization. This 3D graphic depicts a sharp market downturn, visualized with a red arrow plummeting downwards along a gridded bar chart. The image is generated by AI, offering a compelling visual representation of economic decline and financial loss. It showcases the potential for significant drops in various
Free with trial A red background with red lines on it. The red lines are in different sizes and are arranged in a way that creates a sense of movement. The image conveys a feeling of energy and excitement. Decrease bar vectors A red background with red lines on it
Free with trial A stylized chart with bars and a line graph is displayed in a soft speech bubble against a simple background great for business or infographic presentations. Decrease bar illustrations Analyzing Data Chart in Speech Bubble for Presentation. A stylized chart with bars and a line graph is displayed in a soft speech bubble against a simple background great for business or infographic presentations
Free with trial Collection of thirty charts and graphs icons in line style. Decrease bar vectors Collection of thirty charts and graphs icons in line style
Free with trial Arrow trend-down icon vector set on white background. EPS 10. Decrease bar vectors Arrow trend-down icon
Free with trial Arrow trend-down icon. Decrease bar vectors Arrow trend-down vector icon set in black and white outlines. Arrow trend-down icon
Free with trial 3d cylinder chart showing downward trend. Business and finance decline vector illustration. Decrease bar vectors 3d cylinder chart showing downward trend. Business and finance decline illustration
Free with trial A detailed financial chart is presented with numerous vertical bars and multiple overlapping line graphs in blue, white, and orange. Red and green arrows indicate downward and upward movements, respectively, with specific numerical data points displayed. The overall trend shows fluctuations but a general upward trajectory towards the right. Decrease bar illustrations Detailed Financial Chart with Upward and Downward Trends. A detailed financial chart is presented with numerous vertical bars and multiple overlapping line graphs in blue, white, and orange. Red and green arrows indicate downward and upward movements, respectively, with specific numerical data points displayed. The overall trend shows fluctuations but a general upward trajectory towards the right
Free with trial Statistics line icon. Neumorphic, Blue gradient, 3d pin buttons. Column chart sign. Growth graph diagram symbol. Line icons. Neumorphic buttons with outline signs. Vector. Decrease bar illustrations Statistics line icon. Column graph chart sign. Line icons. Vector. Statistics line icon. Neumorphic, Blue gradient, 3d pin buttons. Column chart sign. Growth graph diagram symbol. Line icons. Neumorphic buttons with outline signs. Vector
Free with trial Statistics line icon. Neumorphic, Blue gradient, 3d pin buttons. Column chart sign. Growth graph diagram symbol. Line icons. Neumorphic buttons with outline signs. Vector. Decrease bar vectors Statistics line icon. Column graph chart sign. Line icons. Vector. Statistics line icon. Neumorphic, Blue gradient, 3d pin buttons. Column chart sign. Growth graph diagram symbol. Line icons. Neumorphic buttons with outline signs. Vector
Free with trial A vibrant graphic illustrating alphabetical order from Z to A, featuring the letters 'Z' and 'A' in blue with a dashed line connecting them, alongside a long green arrow pointing downwards, transitioning from light to dark green rectangles. This content was created using AI technology, symbolizing sorting or a reverse progression. Decrease bar vectors Alphabetical Order Z to A with Descending Green Arrow Icon. A vibrant graphic illustrating alphabetical order from Z to A, featuring the letters 'Z' and 'A' in blue with a dashed line connecting them, alongside a long green arrow pointing downwards, transitioning from light to dark green rectangles. This content was created using AI technology, symbolizing sorting or a reverse progression.
Free with trial An illustration depicts a downturn in business. Decreasing bar chart represented in blue, yellow and red. A black arrow points downwards showing negative growth, placed over a bright white background. Decrease bar illustrations Falling Chart with a Decreasing Arrow on a White Background. An illustration depicts a downturn in business. Decreasing bar chart represented in blue, yellow and red. A black arrow points downwards showing negative growth, placed over a bright white background.
Free with trial Infographic, chart icon with arrow. Vector illustration. EPS 10. Stock image. Decrease bar vectors Infographic, chart icon with arrow. Vector illustration. EPS 10.
Free with trial Data analytics icons set in duotone outline stroke design for web. Pack pictograms of search, mining, filter, pie chart, presentation, mind map, database, discover, flow, other. Vector illustration. Decrease bar illustrations Data analytics icons set in duotone outline stroke design for web. Pack pictograms of search, mining, filter, pie chart
Free with trial Report timer line icon. Halftone dotted pattern. Gradient icon with grain shadow. Column graph sign. Growth diagram chart symbol. Line report timer icon. Various designs. Vector. Decrease bar vectors Report timer line icon. Column graph sign. Halftone dotted pattern. Vector. Report timer line icon. Halftone dotted pattern. Gradient icon with grain shadow. Column graph sign. Growth diagram chart symbol. Line report timer icon. Various designs. Vector
Free with trial Report document line icon. Continuous line big heart. Column graph sign. Growth diagram, pie chart symbol. 3d hearts in heart shaped loop. Report document single line ribbon. Vector. Decrease bar vectors Report document line icon. Column graph sign. Continuous line big heart. Vector. Report document line icon. Continuous line big heart. Column graph sign. Growth diagram, pie chart symbol. 3d hearts in heart shaped loop. Report document single line ribbon. Vector
Free with trial Domino Effect icon vector image. Suitable for mobile application web application and print media. Decrease bar vectors Domino Effect icon vector image.
Free with trial Presentation board line icon. Neumorphic, Purple gradient, 3d pin buttons. Column graph sign. Growth diagram symbol. Line icons. Neumorphic buttons with outline signs. Vector. Decrease bar illustrations Presentation board line icon. Column graph sign. Line icons. Vector. Presentation board line icon. Neumorphic, Purple gradient, 3d pin buttons. Column graph sign. Growth diagram symbol. Line icons. Neumorphic buttons with outline signs. Vector
Free with trial Presentation board line icon. Neumorphic, Purple gradient, 3d pin buttons. Column graph sign. Growth diagram symbol. Line icons. Neumorphic buttons with outline signs. Vector. Decrease bar illustrations Presentation board line icon. Column graph sign. Line icons. Vector. Presentation board line icon. Neumorphic, Purple gradient, 3d pin buttons. Column graph sign. Growth diagram symbol. Line icons. Neumorphic buttons with outline signs. Vector
Free with trial An abstract and futuristic digital visualization of financial data, featuring glowing blue bar charts and candlestick patterns reflecting on a sleek, dark surface. The dynamic composition, set against a deep blue background with subtle grid lines, evokes concepts of technology, business growth, and market analysis. Ideal for illustrating topics related to stock market trends, investment strategies, economic reports, big data analytics, and the future of finance in a modern, high-tech context. Decrease bar illustrations Futuristic Digital Finance Chart with Glowing Blue Data Bars. An abstract and futuristic digital visualization of financial data, featuring glowing blue bar charts and candlestick patterns reflecting on a sleek, dark surface. The dynamic composition, set against a deep blue background with subtle grid lines, evokes concepts of technology, business growth, and market analysis. Ideal for illustrating topics related to stock market trends, investment strategies, economic reports, big data analytics, and the future of finance in a modern, high-tech context.
Free with trial Analytics graph line icon. Halftone dotted pattern. Gradient icon with grain shadow. Column chart sign. Growth diagram symbol. Line analytics graph icon. Various designs. Vector. Decrease bar vectors Analytics graph line icon. Column chart sign. Halftone dotted pattern. Vector. Analytics graph line icon. Halftone dotted pattern. Gradient icon with grain shadow. Column chart sign. Growth diagram symbol. Line analytics graph icon. Various designs. Vector
Free with trial A hand manipulates a red arrow pointing downwards, superimposed on a bar graph, illustrating a market downturn. This image, generated by AI, symbolizes economic recession, financial crisis, or business failure, showcasing the impact of negative trends. Decrease bar illustrations Declining Market Trend. A hand manipulates a red arrow pointing downwards, superimposed on a bar graph, illustrating a market downturn. This image, generated by AI, symbolizes economic recession, financial crisis, or business failure, showcasing the impact of negative trends.
Free with trial Presentation board line icon. Continuous line with share plane. Column graph sign. Growth diagram symbol. 3d star in speech bubble. Presentation board single line ribbon. Loop curve pattern. Vector. Decrease bar vectors Presentation board line icon. Column graph sign. Continuous line with plane. Vector. Presentation board line icon. Continuous line with share plane. Column graph sign. Growth diagram symbol. 3d star in speech bubble. Presentation board single line ribbon. Loop curve pattern. Vector
Free with trial This image shows colorful financial charts and graphs, generated by AI, illustrating various data points and percentages. The overlaid arrows suggest a downward trend, potentially indicating a negative market shift or economic decline. The visual representation aids in quick understanding of compl. Decrease bar illustrations Financial Data Analysis. This image shows colorful financial charts and graphs, generated by AI, illustrating various data points and percentages. The overlaid arrows suggest a downward trend, potentially indicating a negative market shift or economic decline. The visual representation aids in quick understanding of compl
Free with trial Illustrated graphic showing downward trend with shrinking beans. Decrease bar vectors Illustrated graphic showing downward trend with shrinking beans
Free with trial Bitcoin chart icons set outline vector. Benefit fintech. Cash coin neon color on black. Decrease bar vectors Bitcoin chart icons set vector neon. Bitcoin chart icons set outline vector. Benefit fintech. Cash coin neon color on black
Free with trial Report statistics line icon. Halftone dotted pattern. Gradient icon with grain shadow. Column graph sign. Growth diagram symbol. Line report statistics icon. Various designs. Vector. Decrease bar vectors Report statistics line icon. Column graph sign. Halftone dotted pattern. Vector. Report statistics line icon. Halftone dotted pattern. Gradient icon with grain shadow. Column graph sign. Growth diagram symbol. Line report statistics icon. Various designs. Vector