Free with trial 3d man analyzing bar chart, a visual representation of growth, business performance, and investment strategy ,Generative ai. Decrease business chart diagram illustrations 3d man analyzing bar chart, a visual representation of growth, business performance, and investment strategy
Free with trial Declining bar chart with downward trend line, showing decrease and financial loss. Decrease business chart diagram vectors Declining bar chart with downward trend line, showing decrease and financial loss
Free with trial Falling Sales: Declining Chart with Tag, Downward Trend Arrow and Business Graph Concept. Decrease business chart diagram vectors Falling Sales: Declining Chart with Tag, Downward Trend Arrow and Business Graph Concept
Free with trial A flat icon of a bar chart with a downward arrow and a dollar symbol, representing financial loss, market decline, decreased revenue, negative performance, economic downturns, and investment risks in business environments. Decrease business chart diagram vectors Declining financial chart icon with downward arrow showing loss decrease and negative dollar trend. A flat icon of a bar chart with a downward arrow and a dollar symbol, representing financial loss, market decline, decreased revenue, negative performance, economic downturns, and investment risks in business environments.
Free with trial Communication concept infographic process diagram with human head with quote sign inside with decrease horizontal direction with dark background bright outline style 3 points vector. Decrease business chart diagram illustrations Communication concept infographic process diagram with human head with quote sign inside with decrease horizontal direction with
Free with trial Set line Glass money jar with coin, Drop crude oil price, Dollar rate decrease and Global economic crisis. Business infographic template. Vector. Decrease business chart diagram illustrations Set line Glass money jar with coin, Drop crude oil price, Dollar rate decrease and Global economic crisis. Business
Free with trial Colorful pie chart is showing positive statistics and business growth, target and financial analysis and marketing report, data with copy space. Decrease business chart diagram illustrations Colorful pie chart is showing positive statistics and business growth, target and financial analysis and marketing
Free with trial Decreasing Bar Chart with Arrow: Economic Decline Visualization, Business Graph, Financial Performance Overview, Downward Trend Graphic. Decrease business chart diagram vectors Decreasing Bar Chart with Arrow: Economic Decline Visualization, Business Graph, Financial Performance Overview, Downward Trend
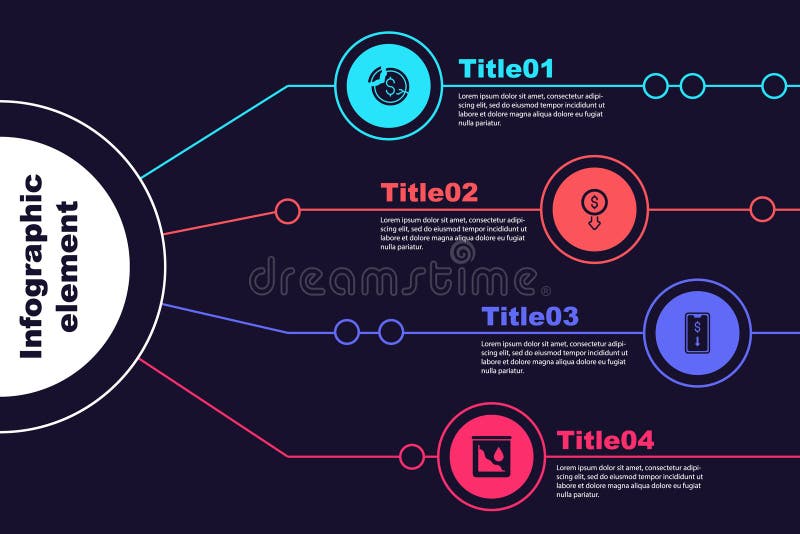
Free with trial Set Dollar rate decrease, , Mobile stock trading and Drop crude oil price. Business infographic template. Vector. Decrease business chart diagram illustrations Set Dollar rate decrease, , Mobile stock trading and Drop crude oil price. Business infographic template. Vector
Free with trial Man in blue shirt analyzing colorful bar chart, business performance review and data analysis,Generative AI. Decrease business chart diagram illustrations Man in blue shirt analyzing colorful bar chart, business performance review and data analysis
Free with trial Sad businesswoman on stock index chart falling and investor finance loss banner. Stressed business woman on exchange market trading decreasing data fall down graph. Bankruptcy concept. Eps. Decrease business chart diagram vectors Sad businesswoman on stock index chart falling and investor finance loss banner. Stressed business woman on exchange
Free with trial Stock market trading technical analysis bar chart fall banner. Business failure candlestick graph exchange down trend. Economic downturn and investment loss graph. Trader financial index crash. Eps. Decrease business chart diagram vectors Stock market trading technical analysis bar chart fall banner. Business failure candlestick graph exchange down trend
Free with trial Sad businessman trader on stock index chart falling and investor finance loss banner concept. Stressed business man broker on exchange market trading decreasing data fall down graph. Economic crash. Decrease business chart diagram vectors Sad businessman trader on stock index chart falling and investor finance loss banner concept. Stressed business man
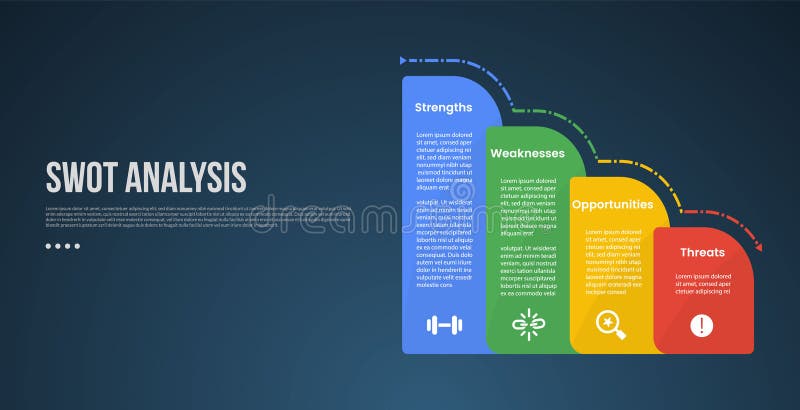
Free with trial SWOT business analysis infographic template with round vertical box container gradually decrease on right column with dark background style. Decrease business chart diagram illustrations SWOT business analysis infographic template with round vertical box container gradually decrease on right column with dark
Free with trial Businessman are sit down on a business graph. Chart in the fall. Business falling down. Negative trend. Crisis impact. economy going down. vector, illustration. Decrease business chart diagram illustrations Businessman are sit down on a business graph. Chart in the fall. Business falling down. Negative trend. Crisis impact. economy
Free with trial Set Mind map infographic, Pie chart, Cloud download and upload and Financial growth decrease icon. Vector. Decrease business chart diagram vectors Set Mind map infographic, Pie chart, Cloud download and upload and Financial growth decrease icon. Vector
Free with trial A vibrant 3D bar chart icon isolated on a clean white background. This minimalist data visualization features five colorful bars in a soft, pastel palette of yellow, pink, and purple, arranged in descending order. The clean, modern render is perfect for illustrating concepts like business statistics, financial reports, market analysis, and performance metrics. An ideal graphic element for presentations, infographics, websites, and educational materials, symbolizing data, comparison, and analytics in a visually appealing way. 3D illustration. Decrease business chart diagram illustrations 3D Colorful Bar Chart for Business and Data Analysis. A vibrant 3D bar chart icon isolated on a clean white background. This minimalist data visualization features five colorful bars in a soft, pastel palette of yellow, pink, and purple, arranged in descending order. The clean, modern render is perfect for illustrating concepts like business statistics, financial reports, market analysis, and performance metrics. An ideal graphic element for presentations, infographics, websites, and educational materials, symbolizing data, comparison, and analytics in a visually appealing way. 3D illustration.
Free with trial Set Isometric Contract money and pen, Pie chart infographic, Mobile stock trading and Dollar rate decrease icon. Vector. Decrease business chart diagram illustrations Set Isometric Contract money and pen, Pie chart infographic, Mobile stock trading and Dollar rate decrease icon. Vector
Free with trial Set Mind map infographic Pie chart Server Folder and lock Sales funnel with Financial growth decrease Data analysis and icon. Vector. Decrease business chart diagram vectors Set Mind map infographic, Pie chart, Server, Folder and lock, Sales funnel with, Financial growth decrease, Data. Set Mind map infographic Pie chart Server Folder and lock Sales funnel with Financial growth decrease Data analysis and icon. Vector.
Free with trial Set Binary code Pie chart infographic Data analysis Coal mine trolley Financial growth decrease and Browser with stocks market icon. Vector. Decrease business chart diagram illustrations Set Binary code, Pie chart infographic, Data analysis, Coal mine trolley, Financial growth decrease, and Browser with. Set Binary code Pie chart infographic Data analysis Coal mine trolley Financial growth decrease and Browser with stocks market icon. Vector.
Free with trial The image shows a neon-style graph illustrating a business downturn. the graph features an orange line depicting a downward trend, punctuated by blue vertical lines that may represent key milestones or events. the background is dark, emphasizing the neon glow of the graph elements. the graph suggests a decline in business performance, with the orange line representing a decrease in value or profit over time. Decrease business chart diagram illustrations Business downturn neon chart illustration. the image shows a neon-style graph illustrating a business downturn. the graph features an orange line depicting a downward trend, punctuated by blue vertical lines that may represent key milestones or events. the background is dark, emphasizing the neon glow of the graph elements. the graph suggests a decline in business performance, with the orange line representing a decrease in value or profit over time.
Free with trial A vector icon depicting a line chart with a downward trend. Represents decline, decrease, negative trend, or falling statistics. Useful for finance apps, business reports, stock market monitoring, or visualizing negative data changes, vector design Generative AI. Decrease business chart diagram vectors Decreasing Line Chart Icon Vector Illustration, vector design Generative AI. A vector icon depicting a line chart with a downward trend. Represents decline, decrease, negative trend, or falling statistics. Useful for finance apps, business reports, stock market monitoring, or visualizing negative data changes, vector design Generative AI
Free with trial Statistics icon set, bar diagram illustration, business graph logo icon vector. Decrease business chart diagram vectors Statistics icon set, bar diagram illustration, business graph logo icon vector
Free with trial A hand-drawn illustration of a business chart showing a significant decline. Decrease business chart diagram vectors HandDrawn Business Decline Chart Illustration. A hand-drawn illustration of a business chart showing a significant decline
Free with trial Set line Data analysis Search data Financial growth decrease Server security with padlock Pie chart infographic and icon. Vector. Decrease business chart diagram vectors Set line Data analysis, Search data, Financial growth decrease, Server security with padlock, Pie chart infographic, and
Free with trial Diagram icons set in outline stroke design for web. Pack line pictograms with growth bar chart, pie data, datum, marketing, analyzing finance, flow, infographic, statistic, other. Vector illustration. Decrease business chart diagram vectors Diagram icons set in outline stroke design for web. Pack line pictograms with growth bar chart, pie data, datum
Free with trial A collection of financial chart icons, showcasing data analysis and business growth concepts. The image features multiple variations of a line graph and bar chart combination, presented in both grayscale and beige color schemes. These icons are ideal for illustrating financial reports, business presentations, market trends, and data visualization projects. The clean, modern design makes them suitable for a wide range of applications. Decrease business chart diagram vectors Financial Chart Icons: Business and Data Analysis. A collection of financial chart icons, showcasing data analysis and business growth concepts. The image features multiple variations of a line graph and bar chart combination, presented in both grayscale and beige color schemes. These icons are ideal for illustrating financial reports, business presentations, market trends, and data visualization projects. The clean, modern design makes them suitable for a wide range of applications.
Free with trial Businessman stick figure character in suit standing front of downward trend graph chart. concerned situation. Business failure, crisis, bankruptcy, down negative arrow. hand drawn doodle illustration. Decrease business chart diagram vectors Businessman stick figure character in suit standing front of downward trend graph chart. concerned situation. Business failure
Free with trial A stark vector illustration of a bar chart showing a sharp decrease, indicated by a downward-pointing red arrow. This icon effectively represents economic downturns, financial losses, declining trends, or negative performance metrics. Ideal for business reports, financial analysis, or news graphics, vector design Generative AI. Decrease business chart diagram vectors . A stark vector illustration of a bar chart showing a sharp decrease, indicated by a downward-pointing red arrow. This icon effectively represents economic downturns, financial losses, declining trends, or negative performance metrics. Ideal for business reports, financial analysis, or news graphics, vector design Generative AI
Free with trial A clean and simple vector illustration of a bar chart isolated on a white background. This minimalist graphic features three vertical bars in varying shades of blue, representing data, statistics, or progress. Ideal for business reports, financial presentations, infographics, websites, and educational materials. The flat design symbolizes concepts like growth, analysis, market research, and performance comparison, offering a modern and clear way to visualize information. Ample copy space is available. Decrease business chart diagram illustrations Simple Blue Bar Chart Vector Icon for Business Data. A clean and simple vector illustration of a bar chart isolated on a white background. This minimalist graphic features three vertical bars in varying shades of blue, representing data, statistics, or progress. Ideal for business reports, financial presentations, infographics, websites, and educational materials. The flat design symbolizes concepts like growth, analysis, market research, and performance comparison, offering a modern and clear way to visualize information. Ample copy space is available.
Free with trial This vector icon set features graph diagrams with arrows indicating growth and decline. The icons represent business metrics and financial performance, with arrows pointing upward for growth and downward for decline. These symbols are ideal for visualizing trends, success, and changes in finance reports or business charts. The clean, simple design ensures clarity, making these icons suitable for use in presentations, reports, or dashboards to effectively communicate financial or business performance. Decrease business chart diagram vectors Growing up and down vector icon set. Graph diagram with arrow. Business growth success chart. Finance report symbol. This vector icon set features graph diagrams with arrows indicating growth and decline. The icons represent business metrics and financial performance, with arrows pointing upward for growth and downward for decline. These symbols are ideal for visualizing trends, success, and changes in finance reports or business charts. The clean, simple design ensures clarity, making these icons suitable for use in presentations, reports, or dashboards to effectively communicate financial or business performance.
Free with trial Up and down curved arrow chart icon. Business trend bar symbol illustration. Decrease business chart diagram vectors Up and down curved arrow chart icon. Business trend bar symbol
Free with trial Down Trend Line Outline Arrow Pointing Downward Decrease Profits Sales Market Business Finance Black White Icon Sign Symbol Vector Illustration Artwork. Decrease business chart diagram vectors Down Trend Line Outline Arrow Pointing Downward Decrease Profits Sales Market Business Finance Black White Icon
Free with trial A vector illustration showing a magnifying glass focused on a bar graph and line chart indicating growth. The magnifying glass has a blue frame and red handle. The chart depicts an upward trend, suggesting positive business performance. This image is suitable for illustrating data analysis, business strategy, market research, and financial growth concepts. Decrease business chart diagram vectors Analyzing Growth: Magnifying Glass on Business Chart. A vector illustration showing a magnifying glass focused on a bar graph and line chart indicating growth. The magnifying glass has a blue frame and red handle. The chart depicts an upward trend, suggesting positive business performance. This image is suitable for illustrating data analysis, business strategy, market research, and financial growth concepts.
Free with trial 3d cylinder chart showing downward trend. Business and finance decline vector illustration. Decrease business chart diagram vectors 3d cylinder chart showing downward trend. Business and finance decline illustration
Free with trial Increase and decrease solid icon set, Arrow Growth icon, and statistic symbol set. Business growth icon, increase, personal development, graph, and chart-related line vector. Decrease business chart diagram vectors Increase and decrease solid icon set, Arrow Growth icon, and statistic symbol set
Free with trial A simple outline icon illustration of a bar chart diagram, used to display data analysis and performance metrics. Ideal for presentations, infographics, and dashboards. Decrease business chart diagram vectors Outline Simple Bar Chart Diagram Icon Graphic for Data Analysis. A simple outline icon illustration of a bar chart diagram, used to display data analysis and performance metrics. Ideal for presentations, infographics, and dashboards.
Free with trial Financial concept image featuring a blue bar chart with a red downward arrow, illustrating decline, recession, or loss over time. Ideal for presentations, reports, infographics, economic forecasts, and business documentation. Clean, clear, and professional visual, created ai. Decrease business chart diagram illustrations Business bar chart showing financial decline with downward arrow. Financial concept image featuring a blue bar chart with a red downward arrow, illustrating decline, recession, or loss over time. Ideal for presentations, reports, infographics, economic forecasts, and business documentation. Clean, clear, and professional visual, created ai.
Free with trial A clear flat vector icon representing a bar chart with a downward-pointing red arrow, symbolizing decline, loss, or negative growth. This design is useful for financial reports, risk analysis, or any situation indicating a decrease in performance or value. It communicates challenges, vector design Generative AI. Decrease business chart diagram vectors Bar Chart Downtrend Icon, Decline, Loss, Negative Growth, Business, vector design Generative AI. A clear flat vector icon representing a bar chart with a downward-pointing red arrow, symbolizing decline, loss, or negative growth. This design is useful for financial reports, risk analysis, or any situation indicating a decrease in performance or value. It communicates challenges, vector design Generative AI
Free with trial Economy business crisis and graph investment down on red background. arrow trading chart candlestick fall. vector illustration fantastic technology. Decrease business chart diagram vectors Economy business crisis and graph investment down on red background. arrow trading chart candlestick fall.
Free with trial Decreasing bar chart diagram with down arrow showing negative growth. Decrease business chart diagram vectors Decreasing bar chart diagram with down arrow showing negative growth
Free with trial Handdrawn outline style decrease chart with exclamation mark attention icon. Symbol for warning and risk of losing the income. Decrease business chart diagram vectors Handdrawn Outline Decrease Chart with Exclamation Mark Attention Icon. Handdrawn outline style decrease chart with exclamation mark attention icon. Symbol for warning and risk of losing the income.
Free with trial Curved growth and decline chart icon in flat design. Business trend arrow symbol illustration. Decrease business chart diagram vectors Curved growth and decline chart icon in flat design. Business trend arrow symbol
Free with trial Decline bar chart with downward trend arrow outline icon. Decrease, loss, and financial drop symbol vector. Decrease business chart diagram vectors Decline bar chart with downward trend arrow outline icon. Decrease, loss, and financial drop symbol
Free with trial Growth and decline. Business chart icon. Profit loss symbol. Vector illustration. EPS 10. Decrease business chart diagram vectors Growth and decline. Business chart icon. Profit loss symbol. Vector illustration.
Free with trial Colorful isometric bar chart showing business data and growth with bars of different height, colored blue, yellow and green. Isolated on a transparent background, perfect for business presentations or infographics. Decrease business chart diagram vectors Colorful business chart illustration on transparent background AI Generated. Colorful isometric bar chart showing business data and growth with bars of different height, colored blue, yellow and green. Isolated on a transparent background, perfect for business presentations or infographics.
Free with trial Uptrend and downtrend business chart icon. Economic growth and decline symbol with green up and red down arrow vector. Decrease business chart diagram vectors Uptrend and downtrend business chart icon. Economic growth and decline symbol with green up and red down arrow
Free with trial Falling bar chart with a downward trending line and arrow indicating decrease. Decrease business chart diagram vectors Falling bar chart with a downward trending line and arrow indicating decrease
Free with trial Hand drawn bar chart illustration showing data statistics and business growth. Decrease business chart diagram vectors Hand drawn bar chart illustration showing data statistics and business growth
Free with trial A hand-drawn sketch of a business chart illustrating a significant decline, with a small, subtle sign of potential recovery at the far right. The chart is simply illustrated in black ink on a white background. Decrease business chart diagram illustrations Hand-drawn business chart showing decline followed by a very slight recovery. A hand-drawn sketch of a business chart illustrating a significant decline, with a small, subtle sign of potential recovery at the far right. The chart is simply illustrated in black ink on a white background
Free with trial Decline bar chart with downward trend arrow icon vector. Decrease, loss, and financial drop symbol on circle line. Decrease business chart diagram vectors Decline bar chart with downward trend arrow icon. Decrease, loss, and financial drop symbol on circle line
Free with trial Illustration of descending financial chart background for business presentations, Generated by AI. Decrease business chart diagram illustrations Illustration of descending financial chart background for business presentations
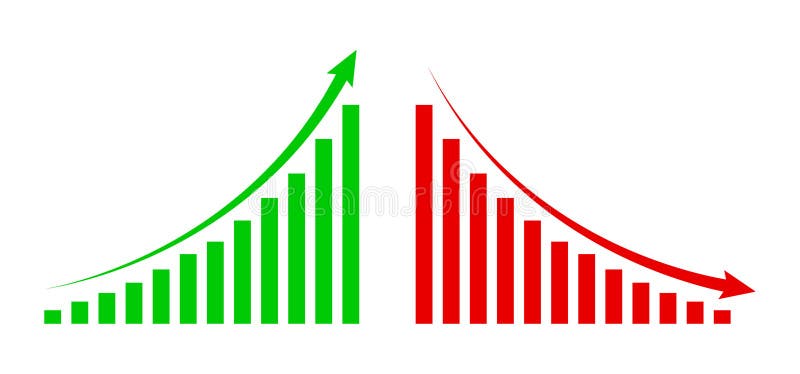
Free with trial Graph going up and down sign financial arrows. chart increase, decrease sign with green and red arrows. vector graph with green and red arrows. Decrease business chart diagram vectors Graph going up and down sign financial arrows. chart increase, decrease sign with green and red arrows. vector graph
Free with trial Decline bar chart with downward trend arrow icon vector. Decrease, loss, and financial crisis symbol in black circle. Decrease business chart diagram vectors Decline bar chart with downward trend arrow icon. Decrease, loss, and financial crisis symbol in black circle
Free with trial Descending Bar Chart and Downward Arrow Signifying Business Loss and Economic Downturn. Decrease business chart diagram vectors Descending Bar Chart and Downward Arrow Signifying Business Loss and Economic Downturn
Free with trial Downward trend bar chart with arrow showing financial economic decline loss decrease. Decrease business chart diagram vectors Downward trend bar chart with arrow showing financial economic decline loss decrease
Free with trial Blue arrow pointing downward on financial graph. Business chart showing descending trend. Digital stock market data visualization for decline analysis. Decrease business chart diagram illustrations Blue arrow pointing downward on financial graph. Business chart showing descending trend
Free with trial Happy and sad businessman from rising and falling chart. Business success and failure infographic. Man sitting at computer table. Office manager. Startup project growth. Stock exchange. Vector concept. Decrease business chart diagram vectors Happy and sad businessman from rising and falling chart. Business success and failure infographic. Man sitting at computer table
Free with trial Declining graph showing a financial or business downturn, with bar chart and arrow down. Decrease business chart diagram vectors Declining graph showing a financial or business downturn, with bar chart and arrow down
Free with trial 3D Pie chart icon. Circle divided into parts statistical diagram vector illustration. 3D render. Decrease business chart diagram vectors 3D Pie chart icon circle divided into parts statistical diagram vector illustration. 3D render.
Free with trial Bar chart graph. Colorful falling arrow. Financial data analysis. Vector business symbol. EPS 10. Decrease business chart diagram vectors Bar chart graph. Colorful falling arrow. Financial data analysis. Vector business symbol.
Free with trial Set line Financial growth decrease, Arrow, Pie chart infographic and Factory icon. Vector. Decrease business chart diagram illustrations Set line Financial growth decrease, Arrow, Pie chart infographic and Factory icon. Vector
Free with trial Red stock market investment decline chart. Downward arrow. Negative growth concept, business development, declining profits. Analytical financial chart. Trend. Changes in exchange rates, interest rates. Decrease business chart diagram vectors Red stock market investment decline chart. Downward arrow. Negative growth concept, business development, declining profits.
Free with trial Loss chart outline icon in white and black colors. loss chart flat vector icon from business collection for web, mobile apps and ui. Decrease business chart diagram vectors Loss chart outline icon in white and black colors. loss chart flat vector icon from business collection for web, mobile apps and
Free with trial Abstract Black White Up Down Arrows Growth Chart Business Infographic Design. Generative AI. Decrease business chart diagram illustrations Abstract Black White Up Down Arrows Growth Chart Business Infographic Design
Free with trial Outline bar chart icon vector with upward and downward trend arrow. Uptrend and downtrend business graph symbol in black circle. Decrease business chart diagram vectors Outline bar chart icon with upward and downward trend arrow. Uptrend and downtrend business graph symbol in black circle
Free with trial Hand-drawn line chart doodle is showing grid backdrop and axis over gradient background, copy space. Data visualization, infographics, analytics, diagram, business, educational, minimalistic. Decrease business chart diagram illustrations Hand-drawn line chart doodle is showing grid backdrop and axis over gradient background, copy space
Free with trial Financial Business Decline Chart illustrates economic recession, market downturn, or corporate loss. Hand-drawn orange downward trend on a dark blue chalkboard with white bar graph offers ample copy space. Perfect for financial reports, business presentations, news articles, and advertising campaigns. Decrease business chart diagram illustrations Financial Business Decline Chart Hand Drawing Downward Trend on Blue Background Copy Space. Financial Business Decline Chart illustrates economic recession, market downturn, or corporate loss. Hand-drawn orange downward trend on a dark blue chalkboard with white bar graph offers ample copy space. Perfect for financial reports, business presentations, news articles, and advertising campaigns.
Free with trial Up and down trend chart icon in black circle. Business growth and decline symbol illustration. Decrease business chart diagram vectors Up and down trend chart icon in black circle. Business growth and decline symbol
Free with trial 3d bar chart illustrating growth, analysis, and business progress with colorful visual representation of data ,Generative ai. Decrease business chart diagram illustrations 3d bar chart, visualizing growth, data analysis, and business progress for effective communication. 3d bar chart illustrating growth, analysis, and business progress with colorful visual representation of data ,Generative ai
Free with trial A detailed financial chart showing business data analysis and market trend with upward arrow sign. Decrease business chart diagram illustrations Financial chart business data analysis and market trend view isolated on transparent background. a detailed financial chart showing business data analysis and market trend with upward arrow sign
Free with trial Stock market trading technical analysis bar chart fall. Business candlestick graph exchange down trend. Crisis economy and investment loss graph. Trader financial index crash concept. Money losing eps. Decrease business chart diagram vectors Stock market trading technical analysis bar chart fall. Business candlestick graph exchange down trend. Crisis economy
Free with trial Hand Drawn Bar Graph Chart with Downward Trend Arrow Representing Economic Decline and Business Loss. Decrease business chart diagram vectors Hand Drawn Bar Graph Chart with Downward Trend Arrow Representing Economic Decline and Business Loss
Free with trial Set pop art Piggy bank, Dollar symbol, Financial growth decrease and Pie chart infographic icon. Vector. Decrease business chart diagram vectors Set pop art Piggy bank, Dollar symbol, Financial growth decrease and Pie chart infographic icon. Vector
Free with trial Bar chart with arrow pointing down, illustrating economic decline, business loss, or negative trend data. Decrease business chart diagram vectors Bar chart with arrow pointing down, illustrating economic decline, business loss, or negative trend data
Free with trial Declining bar graph illustrating business recession trend or financial downturn with line chart overlay. Decrease business chart diagram vectors Declining bar graph illustrating business recession trend or financial downturn with line chart overlay
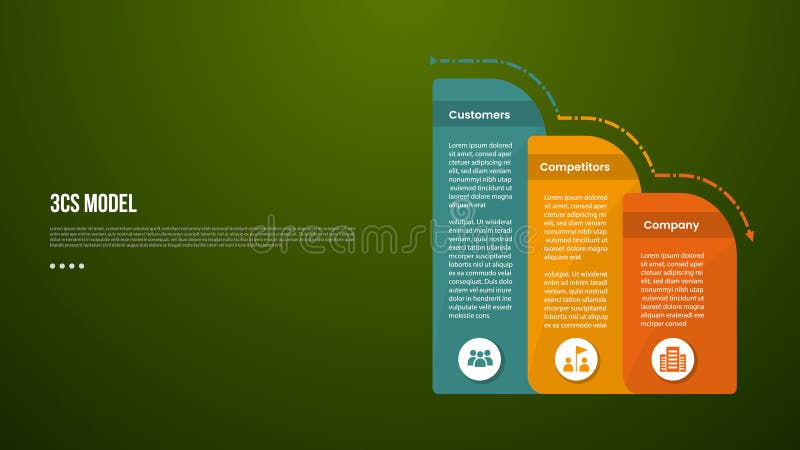
Free with trial 3C analysis business model infographic template with round box container decrease gradually with dark background style with 3 point for slide presentation vector. Decrease business chart diagram illustrations 3C analysis business model infographic template with round box container decrease gradually with dark background style with 3
Free with trial This image features six black bar chart icons with red and green arrows showing increase, decrease, and uncertainty trends. It is a clear, simple vector for business or data visuals, informative and clean. Generative AI. Decrease business chart diagram vectors Set of six vector bar chart icons with arrows indicating trends and question mark in black and colored design elements. This image features six black bar chart icons with red and green arrows showing increase, decrease, and uncertainty trends. It is a clear, simple vector for business or data visuals, informative and clean. Generative AI
Free with trial Set Isometric Gold bars, Shutdown of factory, Dollar rate decrease and Pie chart infographic icon. Vector. Decrease business chart diagram vectors Set Isometric Gold bars, Shutdown of factory, Dollar rate decrease and Pie chart infographic icon. Vector
Free with trial Set Pie chart infographic Financial growth decrease Arrow Shopping bag with Sale Percent up arrow Flag and icon. Vector. Decrease business chart diagram vectors Set Pie chart infographic, Financial growth decrease, Arrow, Shopping bag with Sale, Percent up arrow, Flag and icon. Set Pie chart infographic Financial growth. Set Pie chart infographic Financial growth decrease Arrow Shopping bag with Sale Percent up arrow Flag and icon. Vector.