Free with trial Lower costs purple concept icon. Strategy to decrease price for technology. Web 3 0 abstract idea thin line illustration. Isolated outline drawing. Editable stroke. Arial, Myriad Pro-Bold fonts used. Decrease business concept vectors Lower costs purple concept icon
Free with trial 25 Filled line Flat Color concept for Websites Mobile and Apps decrease, management, location, home, shopping Editable Vector Design Elements. Decrease business concept vectors Universal Icon Symbols Group of 25 Modern Filled line Flat Colors of decrease, management, location, home, shopping. 25 Filled line Flat Color concept for Websites Mobile and Apps decrease, management, location, home, shopping Editable Vector Design Elements
Free with trial Business graph up and down , paper art style. Decrease business concept vectors Business graph up and down, paper art style
Free with trial Stacked golden coins with falling red forex chart on dark texture. Crisis and recession concept. 3D Rendering. Decrease business concept illustrations Stacked coins with falling forex chart on texture. Crisis and recession concept. 3D Rendering
Free with trial A simple line graph illustration showing fluctuations and an upward trend. The graph is drawn on a grid with a black line and red data points, indicating a period of increase, followed by a decrease, and then a final increase. This image can be used to represent business trends, financial analysis, stock market data, or any data that shows changes over time. Decrease business concept vectors Line Graph with Fluctuations. A simple line graph illustration showing fluctuations and an upward trend. The graph is drawn on a grid with a black line and red data points, indicating a period of increase, followed by a decrease, and then a final increase. This image can be used to represent business trends, financial analysis, stock market data, or any data that shows changes over time.
Free with trial Devaluation. Crisis concept, red arrow sign, phone and laptop Vector illustration. Decrease business concept vectors Devaluation crisis concept vector icon. Round sign. Devaluation. Crisis concept, red arrow sign, phone and laptop Vector illustration
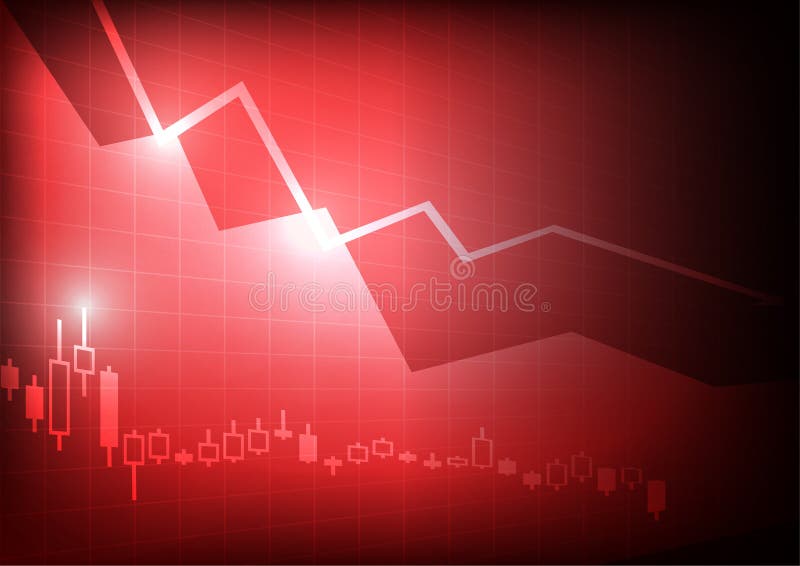
Free with trial Vector : Decreasing business graph on red background. Decrease business concept vectors Decreasing business graph on red background
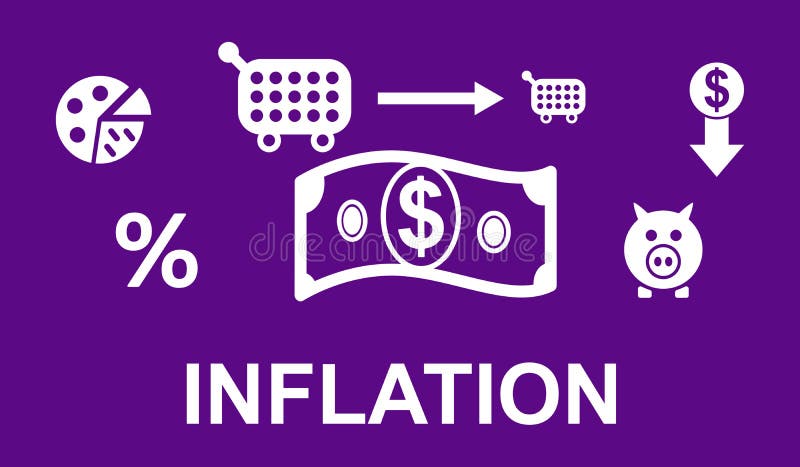
Free with trial Concept of inflation with icons in cogwheels. Decrease business concept illustrations Concept of inflation
Free with trial Concept of inflation with connected icons. Decrease business concept illustrations Concept of inflation
Free with trial Concept of inflation with connected icons. Decrease business concept illustrations Concept of inflation
Free with trial Concept of inflation with icons on speech bubbles. Decrease business concept illustrations Concept of inflation
Free with trial Concept of inflation with connected icons. Decrease business concept illustrations Concept of inflation
Free with trial Cost optimization line concept icon. Cost optimization flat vector website sign, outline symbol, illustration. Decrease business concept vectors Cost optimization line icon concept. Cost optimization flat vector symbol, sign, outline illustration. Cost optimization line concept icon. Cost optimization flat vector website sign, outline symbol, illustration.
Free with trial Concept of inflation with connected icons. Decrease business concept illustrations Concept of inflation
Free with trial Woman using digital tablet with inflation concept on background. Decrease business concept illustrations Concept of inflation. Woman using digital tablet with inflation concept on background
Free with trial Concept of inflation with icons on speech bubbles. Decrease business concept illustrations Concept of inflation
Free with trial Illustration of an inflation concept. Decrease business concept illustrations Concept of inflation. Illustration of an inflation concept
Free with trial Concept of inflation with connected icons. Decrease business concept illustrations Concept of inflation
Free with trial Concept of inflation with icons on squares. Decrease business concept illustrations Concept of inflation
Free with trial Concept of inflation with connected icons. Decrease business concept illustrations Concept of inflation
Free with trial Concept of inflation with icons on speech bubbles. Decrease business concept illustrations Concept of inflation
Free with trial Concept of inflation with icons on hexagons. Decrease business concept illustrations Concept of inflation
Free with trial Wooden blocks with symbol of inflation concept on blue background. Decrease business concept illustrations Concept of inflation. Wooden blocks with symbol of inflation concept on blue background
Free with trial Concept of inflation with connected icons. Decrease business concept illustrations Concept of inflation
Free with trial Concept of inflation with connected icons. Decrease business concept illustrations Concept of inflation
Free with trial Concept of inflation with icons on circles. Decrease business concept illustrations Concept of inflation
Free with trial Concept of inflation with connected icons. Decrease business concept illustrations Concept of inflation
Free with trial Concept of inflation with connected icons. Decrease business concept illustrations Concept of inflation
Free with trial Dollar coin falling down vector isolated. Icon of a coin and arrow pointing down, concept of financial crisis. Economy decrease and recession, global crisis. Decrease business concept vectors Icon of a dollar coin falling down vector isolated. Dollar coin falling down vector isolated. Icon of a coin and arrow pointing down, concept of financial crisis. Economy decrease and recession, global crisis
Free with trial Dollar coin falling down vector isolated. Icon of a coin and arrow pointing down, concept of financial crisis. Economy decrease and recession. Coin falling down and ruins everything. Decrease business concept vectors Icon of a dollar coin falling down vector isolated. Dollar coin falling down vector isolated. Icon of a coin and arrow pointing down, concept of financial crisis. Economy decrease and recession. Coin falling down and ruins everything
Free with trial Dollar coin falling down vector isolated. Icon of a coin and arrow pointing down, concept of financial crisis. Economy decrease and recession, global crisis. Decrease business concept vectors Icon of a dollar coin falling down vector isolated. Dollar coin falling down vector isolated. Icon of a coin and arrow pointing down, concept of financial crisis. Economy decrease and recession, global crisis
Free with trial Illustration of an inflation concept. Decrease business concept illustrations Concept of inflation. Illustration of an inflation concept
Free with trial Concept of inflation with connected icons. Decrease business concept illustrations Concept of inflation
Free with trial Concept of inflation with connected icons. Decrease business concept illustrations Concept of inflation
Free with trial Concept of inflation. With connected icons. Decrease business concept illustrations Concept of inflation. With connected icons
Free with trial Top view of hands using laptop with symbol of inflation concept. Decrease business concept illustrations Concept of inflation. Top view of hands using laptop with symbol of inflation concept
Free with trial Illustration of an inflation concept. Decrease business concept illustrations Concept of inflation. Illustration of an inflation concept
Free with trial Concept of inflation with icons on circles. Decrease business concept illustrations Concept of inflation
Free with trial Concept of inflation with icons on futuristic hud interface. Decrease business concept illustrations Concept of inflation
Free with trial Illustration of an inflation concept. Decrease business concept illustrations Concept of inflation. Illustration of an inflation concept
Free with trial Illustration of an inflation concept. Decrease business concept illustrations Concept of inflation. Illustration of an inflation concept
Free with trial Inflation concept between hands of a woman in background. Decrease business concept illustrations Concept of inflation. Inflation concept between hands of a woman in background
Free with trial Top view of hands using laptop with symbol of inflation concept. Decrease business concept illustrations Concept of inflation. Top view of hands using laptop with symbol of inflation concept
Free with trial Concept of inflation with icons on squares. Decrease business concept illustrations Concept of inflation
Free with trial Oil barrel with down red arrow. Crude Oil price falling concept. 3D rendering isolated on white background. Decrease business concept illustrations Oil barrel with down red arrow. Crude Oil price falling concept. 3D rendering
Free with trial Real estate market trends - concept image. Decrease business concept illustrations Real estate market trends - concept image
Free with trial Businessman standing in bird cage lock with decline bar graph inside and virus pathogen. Decrease business concept vectors Company revenue decrease from global Coronavirus crash concept-Economic impact by COVID-19 lockdown. Businessman standing in bird cage lock with decline bar graph inside and virus pathogen
Free with trial Concept of inflation with connected icons. Decrease business concept illustrations Concept of inflation
Free with trial Concept of inflation with icons on squares. Decrease business concept illustrations Concept of inflation
Free with trial Concept of inflation with connected icons. Decrease business concept illustrations Concept of inflation
Free with trial Illustration of an inflation concept. Decrease business concept illustrations Concept of inflation. Illustration of an inflation concept
Free with trial Concept of inflation with icons on squares. Decrease business concept illustrations Concept of inflation
Free with trial Extreme weight loss red gradient concept icon. Food intake avoidance. Severe slimming abstract idea thin line illustration. Isolated outline drawing. Roboto-Medium, Myriad Pro-Bold fonts used. Decrease business concept vectors Extreme weight loss red gradient concept icon
Free with trial Bitcoin Crash Graph Vector. Bitcoin Price Drops. Crypto Currency Market Concept. Surprised Investor Or Businessman. Annoyance, Panic. Isolated Flat Cartoon Illustration. Decrease business concept vectors Bitcoin Crash Graph Vector. Bitcoin Price Drops. Price Market Value Going Down. Crypto Currency Market Concept. Bitcoin Crash Graph Vector. Bitcoin Price Drops. Crypto Currency Market Concept. Surprised Investor Or Businessman. Annoyance, Panic. Isolated Flat Cartoon Illustration
Free with trial Decreasing traffic blue gradient concept icon. Scooter sharing benefit abstract idea thin line illustration. Managing urban traffic. Smart mobility. Vector isolated outline color drawing. Decrease business concept vectors Decreasing traffic blue gradient concept icon
Free with trial Low profitability vector thin line stroke icon. Low profitability outline illustration, linear sign, symbol isolated concept. Decrease business concept vectors Low profitability vector thin line stroke icon. Low profitability outline illustration, linear sign, symbol concept.
Free with trial Reduces employment blue gradient concept icon. Economic correlation. Negative effect of inflation abstract idea thin line illustration. Isolated outline drawing. Myriad Pro-Bold font used. Decrease business concept vectors Reduces employment blue gradient concept icon
Free with trial Vendor development blue gradient concept icon. Sourcing strategy abstract idea thin line illustration. Supply chain management. New suppliers. Isolated outline drawing. Myriad Pro-Bold font used. Decrease business concept vectors Vendor development blue gradient concept icon
Free with trial Vector illustration of business concept of discounted sales prices, decreases, shopping, customer increases. Decrease business concept vectors Illustration vector graphic cartoon character of discount and sale. Vector illustration of business concept of discounted sales prices, decreases, shopping, customer increases
Free with trial Creative falling forex chart with index on blurry dark background. Crisis and declining trade concept. 3D Rendering. Decrease business concept illustrations Creative falling forex chart with index on dark background. Crisis and declining trade concept. 3D Rendering
Free with trial Low Cost Loans text on notepad, concept background. Decrease business concept illustrations Low Cost Loans text on notepad, concept background
Free with trial Cost Cutting - process used by companies to reduce their costs and increase their profits, text concept stamp. Decrease business concept illustrations Cost Cutting - process used by companies to reduce their costs and increase their profits, text concept stamp
Free with trial Zero Cost text message bubble, concept background. Decrease business concept illustrations Zero Cost text message bubble, concept background
Free with trial Vector : Graph coin with decrease arrow on white background. Decrease business concept vectors Vector : Graph coin with decrease arrow on white background
Free with trial Reduce abandoned carts turquoise concept icon. Offer lower price. Discount strategy abstract idea thin line illustration. Isolated outline drawing. Editable stroke. Arial, Myriad Pro-Bold fonts used. Decrease business concept vectors Reduce abandoned carts turquoise concept icon
Free with trial This image shows multiple yellow sticky notes, each with a downward-pointing black arrow, generated by AI. It represents a concept of decline or negative progression, perhaps in business or data analysis. The consistent pattern suggests a systematic downward trend. Decrease business concept illustrations Downward Trending Sticky Notes. This image shows multiple yellow sticky notes, each with a downward-pointing black arrow, generated by AI. It represents a concept of decline or negative progression, perhaps in business or data analysis. The consistent pattern suggests a systematic downward trend.
Free with trial Web line icon. Monitor with business graph. Decrease business concept illustrations Line icon. Monitor with business graph
Free with trial Large mobile phone with falling red business graph. Sad young blogger guy on knees. decrease in views and subscribers. Internet statistics. Business problem. man and a smartphone. Flat illustration. Decrease business concept vectors Large mobile phone with falling red business graph
Free with trial Line Money on hand icon isolated seamless pattern on white background. Palm holds cash with down. Cash salary decrease. Colorful outline concept. Vector. Decrease business concept vectors Line Money on hand icon isolated seamless pattern on white background. Palm holds cash with down. Cash salary decrease
Free with trial Oil industry crisis concept. Vector Illustration. Square format. Decrease business concept vectors Oil crisis concept. Oil industry crisis concept. Vector Illustration. Square format
Free with trial Oil industry crisis concept. Oil barrel with crude oil 6 month price chart and an arrow pointing downwards on background. Vector Illustration. Square format. Decrease business concept vectors Oil crisis concept. Oil industry crisis concept. Oil barrel with crude oil 6 month price chart and an arrow pointing downwards on background. Vector Illustration. Square format
Free with trial Kiev or kyiv city isometric financial economy condition concept for describe cities growth expand - vector illustration. Decrease business concept illustrations Kiev or kyiv city isometric financial economy condition concept for describe cities growth expand - vector
Free with trial Decrease 3d rendering isometric icon uploading. Decrease business concept vectors Decrease 3d rendering isometric icon. Decrease 3d rendering isometric icon uploading.
Free with trial Word writing text Leaky Gut. Business concept for A condition in which the lining of small intestine is damaged Hanging blackboard message communication information sign purple background. Decrease business concept illustrations Word writing text Leaky Gut. Business concept for A condition in which the lining of small intestine is damaged Hanging blackboard
Free with trial Vector : Graph coin with decrease arrow on white background. Decrease business concept vectors Vector : Graph coin with decrease arrow on white background
Free with trial Vector : Graph coin with decrease arrow on white background. Decrease business concept vectors Vector : Graph coin with decrease arrow on white background
Free with trial Declining graph icon. Business decline chart sign. Simple vector logo. Decrease business concept illustrations Negative graph statistics linear style sign for mobile concept and web design. Declining graph icon. Business decline chart sign. Simple vector logo