Free with trial Hand drawn percentage symbol inside a coin or circle with simple star and dot accents. Decrease business concept illustrations Hand drawn percentage symbol inside a coin or circle with simple star and dot accents
Free with trial A 3D bar chart displays a downward trend. The bars are alternating green and pink, decreasing in height from left to right. A bright yellow arrow points downwards, crossing over the bars and emphasizing the decline. The background is a solid, light blue. Decrease business concept illustrations Downward Trending Bar Chart with Yellow Arrow Indicating Decline on Light Blue Background. A 3D bar chart displays a downward trend. The bars are alternating green and pink, decreasing in height from left to right. A bright yellow arrow points downwards, crossing over the bars and emphasizing the decline. The background is a solid, light blue
Free with trial A 3D rendered illustration features a large blue downward-pointing arrow positioned diagonally on a white background. Overlapping the arrow is a small pink circle containing a white percentage symbol. This visual effectively communicates concepts such as discounts, sales, price reductions, negative trends, or financial decline. Decrease business concept illustrations Blue Downward Arrow with Pink Circle and Percentage Symbol on White Background image photo. A 3D rendered illustration features a large blue downward-pointing arrow positioned diagonally on a white background. Overlapping the arrow is a small pink circle containing a white percentage symbol. This visual effectively communicates concepts such as discounts, sales, price reductions, negative trends, or financial decline
Free with trial Illustration shows a stock market decline with candlestick charts and downward trending arrow. The design features a light blue background and a simple layout. Useful for financial articles, reports, or any material illustrating loss, recession, or negative trends in commercial sector. Decrease business concept illustrations Falling stock market chart showing economic downturn and financial loss. Illustration shows a stock market decline with candlestick charts and downward trending arrow. The design features a light blue background and a simple layout. Useful for financial articles, reports, or any material illustrating loss, recession, or negative trends in commercial sector
Free with trial Colorful bar chart on a blue background showing data analysis and statistical growth. Generative AI. Decrease business concept illustrations Colorful bar chart on a blue background showing data analysis and statistical growth
Free with trial A 3D illustration of a bar graph with a blue downward arrow, symbolizing financial decline or loss, isolated on white. Decrease business concept illustrations Bar Graph with Blue Arrow Pointing Down 3D Illustration Isolated on White Background. A 3D illustration of a bar graph with a blue downward arrow, symbolizing financial decline or loss, isolated on white.
Free with trial This image features a bar graph representing an economic recession, highlighted by a red downward arrow indicating a decline. The visualization illustrates the negative trend in financial performance and the risks associated with an economic downturn. The background is transparent, making it suitable for various presentations. This image has been created using AI. Decrease business concept vectors Economic Recession Concept Bar Graph With Red Downward Arrow On Transparent Background. This image features a bar graph representing an economic recession, highlighted by a red downward arrow indicating a decline. The visualization illustrates the negative trend in financial performance and the risks associated with an economic downturn. The background is transparent, making it suitable for various presentations. This image has been created using AI.
Free with trial A detailed gold coin is shown against a white background. The face of the coin features a black circular inset displaying a golden bar chart with five bars of decreasing height, indicating a downward trend. A golden arrow points downwards along the trend line, reinforcing the concept of decline or loss. The coin has a ribbed edge, typical of real currency. This image represents financial decline,. Decrease business concept illustrations Gold Coin with Black Circle Displaying Downward Bar Chart and Arrow currency finance. A detailed gold coin is shown against a white background. The face of the coin features a black circular inset displaying a golden bar chart with five bars of decreasing height, indicating a downward trend. A golden arrow points downwards along the trend line, reinforcing the concept of decline or loss. The coin has a ribbed edge, typical of real currency. This image represents financial decline,
Free with trial White clouds symbolize CO2 capture & reduction. Arrows show decreasing emissions, recycling, & upward trend toward cleaner energy. A hopeful, minimalist design. Decrease business concept illustrations Carbon Dioxide Reduction: Minimalist Cloud Visual Depicting a Clean Energy Transition. White clouds symbolize CO2 capture & reduction. Arrows show decreasing emissions, recycling, & upward trend toward cleaner energy. A hopeful, minimalist design
Free with trial Up and down arrow direction icon set in generic style. Upward and downward sign symbol illustration. Decrease business concept vectors Up and down arrow direction icon set in generic style. Upward and downward sign symbol
Free with trial Stock market bear market. Downward tread chart on the investment. Bear trader wearing eyeglasses sitting at office monitoring stock market. Generative Ai. Decrease business concept illustrations Bull trader wearing eyeglasses sitting at office monitoring stock market. Generative Ai. Stock market bear market. Downward tread chart on the investment. Bear trader wearing eyeglasses sitting at office monitoring stock market. Generative Ai
Free with trial Illustration shows a sad woman with a downward trending graph behind her representing loss or decline, conveying a somber and reflective mood. Generative AI. Decrease business concept vectors Sad woman standing in front of declining graph showing economic or personal loss vector illustration. Illustration shows a sad woman with a downward trending graph behind her representing loss or decline, conveying a somber and reflective mood. Generative AI
Free with trial Elevate your marketing efforts with this eye-catching 10% discount sale banner. Perfect for online and offline promotions, this left-aligned design boasts a clean, modern aesthetic. Vibrant colors and impactful typography create a visually engaging experience, grabbing attention and encouraging immediate action. The generous copy space allows for easy customization with your unique brand. Decrease business concept illustrations Drive Sales with a Modern 10 Discount Sale Banner Minimalist Design for Maximum Impact. Elevate your marketing efforts with this eye-catching 10% discount sale banner. Perfect for online and offline promotions, this left-aligned design boasts a clean, modern aesthetic. Vibrant colors and impactful typography create a visually engaging experience, grabbing attention and encouraging immediate action. The generous copy space allows for easy customization with your unique brand
Free with trial Abstract colorful bar charts display statistical data and financial trend analysis. Decrease business concept vectors Colorful abstract bar charts representing data analysis and statistical visualization. Abstract colorful bar charts display statistical data and financial trend analysis.
Free with trial Financial chart arrow up and down icon illustration. Growth and decline graph symbol on black circle. Decrease business concept vectors Financial chart arrow up and down icon. Growth and decline graph symbol on black circle
Free with trial A circular icon with a thick gold border contains a golden DNA helix symbol on a black background. To the right of the DNA helix, two jagged arrows point downwards, indicating a downward trend or decline. The overall design is sleek and symbolic, suggesting concepts related to genetic research, health trends, or scientific data analysis. Decrease business concept illustrations Golden DNA Helix Icon with Downward Trend Arrows on Black Circle with Gold Border genetics. A circular icon with a thick gold border contains a golden DNA helix symbol on a black background. To the right of the DNA helix, two jagged arrows point downwards, indicating a downward trend or decline. The overall design is sleek and symbolic, suggesting concepts related to genetic research, health trends, or scientific data analysis
Free with trial US GDP decline with American flag and down arrow. 3D rendering isolated on white background. Decrease business concept illustrations US GDP decline with American flag and down arrow. 3D rendering. Isolated on white background
Free with trial This 3D rendered image shows three stacks of gold coins of varying heights arranged from left to right. A thick red arrow, forming a downward trend line, is positioned diagonally from the top left to the bottom right, pointing towards the smallest stack of coins. The background is a solid, soft pink color. Decrease business concept illustrations 3D Rendering of Falling Red Arrow Over Stacks of Gold Coins on a Pink Background finance. This 3D rendered image shows three stacks of gold coins of varying heights arranged from left to right. A thick red arrow, forming a downward trend line, is positioned diagonally from the top left to the bottom right, pointing towards the smallest stack of coins. The background is a solid, soft pink color
Free with trial A 3D pie chart with three colored segments (pink, blue, and teal) is shown against a solid purple background. A yellow circle with a white upward arrow is positioned to the left of the chart, and a pink circle with a white downward arrow is to the right. Decrease business concept illustrations 3D Pie Chart With Up and Down Arrows Indicating Growth and Decline on a Purple Background. A 3D pie chart with three colored segments (pink, blue, and teal) is shown against a solid purple background. A yellow circle with a white upward arrow is positioned to the left of the chart, and a pink circle with a white downward arrow is to the right
Free with trial Overlay stock market trading graph. overlay of a stock exchange screen with a strong uptrend, concept for successful investment strategy and economic growth. Decrease business concept illustrations Overlay stock market trading graph. colorful Japanese candlestick chart showing a bullish market breakout, financial trading graph. overlay stock market trading graph. overlay of a stock exchange screen with a strong uptrend, concept for successful investment strategy and economic growth
Free with trial A striking visual representation of two contrasting trends, one rising and the other falling, depicted through elegant gradient colors in sharp focus. Decrease business concept illustrations Dynamic Contrast of Trends Illustrated Through a Gradient Wave in a Vibrant Display of Colors. A striking visual representation of two contrasting trends, one rising and the other falling, depicted through elegant gradient colors in sharp focus
Free with trial Money loss and arrow down. Recession Financial Crisis. Investment expenses, economic depression. Decrease business concept vectors Money loss and arrow down. Recession Financial Crisis. Investment expenses, economic depression
Free with trial Image is generated with the use of an AI. Decrease business concept illustrations Crisis 19 covid recession financial evaluation negative down showing hand arrow Holding. image is generated with the use of an AI
Free with trial A 3D illustration depicting financial growth. A line graph with blue and red data points ascends across a light blue background. Interspersed are green and red candlestick bars, representing market fluctuations. Stacks of gold coins and individual coins with dollar signs are arranged at the base of the chart, symbolizing wealth and investment. Decrease business concept illustrations 3D Financial Growth Chart with Stacks of Gold Coins and Candlestick Bars finance graph. A 3D illustration depicting financial growth. A line graph with blue and red data points ascends across a light blue background. Interspersed are green and red candlestick bars, representing market fluctuations. Stacks of gold coins and individual coins with dollar signs are arranged at the base of the chart, symbolizing wealth and investment
Free with trial Up and down arrow icon set in generic style. Upward and downward sign symbol illustration. Decrease business concept vectors Up and down arrow icon set in generic style. Upward and downward sign symbol
Free with trial A red arrow crashes through a stock market graph displayed on a tablet screen. the scene is set against a dark blue background, symbolizing financial crisis and economic downturn. it represents loss and risk. Decrease business concept illustrations Red arrow crashing through stock market graph on tablet screen in a dark blue background. a red arrow crashes through a stock market graph displayed on a tablet screen. the scene is set against a dark blue background, symbolizing financial crisis and economic downturn. it represents loss and risk.
Free with trial Illustrated Percentage Sign with Radial Lines for Sales, Discounts, and Financial Concepts. Decrease business concept vectors Illustrated Percentage Sign with Radial Lines for Sales, Discounts, and Financial Concepts
Free with trial Toy figurines arranged on colorful blocks to create a bar graph, representing population growth, demographic trends, and social statistics. Decrease business concept illustrations Toy figurines standing on colorful blocks forming a bar graph, symbolizing population growth, demographic trends, and social. Toy figurines arranged on colorful blocks to create a bar graph, representing population growth, demographic trends, and social statistics
Free with trial Hand interacting with a red downward trend line against a blue bar graph background image. Generative AI. Decrease business concept illustrations Hand interacting with a red downward trend line against a blue bar graph background image
Free with trial A stylized stock market chart showing a downward trend with blue and orange bars on white. Generative AI. Decrease business concept illustrations A stylized stock market chart showing a downward trend with blue and orange bars on white
Free with trial Square Format Infographic Poster Bold Typography Charts 1 Upscaled 4X clean composition. Featuring square, format, infographic. Neutral, commercial-friendly, with room for copy. Decrease business concept illustrations Square Format Infographic Poster Bold Typography Charts 1 Upscaled 4X clean composition
Free with trial 3D rendering showing falling gold coins and a downward trending graph, symbolizing financial market decline. Decrease business concept illustrations Financial Market Decline: Visual Representation of Decreasing Value and Economic Downturn. 3D rendering showing falling gold coins and a downward trending graph, symbolizing financial market decline
Free with trial A 3D illustration of a blue line graph on a light blue background. The graph features a wavy blue line connecting several data points represented by small pink and green spheres. The overall shape suggests fluctuating data or trends, with some points indicating upward movement. Decrease business concept illustrations 3D Blue Line Graph with Pink and Green Data Points on Light Blue Background chart statistics. A 3D illustration of a blue line graph on a light blue background. The graph features a wavy blue line connecting several data points represented by small pink and green spheres. The overall shape suggests fluctuating data or trends, with some points indicating upward movement
Free with trial A minimalist 3D render displays three rounded rectangular bars representing a bar graph. The tallest bar is a soft blue, followed by a medium green bar, and the shortest is a light pink bar. They are arranged in descending order of height and stand on a plain white background, suggesting data visualization or progress. Decrease business concept illustrations Three colorful 3D bar graph elements in blue green and pink on a white background chart. A minimalist 3D render displays three rounded rectangular bars representing a bar graph. The tallest bar is a soft blue, followed by a medium green bar, and the shortest is a light pink bar. They are arranged in descending order of height and stand on a plain white background, suggesting data visualization or progress
Free with trial A 3D rendered bar chart with yellow, pink, and teal bars stands against a light purple background. A purple magnifying glass with a yellow handle is positioned over the chart, suggesting analysis. A thin line with pink dots connects the tops of the bars, indicating a trend. Decrease business concept illustrations 3D Bar Chart with Magnifying Glass and Trend Line on Purple Background graph statistics. A 3D rendered bar chart with yellow, pink, and teal bars stands against a light purple background. A purple magnifying glass with a yellow handle is positioned over the chart, suggesting analysis. A thin line with pink dots connects the tops of the bars, indicating a trend
Free with trial Luxury purple inscription tax free on black podium, soft light, front view smooth background, 3d rendering. Decrease business concept illustrations Luxury purple inscription tax free on black podium, soft light, smooth background, 3d rendering
Free with trial Percent growth and decline arrow icon vector. Up and down percentage arrows sign symbol. Decrease business concept vectors Percent growth and decline arrow icon. Up and down percentage arrows sign symbol
Free with trial 3d White Baht And Yen Symbol On Rounded Blue Icons With 3d Balance Weight Seesaw, 3d illustration. Decrease business concept illustrations 3d White Baht And Yen Symbol On Rounded Blue Icons With 3d Balance Weight Seesaw, 3d illustration
Free with trial Blue Toned Financial Chart With Pen, Showing Downward Trend, Illustrating Market Volatility. , Generated by AI. Decrease business concept illustrations Blue Toned Financial Chart With Pen, Showing Downward Trend, Illustrating Market Volatility.
Free with trial A 3D figure holds its head in distress beneath a large red downward arrow, symbolizing loss, decline, or financial troubles. Generative AI. Decrease business concept illustrations A 3D figure holds its head in distress beneath a large red downward arrow, symbolizing loss, decline, or financial troubles.
Free with trial A striking 3D illustration features a golden, transparent euro coin with the euro symbol prominently displayed. A sharp, yellow, downward-pointing arrow pierces the coin, symbolizing a financial decline or economic downturn. The image is set against a clean white background. Decrease business concept illustrations Golden Euro Coin with Downward Pointing Yellow Arrow Symbolizing Financial Decline Keywords: euro, coin, currency, money, finance. A striking 3D illustration features a golden, transparent euro coin with the euro symbol prominently displayed. A sharp, yellow, downward-pointing arrow pierces the coin, symbolizing a financial decline or economic downturn. The image is set against a clean white background
Free with trial A 3d rendering of a green bar graph with a red arrow pointing downwards and gold dollar coins. Decrease business concept illustrations 3d rendering of a green bar graph with a downward trending red arrow and gold dollar coins. A 3d rendering of a green bar graph with a red arrow pointing downwards and gold dollar coins
Free with trial "Reduce" encourages minimizing consumption to decrease the amount of waste created. "Reuse" promotes finding new purposes for items instead of discarding them. "Recycle" involves processing used materials into new products, conserving resources and energy. By prioritizing these actions, we can significantly lessen our environmental impact, conserve natural resources, and promote a more sustainable future. Decrease business concept illustrations \'Reduce, Reuse, Recycle\' is a fundamental mantra for waste management and environmental sustainability. "Reduce" encourages minimizing consumption to decrease the amount of waste created. "Reuse" promotes finding new purposes for items instead of discarding them. "Recycle" involves processing used materials into new products, conserving resources and energy. By prioritizing these actions, we can significantly lessen our environmental impact, conserve natural resources, and promote a more sustainable future.
Free with trial A 3D illustration depicts financial data analysis. On the left, a purple rectangular panel shows a red downward-trending arrow and a small pie chart with red, yellow, and blue segments. Below it, another purple panel displays a candlestick chart with red and blue bars. To the right, an orange magnifying glass with a turquoise lens hovers, suggesting investigation. The entire composition is set. Decrease business concept illustrations 3D Render of Financial Data Visualization with Downward Trend Graph and Magnifying Glass. A 3D illustration depicts financial data analysis. On the left, a purple rectangular panel shows a red downward-trending arrow and a small pie chart with red, yellow, and blue segments. Below it, another purple panel displays a candlestick chart with red and blue bars. To the right, an orange magnifying glass with a turquoise lens hovers, suggesting investigation. The entire composition is set
Free with trial Up and down percent arrow icon vector. Percentage growth and decline arrows sign symbol. Decrease business concept vectors Up and down percent arrow icon. Percentage growth and decline arrows sign symbol
Free with trial Red down arrow symbol. Two green up arrows. Directional comparison illustration. Vector design. EPS 10. Decrease business concept vectors Red down arrow symbol. Two green up arrows. Directional comparison illustration. Vector design.
Free with trial Financial chart displaying a series of candlestick patterns on a digital screen, used for stock data analysis. The chart features vertical bars in orange against a blue background with grid lines. Each candlestick represents price movements within a specific time frame, showcasing market trends. The background includes a blurred assortment of lights and other graphical elements, indicating a financial data interface, likely used for investment portfolio analysis and trading activities. Decrease business concept illustrations Financial Chart And Stock Data Analysis For Investment Portfolio. Candle Stick Graph For Trade. Financial chart displaying a series of candlestick patterns on a digital screen, used for stock data analysis. The chart features vertical bars in orange against a blue background with grid lines. Each candlestick represents price movements within a specific time frame, showcasing market trends. The background includes a blurred assortment of lights and other graphical elements, indicating a financial data interface, likely used for investment portfolio analysis and trading activities.
Free with trial Percent arrow up and down icon vector. Growth and decline percentage arrows sign symbol. Decrease business concept vectors Percent arrow up and down icon. Growth and decline percentage arrows sign symbol
Free with trial Up and down dollar arrow icon on circle line. USD growth and decline sign symbol vector. Decrease business concept vectors Up and down dollar arrow icon on circle line. USD growth and decline sign symbol
Free with trial Vector icon of a clock with a downward arrow symbolizing time reduction, delay, or history log. Decrease business concept vectors Vector icon of a clock with a downward arrow symbolizing time reduction, delay, or history log
Free with trial Percent arrow growth and decline outline icon vector. Percentage up and down sign symbol. Decrease business concept vectors Percent arrow growth and decline outline icon. Percentage up and down sign symbol
Free with trial A visual representation of decreasing percentages shown by three green arrows with percentage symbols, isolated on a white background. Decrease business concept illustrations Three green downward pointing arrows with percentage symbols isolated on white background. A visual representation of decreasing percentages shown by three green arrows with percentage symbols, isolated on a white background
Free with trial A 3D rendered graphic depicts a bar chart with three vertical bars of varying heights: two blue bars flanking a taller yellow bar. At the top of the yellow bar, a central yellow sphere is connected by white rods to two smaller blue spheres, resembling a molecular structure or a network. The entire graphic is isolated on a white background, suggesting concepts of data analysis, growth, and. Decrease business concept illustrations 3D Rendered Bar Chart with Connecting Spheres Representing Data Analysis graph statistics. A 3D rendered graphic depicts a bar chart with three vertical bars of varying heights: two blue bars flanking a taller yellow bar. At the top of the yellow bar, a central yellow sphere is connected by white rods to two smaller blue spheres, resembling a molecular structure or a network. The entire graphic is isolated on a white background, suggesting concepts of data analysis, growth, and
Free with trial This image depicts a stock market decline with a red bar chart against a dark background, illustrating a financial crisis concept. The chart shows a downward trend, indicating negative market performance. Decrease business concept illustrations Red Stock Market Decline Chart Displaying Financial Crisis on Dark Background. This image depicts a stock market decline with a red bar chart against a dark background, illustrating a financial crisis concept. The chart shows a downward trend, indicating negative market performance
Free with trial 3d render. Abstract blue holographic infographic with world map, abstract graphs of, columns or bars around which coronaviruses like covid-19 fly. Numbers over columns, beautiful. Decrease business concept illustrations 3d render. Abstract blue holographic infographic with world map, abstract graphs of, columns or bars around which
Free with trial This image features a house with a dollar sign and downward arrows, representing decreasing costs. It is isolated on a white background and is perfect for any design. Decrease business concept vectors Illustration of a house with a dollar sign and downward arrows, representing decreasing costs. This image features a house with a dollar sign and downward arrows, representing decreasing costs. It is isolated on a white background and is perfect for any design
Free with trial Up and down arrow dollar icon on black circle. USD growth and decline sign symbol vector. Decrease business concept vectors Up and down arrow dollar icon on black circle. USD growth and decline sign symbol
Free with trial Declining bar graph with a downward arrow symbolizing economic recession and financial loss. Decrease business concept vectors Declining bar graph with a downward arrow symbolizing economic recession and financial loss
Free with trial 3d White Pound And Baht Symbol On Rounded Blue Icons With 3d Balance Weight Seesaw, 3d illustration. Decrease business concept illustrations 3d White Pound And Baht Symbol On Rounded Blue Icons With 3d Balance Weight Seesaw, 3d illustration
Free with trial Up and down trend with arrows and graph isolated on dark background. Falling and rising graph with buy and sell buttons. Stock exchange concept. Trader profit and loss. Vector illustration. Decrease business concept vectors Up and down trend with arrows and graph isolated on dark background. Falling and rising graph with buy and sell buttons. Stock
Free with trial Percent up and down icon. Percentage upward and downward sign. Growth and decline symbol vector. Decrease business concept vectors Percent up and down icon. Percentage upward and downward sign. Growth and decline symbol
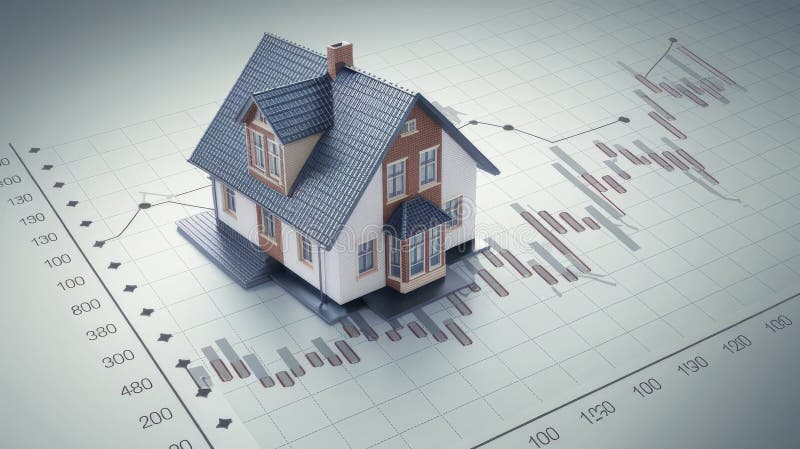
Free with trial House model placed on a graph showcasing fluctuating mortgage rates ok. Decrease business concept illustrations House model placed on a graph showcasing fluctuating mortgage rates
Free with trial House model placed on a graph showcasing fluctuating mortgage rates ok. Decrease business concept illustrations House model placed on a graph showcasing fluctuating mortgage rates
Free with trial In a softly lit setting, a hand holds a translucent card. On the card, a downward-pointing arrow graphic is displayed, symbolizing decline, loss, or negative trend. The color palette is minimal. Decrease business concept illustrations A hand delicately holds a card displaying a stark white arrow pointing downwards, indicating loss. In a softly lit setting, a hand holds a translucent card. On the card, a downward-pointing arrow graphic is displayed, symbolizing decline, loss, or negative trend. The color palette is minimal
Free with trial Hand drawn black and white illustration of a percent sign inside a circular arrow pointing down. Decrease business concept vectors Hand drawn black and white illustration of a percent sign inside a circular arrow pointing down
Free with trial Bitcoin price down, investor stands with telescope sinking bitcoin symbol to see the future. Decrease business concept vectors Bitcoin price down, investor stands with telescope sinking bitcoin symbol to see the future
Free with trial 3d Golden Dollar And Won Symbol On Rounded Black Icons With 3d Balance Weight Seesaw 3d illustration. Decrease business concept illustrations 3d Golden Dollar And Won Symbol On Rounded Black Icons With 3d Balance Weight Seesaw 3d illustration
Free with trial 3d Set Of Eight Different style Of Yen Symbol With Rounded Icons On White Background 3d Illustration. Decrease business concept illustrations 3d Set Of Eight Different style Of Yen Symbol With Rounded Icons On White Background 3d Illustration
Free with trial A green line graph displays fluctuating data points across five days, presented isolated on a clean white background. Decrease business concept illustrations Green line graph showing fluctuating data trends over five days isolated on white background. A green line graph displays fluctuating data points across five days, presented isolated on a clean white background
Free with trial A striking graph illustrates opposing trends one line sharply decreases while another rises, enveloped in warm orange hues that evoke energy and transformation. Decrease business concept illustrations Dynamic Trends Displayed Through Contrasting Lines in Shades of Orange With a Vivid Background. A striking graph illustrates opposing trends one line sharply decreases while another rises, enveloped in warm orange hues that evoke energy and transformation
Free with trial Percentage growth and decline icons. Percent arrow up and down flat style symbols - stock vector. Decrease business concept illustrations Percentage growth and decline icons. Percent arrow up and down flat style symbols - stock vector
Free with trial A 3D bar graph with light blue bars of decreasing height, indicating a downward trend. A bright yellow arrow points downwards, crossing over the bars, symbolizing financial decline or economic recession. The background is a soft, muted pink. Decrease business concept illustrations Downward Trend Graph with Falling Arrow Illustrating Financial Decline or Economic Recession. A 3D bar graph with light blue bars of decreasing height, indicating a downward trend. A bright yellow arrow points downwards, crossing over the bars, symbolizing financial decline or economic recession. The background is a soft, muted pink
Free with trial Loan interest rate doodle icon set. Hand drawn sketch doodle line style bank money loan interest rate icon for house, car discount percentage concept. Trendy cute element. Vector illustration. Decrease business concept vectors Loan interest rate doodle icon set. Hand drawn sketch doodle line style bank money loan interest rate icon for house
Free with trial Loan interest rate doodle icon set. Hand drawn sketch doodle line style bank money loan interest rate icon for house, car discount percentage concept. Trendy cute element. Vector illustration. Decrease business concept vectors Loan interest rate doodle icon set. Hand drawn sketch doodle line style bank money loan interest rate icon for house
Free with trial Growth and decline percent arrow outline icon on black circle. Percentage up and down sign symbol vector. Decrease business concept vectors Growth and decline percent arrow outline icon on black circle. Percentage up and down sign symbol
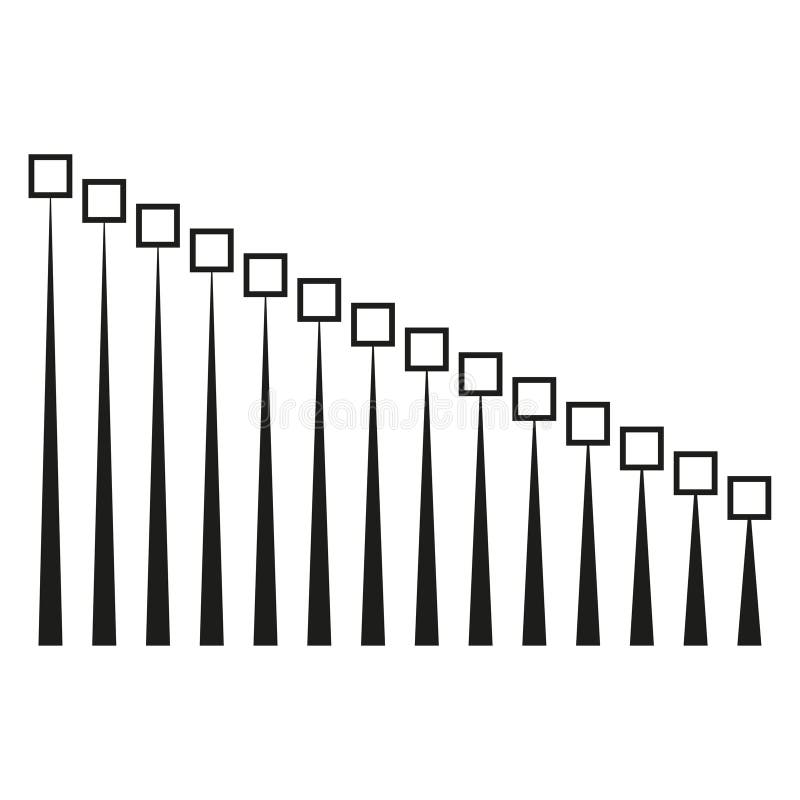
Free with trial Decreasing line graphic. Square point Vector. Minimalist progress chart. Data sequence illustration. EPS 10. Decrease business concept vectors Decreasing line graphic. Square point Vector. Minimalist progress chart. Data sequence illustration.
Free with trial Loan interest rate doodle icon set. Hand drawn sketch doodle line style bank money loan interest rate icon for house, car discount percentage concept. Trendy cute element. Vector illustration. Decrease business concept vectors Loan interest rate doodle icon set. Hand drawn sketch doodle line style bank money loan interest rate icon for house
Free with trial Loan interest rate doodle icon set. Hand drawn sketch doodle line style bank money loan interest rate icon for house, car discount percentage concept. Trendy cute element. Vector illustration. Decrease business concept vectors Loan interest rate doodle icon set. Hand drawn sketch doodle line style bank money loan interest rate icon for house
Free with trial Loan interest rate doodle icon set. Hand drawn sketch doodle line style bank money loan interest rate icon for house, car discount percentage concept. Trendy cute element. Vector illustration. Decrease business concept vectors Loan interest rate doodle icon set. Hand drawn sketch doodle line style bank money loan interest rate icon for house
Free with trial Loan interest rate doodle icon set. Hand drawn sketch doodle line style bank money loan interest rate icon for house, car discount percentage concept. Trendy cute element. Vector illustration. Decrease business concept vectors Loan interest rate doodle icon set. Hand drawn sketch doodle line style bank money loan interest rate icon for house