Free with trial A simple line style icon of a bar chart representing growth, data, or statistics. This graphic element is perfect for use in presentations, infographics, web design, and user interfaces. Decrease business development vectors Simple Line Style Bar Chart Graphic Outline Display Graph Icon. A simple line style icon of a bar chart representing growth, data, or statistics. This graphic element is perfect for use in presentations, infographics, web design, and user interfaces.
Free with trial "Neutral" Colored neutral pink, green and orange colors. Decrease business development illustrations Colored neutral pink, green and orange colors
Free with trial A 3D illustration of a blue line graph on a light blue background. The graph features a wavy blue line connecting several data points represented by small pink and green spheres. The overall shape suggests fluctuating data or trends, with some points indicating upward movement. Decrease business development illustrations 3D Blue Line Graph with Pink and Green Data Points on Light Blue Background chart statistics. A 3D illustration of a blue line graph on a light blue background. The graph features a wavy blue line connecting several data points represented by small pink and green spheres. The overall shape suggests fluctuating data or trends, with some points indicating upward movement
Free with trial A graph with a line that is slanted and has a lot of peaks and valleys. The graph is on a white background. Decrease business development illustrations A graph with a line that is slanted and has a lot of peaks and valleys
Free with trial This image shows colorful financial charts and graphs, generated by AI, illustrating various data points and percentages. The overlaid arrows suggest a downward trend, potentially indicating a negative market shift or economic decline. The visual representation aids in quick understanding of compl. Decrease business development illustrations Financial Data Analysis. This image shows colorful financial charts and graphs, generated by AI, illustrating various data points and percentages. The overlaid arrows suggest a downward trend, potentially indicating a negative market shift or economic decline. The visual representation aids in quick understanding of compl
Free with trial This icon represents the concept of compressing, condensing, or applying downward pressure. Decrease business development illustrations Three arrows pointing down to three horizontal lines showing compressing concept. This icon represents the concept of compressing, condensing, or applying downward pressure
Free with trial A simple outline icon illustration of a bar chart diagram, used to display data analysis and performance metrics. Ideal for presentations, infographics, and dashboards. Decrease business development vectors Outline Simple Bar Chart Diagram Icon Graphic for Data Analysis. A simple outline icon illustration of a bar chart diagram, used to display data analysis and performance metrics. Ideal for presentations, infographics, and dashboards.
Free with trial A set of twelve minimalist data visualization icons, featuring charts, graphs, and other data-related symbols. Perfect for presentations, reports, and dashboards, showcasing data analysis and growth trends. The clean design ensures readability and professional appeal. Decrease business development illustrations Data Visualization Icons
Free with trial A professional businessman showcases the concept of increasing quality while decreasing costs, using a hologram display with upward and downward arrows, while working on a laptop in an office setting. Decrease business development illustrations Businessman presents rising quality and decreasing cost concept. A professional businessman showcases the concept of increasing quality while decreasing costs, using a hologram display with upward and downward arrows, while working on a laptop in an office setting
Free with trial Netherlands real estate market going down concept with red arrows glowing and house shapes. Decrease business development illustrations Netherlands real estate market going down concept with red arrows glowing and house shapes
Free with trial White stone arrow pointing right on pink backdrop. Direction guide. Close-up. Decrease business development illustrations White stone arrow pointing right on pink backdrop. Direction guide
Free with trial White stone arrow pointing right on black backdrop. Direction guide. Close-up. Decrease business development illustrations White stone arrow pointing right on black backdrop. Direction guide
Free with trial Colored neutral brown colors background with two leaves green. Decrease business development illustrations Colored neutral brown colors background with leaves. Colored neutral brown colors background with two leaves green
Free with trial This image features a vibrant 3D representation of a bar chart, composed of translucent, glowing blocks in shades of pink, yellow, and cyan. The bars are arranged in varying heights, suggesting growth or data representation. The background is a dark green digital grid with subtle light effects and floating particles, creating a futuristic and technological atmosphere. This visual is ideal for concepts related to finance, data analysis, technology, growth, and digital trends. Decrease business development illustrations Abstract 3D Bar Chart with Neon Glow on Green Digital Background. This image features a vibrant 3D representation of a bar chart, composed of translucent, glowing blocks in shades of pink, yellow, and cyan. The bars are arranged in varying heights, suggesting growth or data representation. The background is a dark green digital grid with subtle light effects and floating particles, creating a futuristic and technological atmosphere. This visual is ideal for concepts related to finance, data analysis, technology, growth, and digital trends.
Free with trial Colored neutral brown colors background with two leaves. Decrease business development illustrations Colored neutral brown colors background with leaves
Free with trial Cityscape at sunset with overlayed red stock market graph showing decline. Decrease business development illustrations Cityscape at sunset with overlayed red stock market graph showing
Free with trial Bar graph depicts a downward trend in data, using various colors to illustrate the decline effectively. Decrease business development illustrations Graph illustrating data trends showing a steady decline over time. Bar graph depicts a downward trend in data, using various colors to illustrate the decline effectively.
Free with trial White stone arrow pointing right on yellow backdrop. Direction guide. Close-up. Decrease business development illustrations White stone arrow pointing right on yellow backdrop. Direction guide
Free with trial "Neutral" Colored neutral red, green and light yellow colors gray background with watercolor effect. Decrease business development vectors Colored neutral red, green and light yellow colors gray background
Free with trial "Neutral" Colored neutral green, cream and red colors background with leaves. Decrease business development illustrations Colored neutral green, cream and red colors background with leaves
Free with trial This graphic depicts data insights through a visually appealing bar chart connected by flowing lines, symbolizing the interconnectedness of data points and the flow of information. The varying heights of the bars represent different data values, showcasing growth or trends. The design is clean and. Decrease business development illustrations Data Insights Visualization. This graphic depicts data insights through a visually appealing bar chart connected by flowing lines, symbolizing the interconnectedness of data points and the flow of information. The varying heights of the bars represent different data values, showcasing growth or trends. The design is clean and
Free with trial "Neutrals" Vector illustration set scalloped leaves. Decrease business development vectors Vector illustration set scalloped leaves
Free with trial "Neutrals" Vector illustration set scalloped leaves. Decrease business development vectors Vector illustration set scalloped leaves
Free with trial "Neutral" Colored neutral green, cream and red colors background. Decrease business development vectors Colored neutral green, cream and red colors background
Free with trial "Neutrals" Vector illustration set scalloped leaves. Decrease business development vectors Vector illustration set scalloped leaves
Free with trial Woman seated while pointing upward beside a small house and upward-downward arrows. Ideal for real estate, trends, investment, housing market, decision-making, planning, simplified data, simple flat. Decrease business development illustrations Woman Pointing Upward with House and Directional Arrows Indicating Real Estate Trends. Woman seated while pointing upward beside a small house and upward-downward arrows. Ideal for real estate, trends, investment, housing market, decision-making, planning, simplified data, simple flat
Free with trial Two distinct lines converge in an engaging graph, illustrating contrasting trends. The sharp gradient colors enhance the visual impact, emphasizing change and growth. Decrease business development illustrations Dynamic Trends Revealed Through Shifting Data in Vibrant Gradient Hues. Two distinct lines converge in an engaging graph, illustrating contrasting trends. The sharp gradient colors enhance the visual impact, emphasizing change and growth
Free with trial Growing plant with bold leaves, a carbon footprint icon, and a calendar. Ideal for sustainability, eco goals, renewable resources, environmental awareness, emission reduction, green initiatives. Decrease business development vectors Sustainable practices symbolized by growing plant, carbon footprint, and calendar schedule. Growing plant with bold leaves, a carbon footprint icon, and a calendar. Ideal for sustainability, eco goals, renewable resources, environmental awareness, emission reduction, green initiatives
Free with trial Visualize impactful data with this dynamic water intensity graph, showcasing a strong downward trend over time. Perfect for illustrating progress in conservation and efficiency. Decrease business development vectors Dramatic water graph visually represents declining water intensity over time, showing efficiency gains. Visualize impactful data with this dynamic water intensity graph, showcasing a strong downward trend over time. Perfect for illustrating progress in conservation and efficiency
Free with trial This 3D rendering depicts financial growth, showcasing stacks of gold coins and black bars representing a rising graph. A golden pen rests on a sleek base, symbolizing the precision and detail involved in financial planning. This image was generated by AI and is perfect for illustrating financial s. Decrease business development illustrations Financial Growth Visualization. This 3D rendering depicts financial growth, showcasing stacks of gold coins and black bars representing a rising graph. A golden pen rests on a sleek base, symbolizing the precision and detail involved in financial planning. This image was generated by AI and is perfect for illustrating financial s
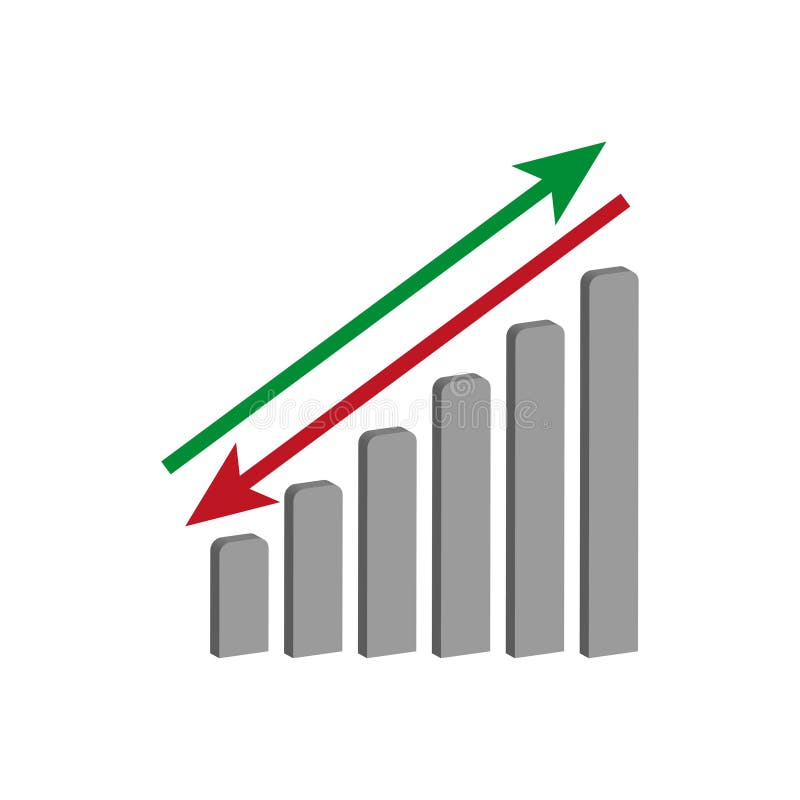
Free with trial Growth and decline chart. Market trend analysis. Vector illustration. EPS 10. Stock image. Decrease business development vectors Growth and decline chart. Market trend analysis. Vector illustration. EPS 10.
Free with trial Interest growth icon Black line art vector in black and white outline set collection sign. Decrease business development vectors Financial Icon Illustrating Growth, Investment Success, and Economic Prosperity. Interest growth icon Black line art vector in black and white outline set collection sign
Free with trial A 3D render displays a white rectangular surface with a grid pattern, representing a chart. A wavy blue line traverses the grid, with two red circular markers indicating specific points on the line. The graph is presented against a soft purple background. Decrease business development illustrations 3D Render of a Line Graph with Red Markers on a Grid Background chart data. A 3D render displays a white rectangular surface with a grid pattern, representing a chart. A wavy blue line traverses the grid, with two red circular markers indicating specific points on the line. The graph is presented against a soft purple background
Free with trial Wooden house model sits beside three percentage blocks on a light wooden table against a dark background, illustrating financial concepts. Decrease business development illustrations Wooden House Model and Percentage Blocks Representing Real Estate Interest. Wooden house model sits beside three percentage blocks on a light wooden table against a dark background, illustrating financial concepts
Free with trial Green landscape featuring black pipelines on the left, symbolizing fossil fuel infrastructure. Solar panels (Photovoltaic cells) and vertical wind turbines (Horizontal-Axis Wind Turbines) dominate the right, representing renewable energy sources. Vines grow over pipelines, solar panels, and towards wind turbines, symbolizing nature reclaiming the space. The sun beams brightly, with lightning depicted, suggesting energy transformation. White fluffy clouds float in the blue sky, enhancing the clean energy theme. This image visually contrasts traditional fossil fuels with sustainable energy technologies. Decrease business development illustrations From Fossil Fuels to a Greener Future. Green landscape featuring black pipelines on the left, symbolizing fossil fuel infrastructure. Solar panels (Photovoltaic cells) and vertical wind turbines (Horizontal-Axis Wind Turbines) dominate the right, representing renewable energy sources. Vines grow over pipelines, solar panels, and towards wind turbines, symbolizing nature reclaiming the space. The sun beams brightly, with lightning depicted, suggesting energy transformation. White fluffy clouds float in the blue sky, enhancing the clean energy theme. This image visually contrasts traditional fossil fuels with sustainable energy technologies.
Free with trial A stylized line graph icon with a purple gradient is displayed against a solid black background. The graph features four circular data points connected by angled lines, forming an upward trend. Decrease business development illustrations Stylized line graph icon with purple gradient on black background chart data. A stylized line graph icon with a purple gradient is displayed against a solid black background. The graph features four circular data points connected by angled lines, forming an upward trend
Free with trial Area chart illustrating trends in Sareorplojicam and S�snpavai across years. Shows variations over time. Decrease business development illustrations . Area chart illustrating trends in Sareorplojicam and S�snpavai across years. Shows variations over time
Free with trial "Neutral" Colored neutral red, green and light yellow colorswith watercolor effect. Decrease business development vectors Colored neutral red, green and light yellow colors
Free with trial "Neutral" Colored neutral light yellow, green and red colors with watercolor effect. Decrease business development vectors Colored neutral light yellow, green and red colors
Free with trial Tablet displays a declining graph, reflecting downturns. A dark world map serves as the backdrop, emphasizing global impact. This visualization symbolizes economic changes. The image is. Decrease business development illustrations Global Decline Displayed on Tablet with World Map Background in Dim Lighting. Tablet displays a declining graph, reflecting downturns. A dark world map serves as the backdrop, emphasizing global impact. This visualization symbolizes economic changes. The image is
Free with trial A professional businessman showcases the concept of increasing quality while decreasing costs, using a hologram display with upward and downward arrows, while working on a laptop in an office setting. Decrease business development illustrations Businessman presents rising quality and decreasing cost concept. A professional businessman showcases the concept of increasing quality while decreasing costs, using a hologram display with upward and downward arrows, while working on a laptop in an office setting
Free with trial A 3D rendering features a bar graph with three vertical bars in blue and yellow. Above the graph, a molecular structure is depicted with a central yellow sphere connected to three blue spheres by white rods. The entire graphic is isolated on a clean white background. Decrease business development illustrations 3D bar graph with molecular structure above on a white background chart data. A 3D rendering features a bar graph with three vertical bars in blue and yellow. Above the graph, a molecular structure is depicted with a central yellow sphere connected to three blue spheres by white rods. The entire graphic is isolated on a clean white background
Free with trial Yellow glossy arrow pointing right. Isolated on white background. Direction guide. Close-up. Decrease business development illustrations Yellow glossy arrow pointing right. Isolated on white background. Direction guide
Free with trial "Neutral" Colored neutral brown and light brown colors with watercolor effect. Decrease business development illustrations Colored neutral brown and light brown colors
Free with trial Cost reduction concept. Cost wording on decreasing coins stacking. cost reduction concept which effect to product cost , profit , inflation and economy recession concept. Decrease business development illustrations Cost reduction concept. Cost wording on decreasing coins stacking. cost reduction concept which effect to product cost , profit
Free with trial Illustration of a baby stroller interwoven with statistical graphs representing demographic trends, particularly highlighting declining birth rates and societal focus on family-related economics. Decrease business development illustrations Baby stroller illustration with declining demographic trends and graphical analytics. Illustration of a baby stroller interwoven with statistical graphs representing demographic trends, particularly highlighting declining birth rates and societal focus on family-related economics
Free with trial "Neutral" Colored neutral brown colors background. Decrease business development illustrations Colored neutral brown colors background
Free with trial Planting trees to increase green areas, the concept of reducing net zero greenhouse gas emissions. Decrease business development illustrations Planting trees to increase green areas, the concept of reducing net zero greenhouse gas emissions
Free with trial A red arrow is pointing upward, with wooden blocks stacked below it. Concept of progress and growth, as the arrow rises and the blocks below it grow in size generated by AI. Decrease business development vectors A red arrow is pointing upward, with wooden blocks stacked below it generated by AI. A red arrow is pointing upward, with wooden blocks stacked below it. Concept of progress and growth, as the arrow rises and the blocks below it grow in size generated by AI
Free with trial "Neutral" Colored neutral Green Red And Cream colors with watercolor effect. Decrease business development vectors Colored neutral Green Red And Cream colors
Free with trial A Red bar graph representing data growth on wooden surface, showcasing trends and analysis, Generative AI. Decrease business development illustrations Red bar graph representing data growth on wooden surface, showcasing trends and analysis
Free with trial "Neutral" Colored neutral green orange and pink colors with watercolor effect. Decrease business development vectors Colored neutral green orange and pink colors
Free with trial "Neutral" Colored neutral orange, green and pink colors with watercolor effect. Decrease business development vectors Colored neutral orange, green and pink colors
Free with trial 3D Pie chart icon. Circle divided into parts statistical diagram vector illustration. 3D render. Decrease business development vectors 3D Pie chart icon circle divided into parts statistical diagram vector illustration. 3D render.
Free with trial Abstract colorful bar charts display statistical data and financial trend analysis. Decrease business development vectors Colorful abstract bar charts representing data analysis and statistical visualization. Abstract colorful bar charts display statistical data and financial trend analysis.
Free with trial A circular icon with a thick gold border contains a golden DNA helix symbol on a black background. To the right of the DNA helix, two jagged arrows point downwards, indicating a downward trend or decline. The overall design is sleek and symbolic, suggesting concepts related to genetic research, health trends, or scientific data analysis. Decrease business development illustrations Golden DNA Helix Icon with Downward Trend Arrows on Black Circle with Gold Border genetics. A circular icon with a thick gold border contains a golden DNA helix symbol on a black background. To the right of the DNA helix, two jagged arrows point downwards, indicating a downward trend or decline. The overall design is sleek and symbolic, suggesting concepts related to genetic research, health trends, or scientific data analysis
Free with trial A simple 3D bar chart composed of three colored cubes stands on a white background. The cubes are arranged in ascending order of height from left to right: a small blue cube, a medium yellow cube, and a tall red cube. This arrangement visually represents increasing data or progress. Decrease business development illustrations Colorful Bar Chart with Red, Yellow, and Blue Cubes on White Background graph statistics. A simple 3D bar chart composed of three colored cubes stands on a white background. The cubes are arranged in ascending order of height from left to right: a small blue cube, a medium yellow cube, and a tall red cube. This arrangement visually represents increasing data or progress
Free with trial Toy figurines arranged on colorful blocks to create a bar graph, representing population growth, demographic trends, and social statistics. Decrease business development illustrations Toy figurines standing on colorful blocks forming a bar graph, symbolizing population growth, demographic trends, and social. Toy figurines arranged on colorful blocks to create a bar graph, representing population growth, demographic trends, and social statistics
Free with trial Hand interacting with a red downward trend line against a blue bar graph background image. Generative AI. Decrease business development illustrations Hand interacting with a red downward trend line against a blue bar graph background image
Free with trial A minimalist 3D render displays three rounded rectangular bars representing a bar graph. The tallest bar is a soft blue, followed by a medium green bar, and the shortest is a light pink bar. They are arranged in descending order of height and stand on a plain white background, suggesting data visualization or progress. Decrease business development illustrations Three colorful 3D bar graph elements in blue green and pink on a white background chart. A minimalist 3D render displays three rounded rectangular bars representing a bar graph. The tallest bar is a soft blue, followed by a medium green bar, and the shortest is a light pink bar. They are arranged in descending order of height and stand on a plain white background, suggesting data visualization or progress
Free with trial GDP decline indicated by arrow on digital global map highlight economic indicator across a geographical area. Decrease business development illustrations GDP decline indicated by arrow on digital global map highlight economic indicator across a geographical area
Free with trial A 3D rendered image of a businessman presenting financial data on a large screen, showing various charts and graphs. Decrease business development illustrations Businessman Presenting Financial Charts and Graphs. A 3D rendered image of a businessman presenting financial data on a large screen, showing various charts and graphs.
Free with trial A 3D rendered graphic depicts a bar chart with three vertical bars of varying heights: two blue bars flanking a taller yellow bar. At the top of the yellow bar, a central yellow sphere is connected by white rods to two smaller blue spheres, resembling a molecular structure or a network. The entire graphic is isolated on a white background, suggesting concepts of data analysis, growth, and. Decrease business development illustrations 3D Rendered Bar Chart with Connecting Spheres Representing Data Analysis graph statistics. A 3D rendered graphic depicts a bar chart with three vertical bars of varying heights: two blue bars flanking a taller yellow bar. At the top of the yellow bar, a central yellow sphere is connected by white rods to two smaller blue spheres, resembling a molecular structure or a network. The entire graphic is isolated on a white background, suggesting concepts of data analysis, growth, and
Free with trial 3D Colorful Charts Magnifier Analysis, Data Visualization, Market Research ,chart,magnifying glass , This photo was created using generative AI. Decrease business development illustrations 3D Colorful Charts Magnifier Analysis, Data Visualization, Market Research ,chart,magnifying glass
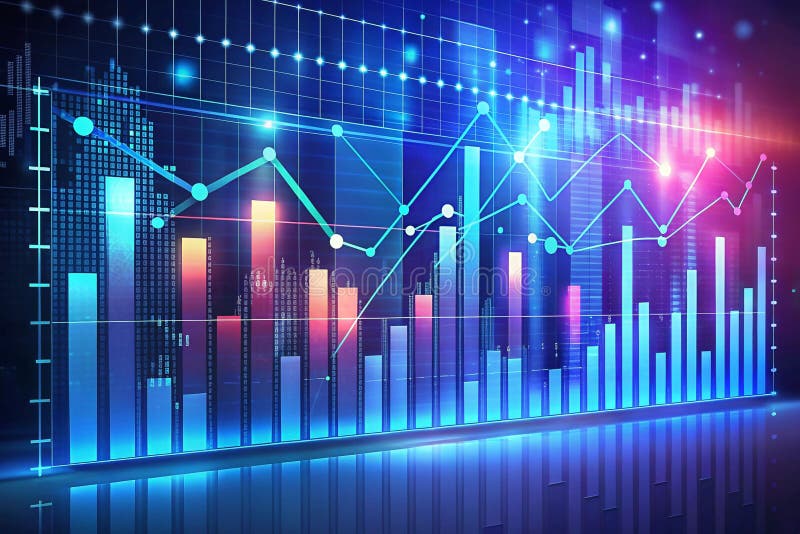
Free with trial Futuristic financial data visualization with graphs and charts showing growth and market trends. Decrease business development illustrations Futuristic financial data visualization with graphs and charts showing growth and market trends
Free with trial A striking graph illustrates opposing trends one line sharply decreases while another rises, enveloped in warm orange hues that evoke energy and transformation. Decrease business development illustrations Dynamic Trends Displayed Through Contrasting Lines in Shades of Orange With a Vivid Background. A striking graph illustrates opposing trends one line sharply decreases while another rises, enveloped in warm orange hues that evoke energy and transformation
Free with trial Captivating digital transformation concept featuring hands on a keyboard, complemented by animated quality and cost graphics, set against a sleek dark background. Qubit. Decrease business development illustrations Digital Transformation Concept with Hands on Keyboard and Animated Quality and Cost Graphic in Dark Background. Qubit. Captivating digital transformation concept featuring hands on a keyboard, complemented by animated quality and cost graphics, set against a sleek dark background. Qubit
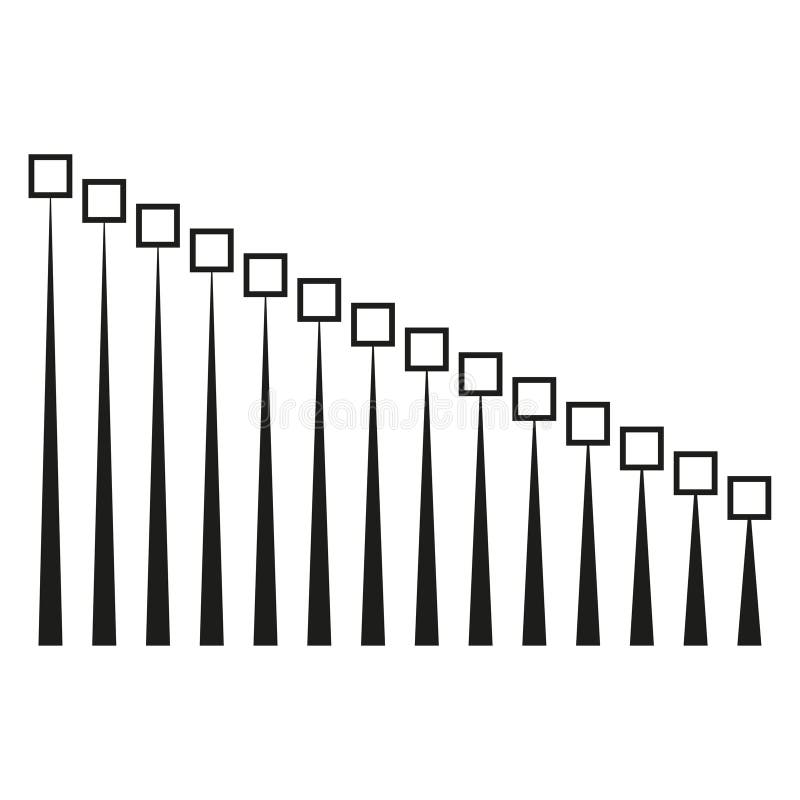
Free with trial Decreasing line graphic. Square point Vector. Minimalist progress chart. Data sequence illustration. EPS 10. Decrease business development vectors Decreasing line graphic. Square point Vector. Minimalist progress chart. Data sequence illustration.
Free with trial A graph visually depicts two distinct lines, one showing a pronounced increase while the other reflects a steady decline, all presented in striking orange tones. Decrease business development illustrations Trends in Data Representation Illustrating Contrasting Growth and Decline Patterns in Vibrant Hues. A graph visually depicts two distinct lines, one showing a pronounced increase while the other reflects a steady decline, all presented in striking orange tones
Free with trial Is driving the increase or decrease in South Korean oil prices. Global economic instability, market volatility, and the growing demand for energy security are represented by the combination of an oil pump jack, oil barrels, and the national flag of South Korea. Decrease business development illustrations The backdrop of geopolitical challenges and economic volatility. Is driving the increase or decrease in South Korean oil prices. Global economic instability. is driving the increase or decrease in South Korean oil prices. Global economic instability, market volatility, and the growing demand for energy security are represented by the combination of an oil pump jack, oil barrels, and the national flag of South Korea.Global economic instability, market volatility, and the growing demand for energy security are represented by the combination of an oil pump jack, oil barrels, and the national flag of South Korea.
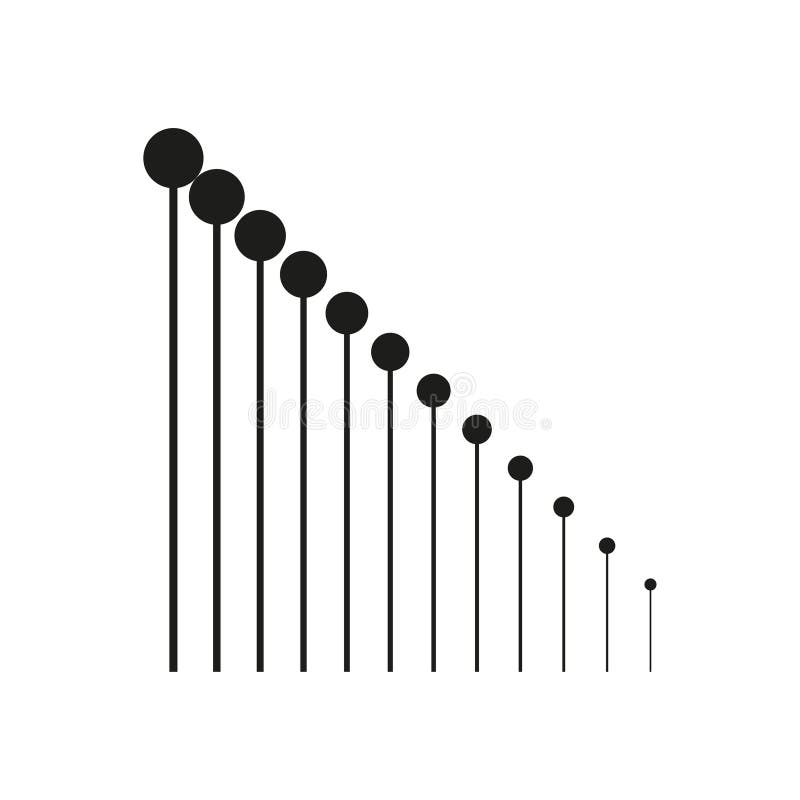
Free with trial Decreasing line graphic. Circle point Vector. Minimalist growth chart. Data progression illustration. EPS 10. Decrease business development vectors Decreasing line graphic. Circle point Vector. Minimalist growth chart. Data progression illustration.
Free with trial Collage image poster illustration retro young guy holding arrow move up rise success among point down career goal challenge template. Decrease business development illustrations Collage image poster illustration retro young guy holding arrow move up rise success among point down career goal
Free with trial A man standing in front of a chart with an arrow pointing to it, analyzing sales growth data, Worker analyzes sales growth graph, Simple and minimalist flat Vector Illustration. Decrease business development vectors A man standing in front of a chart with an arrow pointing to it, analyzing sales growth data, Worker analyzes sales growth graph
Free with trial Composite trend artwork photo collage of office manager young woman rich earn work arrow down loss money hand hold banknote stand ladder. Decrease business development illustrations Composite trend artwork photo collage of office manager young woman rich earn work arrow down loss money hand hold
Free with trial A 3D rendering of a small house model with a dollar sign on a seesaw, balanced against stacks of coins and a downward trending arrow. Generative AI. Decrease business development illustrations A 3D rendering of a small house model with a dollar sign on a seesaw, balanced against stacks of coins and a downward trending
Free with trial Three-dimensional rectangular bars stand side-by-side on a white background. The bars are of different heights, with the shortest on the left, a medium-height bar in the middle, and the tallest bar on the right. The bars are colored blue, pink, and orange, respectively. This arrangement visually represents a bar chart or graph, suggesting concepts of growth, data comparison, or progress. Decrease business development illustrations Three 3D Rendered Rectangular Bars of Varying Heights and Colors on a White Background bar chart. Three-dimensional rectangular bars stand side-by-side on a white background. The bars are of different heights, with the shortest on the left, a medium-height bar in the middle, and the tallest bar on the right. The bars are colored blue, pink, and orange, respectively. This arrangement visually represents a bar chart or graph, suggesting concepts of growth, data comparison, or progress
Free with trial Three black, rounded, vertical bars of progressively increasing height are displayed against a clean white background. The bars are smooth and have a matte finish. This visual representation suggests concepts of growth, progress, data analysis, or a simple bar graph. Decrease business development illustrations Three black rounded bars of increasing height on a white background bar chart graph. Three black, rounded, vertical bars of progressively increasing height are displayed against a clean white background. The bars are smooth and have a matte finish. This visual representation suggests concepts of growth, progress, data analysis, or a simple bar graph
Free with trial Magnifying glass over bar graph, symbolizes research, analysis, insights, growth, and strategy. Can be used for display or montage your products. Empty Space for display your products, copy space ,banner, advertising. Generative AI. Decrease business development illustrations Data Analysis and Market Research Magnifying glass over bar graph symbolizes research analysis insights growth and strategy. Magnifying glass over bar graph, symbolizes research, analysis, insights, growth, and strategy. Can be used for display or montage your products. Empty Space for display your products, copy space ,banner, advertising. Generative AI
Free with trial Using clean energy from nature, the concept of reducing net zero greenhouse gas emissions. Decrease business development illustrations Using clean energy from nature, the concept of reducing net zero greenhouse gas emissions
Free with trial Using clean energy from nature, the concept of reducing net zero greenhouse gas emissions. Decrease business development illustrations Using clean energy from nature, the concept of reducing net zero greenhouse gas emissions