Free with trial Red percent sign with downward arrow. Decrease business graph step illustrations Rapid Percent decrease. Red percent sign with downward arrow
Free with trial Red percent sign with downward arrow. Decrease business graph step illustrations Percent decrease. Red percent sign with downward arrow
Free with trial Business failure and bakruptcy vector illustration concept. Businessman on steps leading to stock market crash, crisis, recession, decline. Eps10 vector illustration. Decrease business graph step vectors Business failure and bakruptcy vector illustration concept. Businessman on steps leading to stock market crash, crisis
Free with trial Infographic and chart icon set 5, eps10. Decrease business graph step illustrations Infographic and chart icon set 5, eps10
Free with trial Steps of recession, decrease business concept. Blue arrow depict decline business. Flat illustration of downward arrow. Vector template element for infographic, web, presentation, social networks. Decrease business graph step vectors Recession, decline business arrow. Decreasing graph flat vector. Steps of recession, decrease business concept. Blue arrow depict decline business. Flat illustration of downward arrow. Vector template element for infographic, web, presentation, social networks.
Free with trial Chart graph. Black Icon growth and downward with arrow isolated on background. Hologram positive, fall percentage. Design business concept direction growth, recession. Analysis. Vector illustration. Decrease business graph step vectors Chart graph. Black Icon growth and downward with arrow. Hologram positive, fall percentage. Design business. Vector illustration. Chart graph. Black Icon growth and downward with arrow isolated on background. Hologram positive, fall percentage. Design business concept direction growth, recession. Analysis. Vector illustration
Free with trial Timeline chart infographic template elements. Flat vector illustration of business development steps. Isolated infographics arrow symbols for web, internet, print, presentations, social networks. Decrease business graph step vectors Timeline infographic vector template elements. Business development steps arrows chart. Timeline chart infographic template elements. Flat vector illustration of business development steps. Isolated infographics arrow symbols for web, internet, print, presentations, social networks.
Free with trial Bitcoin exchange, Graph chart and Savings insurance line icons set. Timeline infograph speech bubble. Download arrow sign. Cryptocurrency change, Growth report, Money exchange. Crisis. Vector. Decrease business graph step vectors Bitcoin exchange, Graph chart and Savings insurance icons set. Download arrow sign. Vector. Bitcoin exchange, Graph chart and Savings insurance line icons set. Timeline infograph speech bubble. Download arrow sign. Cryptocurrency change, Growth report, Money exchange. Crisis. Vector
Free with trial Lawyer, Web report and Logistics network line icons set. Timeline infograph speech bubble. Engineer sign. Court judge, Graph chart, International tracking. Worker profile. Business set. Vector. Decrease business graph step vectors Lawyer, Web report and Logistics network icons set. Engineer sign. Vector. Lawyer, Web report and Logistics network line icons set. Timeline infograph speech bubble. Engineer sign. Court judge, Graph chart, International tracking. Worker profile. Business set. Vector
Free with trial Winner, Uv protection and Financial diagram line icons set. Timeline process infograph. Loan percent sign. Best results, Skin cream, Candlestick chart. Decrease rate. Business set. Vector. Decrease business graph step vectors Winner, Uv protection and Financial diagram icons set. Loan percent sign. Vector. Winner, Uv protection and Financial diagram line icons set. Timeline process infograph. Loan percent sign. Best results, Skin cream, Candlestick chart. Decrease rate. Business set. Vector
Free with trial Partnership, Project edit and 3d chart line icons set. Timeline process infograph. Idea sign. Business startup, Settings, Presentation column. Light bulb. Science set. Vector. Decrease business graph step vectors Partnership, Project edit and 3d chart icons set. Idea sign. Business startup, Settings, Presentation column. Vector. Partnership, Project edit and 3d chart line icons set. Timeline process infograph. Idea sign. Business startup, Settings, Presentation column. Light bulb. Science set. Vector
Free with trial Vector illustration of people climbing ladder. Decrease business graph step vectors To The Top. Vector illustration of people climbing ladder
Free with trial Infographic and chart icon set 3, vector eps10. Decrease business graph step vectors Infographic and chart icon set 3, vector eps10
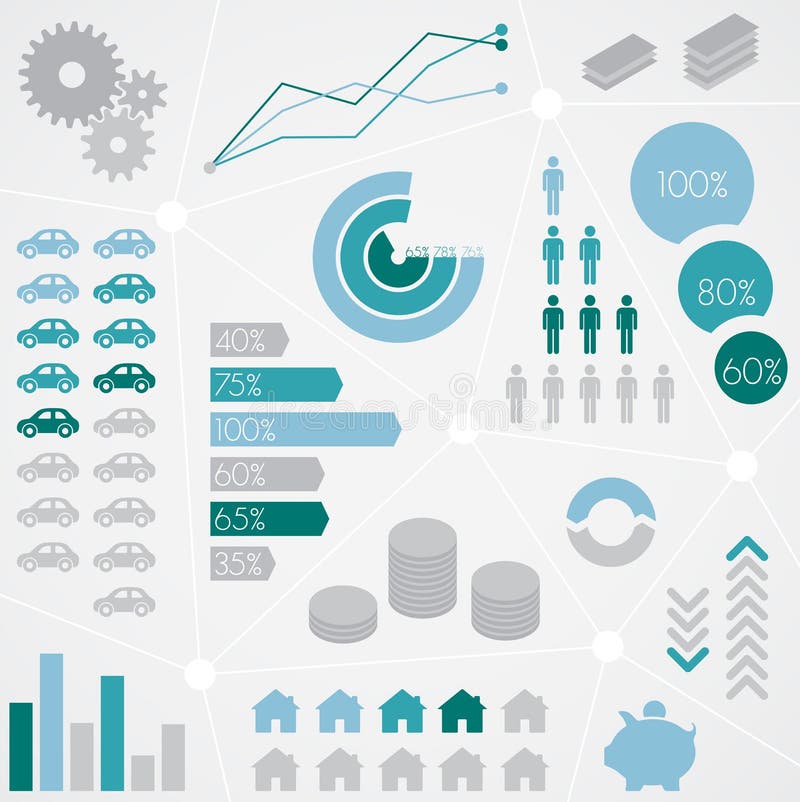
Free with trial Finance Statistical Info Graphic Set vector made in illustrator. Decrease business graph step vectors Finance Statistical Info Graphic Set
Free with trial Chart of development and decrease of the activity in work of the company or market (red and green schedules). Decrease business graph step illustrations Green schedule of growth and red - falling. Chart of development and decrease of the activity in work of the company or market (red and green schedules)
Free with trial Dollars failure 3d, problem of currency. Decrease business graph step illustrations Dollars failure 3d
Free with trial Concrete blocks form a downward arrow graph. Business concept of decline, crisis, or falling market trend. Financial data visualization. Decrease business graph step illustrations Concrete blocks form a downward arrow graph. Business concept of decline, crisis, or falling market trend
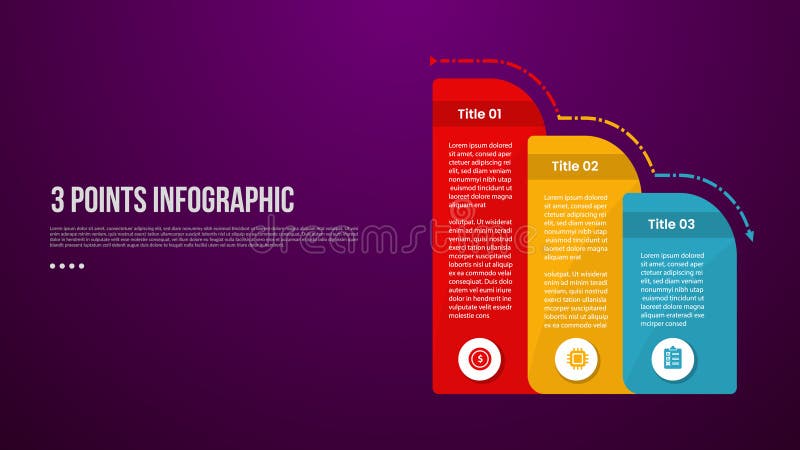
Free with trial 3 points or step process infographic with round box container decrease gradually with modern dark style for slide presentation vector. Decrease business graph step illustrations 3 points or step process infographic with round box container decrease gradually with modern dark style for slide presentation
Free with trial Chart icon and graph for statistic line or bar diagram with growth pie and graphic data. Use for analysis trend and pictogram by profit algorithm report. Business infographic title. Vector. Decrease business graph step vectors Chart icon and graph for statistic line or bar diagram with growth pie and graphic data. Use for analysis trend and
Free with trial A stressed businessman in a suit stands on steps against a wall, holding a downward-trending red arrow graph, symbolizing economic recession, market decline, and financial crisis. The image represents business failure, loss, and negative trends, but also offers potential for problem-solving and finding solutions, generated by AI. Decrease business graph step illustrations Businessman holding downward trending red arrow graph. A stressed businessman in a suit stands on steps against a wall, holding a downward-trending red arrow graph, symbolizing economic recession, market decline, and financial crisis. The image represents business failure, loss, and negative trends, but also offers potential for problem-solving and finding solutions, generated by AI.
Free with trial A stark white 3D representation of a jagged line graph is depicted against a clean white background. The graph's peaks and valleys form a distinct downward trend, suggesting a decline or loss. The sharp angles and minimalist design emphasize the concept of a negative trajectory. The object casts a subtle shadow, adding depth and dimension to the isolated graphic. Decrease business graph step illustrations White 3D Jagged Line Graph Showing Downward Trend on White Background chart decline. A stark white 3D representation of a jagged line graph is depicted against a clean white background. The graph's peaks and valleys form a distinct downward trend, suggesting a decline or loss. The sharp angles and minimalist design emphasize the concept of a negative trajectory. The object casts a subtle shadow, adding depth and dimension to the isolated graphic
Free with trial Stacked cubes with red arrow down symbols showing step by step decreasing trend and negative growth. Generative AI. Decrease business graph step illustrations Stacked cubes with red arrow down symbols showing step by step decreasing trend and negative growth
Free with trial Visualize complex market trends and strategy using this metallic, AI-generated bar chart illustration. Perfect for financial reports, planning presentations, and investor materials that require a sophisticated, high-impact visual representation of business growth, decline, and future success. Decrease business graph step illustrations Conceptual 3D business bar chart illustrating market performance, showing initial decline followed by upward growth. Visualize complex market trends and strategy using this metallic, AI-generated bar chart illustration. Perfect for financial reports, planning presentations, and investor materials that require a sophisticated, high-impact visual representation of business growth, decline, and future success.
Free with trial A vibrant 3D bar chart icon isolated on a clean white background. This minimalist data visualization features five colorful bars in a soft, pastel palette of yellow, pink, and purple, arranged in descending order. The clean, modern render is perfect for illustrating concepts like business statistics, financial reports, market analysis, and performance metrics. An ideal graphic element for presentations, infographics, websites, and educational materials, symbolizing data, comparison, and analytics in a visually appealing way. 3D illustration. Decrease business graph step illustrations 3D Colorful Bar Chart for Business and Data Analysis. A vibrant 3D bar chart icon isolated on a clean white background. This minimalist data visualization features five colorful bars in a soft, pastel palette of yellow, pink, and purple, arranged in descending order. The clean, modern render is perfect for illustrating concepts like business statistics, financial reports, market analysis, and performance metrics. An ideal graphic element for presentations, infographics, websites, and educational materials, symbolizing data, comparison, and analytics in a visually appealing way. 3D illustration.
Free with trial Concept of growing percentage up. Arrow up and rising graph as concept of interest rate growth, price increase, trader profit, financial success and business goal. Infographic design element. Decrease business graph step vectors Concept of growing percentage up. Arrow up and rising graph as concept of interest rate growth, price increase, trader profit
Free with trial Set Financial growth decrease and Sales funnel with chart icon. Vector. Decrease business graph step illustrations Set Financial growth, decrease and Sales funnel with chart icon. Vector
Free with trial Set Financial growth decrease Sales funnel with chart and Pie infographic icon. Vector. Decrease business graph step vectors Set Financial growth decrease, Sales funnel with chart and Pie infographic icon. Vector
Free with trial A striking red 3D arrow is constructed from a series of connected cubes that gradually decrease in size as they form the arrow's shaft. The arrow points downwards and to the right, suggesting a trend or decline. The entire object is rendered in sharp detail against a clean white background. Decrease business graph step illustrations Red 3D Arrow Composed of Cubes Progressing Downward on White Background blocks. A striking red 3D arrow is constructed from a series of connected cubes that gradually decrease in size as they form the arrow's shaft. The arrow points downwards and to the right, suggesting a trend or decline. The entire object is rendered in sharp detail against a clean white background
Free with trial An abstract image featuring four cylindrical shapes of varying heights, arranged in a descending order. The cylinders are dark, with the tops illuminated by a warm, golden light. The background gradients from a warm orange to a darker brown, creating a sense of depth and mystery. This image conveys concepts of decline, progress, or stages, and can be used to represent business trends, data visualization, or abstract concepts. Decrease business graph step illustrations Abstract Cylinders in Dim Light. An abstract image featuring four cylindrical shapes of varying heights, arranged in a descending order. The cylinders are dark, with the tops illuminated by a warm, golden light. The background gradients from a warm orange to a darker brown, creating a sense of depth and mystery. This image conveys concepts of decline, progress, or stages, and can be used to represent business trends, data visualization, or abstract concepts.
Free with trial A hand places a block on a decreasing bar graph, symbolizing cost reduction, with a magnifying glass highlighting the word COST. Decrease business graph step illustrations Cost Reduction Strategy Illustrated with Blocks and Magnifying Glass. A hand places a block on a decreasing bar graph, symbolizing cost reduction, with a magnifying glass highlighting the word COST
Free with trial Descending white cylinder steps. Empty podium for product display. Bar chart and business decline or failure. Financial profit loss and economic crisis. 3D render. Decrease business graph step illustrations Descending white cylinder steps. Empty podium for product display
Free with trial Arrow Trending Down : Arrow trending down represents decline, decrease, or negative trend. Decrease business graph step vectors Arrow Trending Down
Free with trial A diverse collection of downward-pointing arrows presented against a clean, light grey background. The arrows vary in style, including solid black, outlined, and shaded grey designs. This graphic element is ideal for representing direction, decline, progress, or a list of instructions. Its versatile design makes it suitable for web graphics, presentations, infographics, and print materials. Decrease business graph step vectors Collection of Downward Arrows in Various Styles. A diverse collection of downward-pointing arrows presented against a clean, light grey background. The arrows vary in style, including solid black, outlined, and shaded grey designs. This graphic element is ideal for representing direction, decline, progress, or a list of instructions. Its versatile design makes it suitable for web graphics, presentations, infographics, and print materials.
Free with trial A red zigzag arrow points downwards, descending a staircase made of beige blocks against a light blue background , image generative using ai tools. Decrease business graph step illustrations Red downward trending arrow on a staircase of blocks. A red zigzag arrow points downwards, descending a staircase made of beige blocks against a light blue background , image generative using ai tools
Free with trial Of wooden cubes arranged perfectly in a structured staircase pattern on a white table surface highlighted by natural dramatic warm morning sunlight. Decrease business graph step illustrations Ai generated of wooden cubes stacked in a staircase shape. Ai generated of wooden cubes arranged perfectly in a structured staircase pattern on a white table. of wooden cubes arranged perfectly in a structured staircase pattern on a white table surface highlighted by natural dramatic warm morning sunlight
Free with trial The image depicts a 3D bar chart with blue steps increasing in height, representing growth or progress. A red arrow curves upward on the left side, symbolizing an upward trend or improvement, while a red arrow curves downward on the right side, indicating a decline or negative trend. This visual contrast highlights the duality of progress and setbacks. Decrease business graph step illustrations Graphic showing contrasting upward and downward trends in a step-based chart. The image depicts a 3D bar chart with blue steps increasing in height, representing growth or progress. A red arrow curves upward on the left side, symbolizing an upward trend or improvement, while a red arrow curves downward on the right side, indicating a decline or negative trend. This visual contrast highlights the duality of progress and setbacks
Free with trial This image showcases two contrasting bar charts, constructed from red and white blocks, generated by AI. One chart depicts growth, while the other illustrates decline, offering a visual representation of opposing trends. The use of color and simple shapes makes it easily understandable. Decrease business graph step illustrations AI-Generated Block Charts: Growth & Decline. This image showcases two contrasting bar charts, constructed from red and white blocks, generated by AI. One chart depicts growth, while the other illustrates decline, offering a visual representation of opposing trends. The use of color and simple shapes makes it easily understandable.
Free with trial Word "RISK" on decrease business graph step, finance diagram with down arrows on white blocks on red background. Financial crisis, bankruptcy, loss investment economic recession sales risk concepts. Decrease business graph step illustrations Word \'RISK\' on decrease business graph step, finance diagram with down arrows on white blocks on red background. Word "RISK" on decrease business graph step, finance diagram with down arrows on white blocks on red background. Financial crisis, bankruptcy, loss investment economic recession sales risk concepts.
Free with trial Increase, recession, growth, decline, success business flat concept illustration. Graph arrows depict steps of increase and decrease business. Vector elements for infographic, presentation, networks. Decrease business graph step vectors Increase, recession, growth, decline, step business arrows. Flat. Increase, recession, growth, decline, success business flat concept illustration. Graph arrows depict steps of increase and decrease business. Vector elements for infographic, presentation, networks.
Free with trial Business Finance Crisis Concept. Blindfold Businesswoman Step by Dollar Coins near Arrow Diagram Fall Down. Decrease Economy Sale Drop. Investor Bankrupt Lost Money Cartoon Flat Vector Illustration. Decrease business graph step vectors Business Finance Crisis Concept. Blindfold Businesswoman Step by Dollar Coins near Arrow Diagram Fall Down
Free with trial Minimal white stair step progress increase and decrease graph on blue background 3D rendering illustration. Decrease business graph step illustrations White stair step growth graph way to success 3D render illustration. Minimal white stair step progress increase and decrease graph on blue background 3D rendering illustration
Free with trial Business Finance Crisis Website Landing Page. Blindfold Businesswoman Step by Dollar Coins near Arrow Diagram Fall Down. Investor Bankrupt Lost Money Web Page Banner. Cartoon Flat Vector Illustration. Decrease business graph step vectors Business Finance Crisis Website Landing Page. Blindfold Businesswoman Step by Dollar Coins near Arrow Diagram Fall Down
Free with trial Graph down. Black Icon graph decline with arrow isolated on white background. Hologram statistic. Deficit direction for business concept design. Analysis information forecast. Vector illustration. Decrease business graph step vectors Graph down. Black Icon graph decline with arrow isolated on white background. Hologram deficit direction for business design. Graph down. Black Icon graph decline with arrow isolated on white background. Hologram statistic. Deficit direction for business concept design. Analysis information forecast. Vector illustration
Free with trial Businessman and stock market arrow presentation. Cheerful businessman with graph indicating increase. The concept of business success. Can be used for workflow layout, banner, diagram, number options, step up options, web design, timeline, infographic template. Vector illustration. Decrease business graph step vectors Businessman and stock market arrow presentation.Cheerful businessman with graph indicating increase.The concept of business
Free with trial Graph down. Black icon graph decline with arrow isolated on white background. Hologram statistic. Deficit direction for business concept design. Analysis information forecast. Vector illustration. Decrease business graph step vectors Graph down. Black icon graph decline with arrow. Hologram statistic. Deficit direction business. Analysis information forecast. Graph down. Black icon graph decline with arrow isolated on white background. Hologram statistic. Deficit direction for business concept design. Analysis information forecast. Vector illustration
Free with trial Arrows shape growth and decrease elements with steps,options,processes or workflow. Business data visualization. Decrease business graph step vectors Arrows shape growth and decrease elements with steps,options,processes or workflow.Business data visualization
Free with trial Vector decrease graph icon. Diagram icon. Stock vector illustration on white. Decrease business graph step illustrations Vector decrease graph icon. Diagram icon. Stock vector illustration isolated on white background. Vector decrease graph icon. Diagram icon. Stock vector illustration on white
Free with trial Set Financial growth decrease Pie chart infographic and Sales funnel with. Business infographic template. Vector. Decrease business graph step vectors Set Financial growth decrease, Pie chart infographic and Sales funnel with. Business infographic template. Vector
Free with trial Set Financial growth decrease Pie chart infographic and Sales funnel with. Business infographic template. Vector. Decrease business graph step illustrations Set Financial growth decrease, Pie chart infographic and Sales funnel with. Business infographic template. Vector
Free with trial Abstract business background with a green graph and arrow on a wooden table. Decrease business graph step vectors Abstract green graph with arrow on wooden table. Abstract business background with a green graph and arrow on a wooden table
Free with trial Red downward arrow on gloomy black. Step by step decrease, economic or financial crisis, recession, market and price concept. Flat design. EPS 8 vector illustration, no transparency, no gradients. Decrease business graph step vectors Arrow, incremental decrease, crisis. Red downward arrow on gloomy black. Step by step decrease, economic or financial crisis, recession, market and price concept. Flat design. EPS 8 vector illustration, no transparency, no gradients
Free with trial Graph chart, 5g internet and Confirmed line icons set. Timeline process infograph. Cloud sync sign. Growth report, Wifi quality, Accepted message. Synchronize storage. Business set. Vector. Decrease business graph step vectors Graph chart, 5g internet and Confirmed icons set. Cloud sync sign. Vector. Graph chart, 5g internet and Confirmed line icons set. Timeline process infograph. Cloud sync sign. Growth report, Wifi quality, Accepted message. Synchronize storage. Business set. Vector
Free with trial Business podium, Efficacy and Hand click line icons set. Timeline process flowchart. Pie chart sign. Team nomination, Business chart, Location pointer. 3d graph. Education set. Vector. Decrease business graph step vectors Business podium, Efficacy and Hand click icons set. Pie chart sign. Vector. Business podium, Efficacy and Hand click line icons set. Timeline process flowchart. Pie chart sign. Team nomination, Business chart, Location pointer. 3d graph. Education set. Vector
Free with trial Face biometrics, Santa boots and Diagram graph line icons set. Timeline process infograph. Savings sign. Facial recognition, New year, Presentation chart. Finance currency. Business set. Vector. Decrease business graph step vectors Face biometrics, Santa boots and Diagram graph icons set. Savings sign. Vector. Face biometrics, Santa boots and Diagram graph line icons set. Timeline process infograph. Savings sign. Facial recognition, New year, Presentation chart. Finance currency. Business set. Vector
Free with trial World money, Graph chart and Loan percent line icons set. Timeline process infograph. Shopping bag sign. Global markets, Get report, Decrease rate. Supermarket discounts. Finance set. Vector. Decrease business graph step vectors World money, Graph chart and Loan percent icons set. Shopping bag sign. Vector. World money, Graph chart and Loan percent line icons set. Timeline process infograph. Shopping bag sign. Global markets, Get report, Decrease rate. Supermarket discounts. Finance set. Vector
Free with trial Colorful cylinders. Bar graph, column chart elements for finance statistical infographic. Growth or decrease signs. Vector 3d illustration. Decrease business graph step vectors Colorful cylinders. Bar graph, column chart elements for finance statistical infographic. Growth or decrease signs
Free with trial Colorful and white cylinders. Bar graph, column chart elements for finance statistical infographic. Growth and decrease signs. Vector 3d illustration. Decrease business graph step vectors Colorful and white cylinders. Bar graph, column chart elements for finance statistical infographic. Growth and decrease
Free with trial Analytics graph, Approved and Private payment line icons set. Timeline infograph speech bubble. Business statistics sign. Chart report, Winner badge, Secure finance. Working report. Vector. Decrease business graph step vectors Analytics graph, Approved and Private payment icons set. Business statistics sign. Vector. Analytics graph, Approved and Private payment line icons set. Timeline infograph speech bubble. Business statistics sign. Chart report, Winner badge, Secure finance. Working report. Vector
Free with trial Scroll down, Wind energy and Checklist line icons set. Timeline infograph speech bubble. Swipe up sign. Swipe arrow, Breeze power, Graph report. Scrolling screen. Business set. Vector. Decrease business graph step vectors Scroll down, Wind energy and Checklist icons set. Swipe up sign. Swipe arrow, Breeze power, Graph report. Vector. Scroll down, Wind energy and Checklist line icons set. Timeline infograph speech bubble. Swipe up sign. Swipe arrow, Breeze power, Graph report. Scrolling screen. Business set. Vector
Free with trial New star, Puzzle and Analytics graph line icons set. Timeline infograph speech bubble. Mini pc sign. Shopping, Engineering strategy, Chart report. Computer. Business set. Vector. Decrease business graph step vectors New star, Puzzle and Analytics graph icons set. Mini pc sign. Shopping, Engineering strategy, Chart report. Vector. New star, Puzzle and Analytics graph line icons set. Timeline infograph speech bubble. Mini pc sign. Shopping, Engineering strategy, Chart report. Computer. Business set. Vector
Free with trial Report, Graph chart and Vacancy icons simple set. Idea, Paint brush and Share signs. Presentation document, Growth report. Education set. Infographic template. 6 steps timeline. Business options. Decrease business graph step vectors Report, Graph chart and Vacancy icons set. Idea, Paint brush and Share signs. Vector. Report, Graph chart and Vacancy icons simple set. Idea, Paint brush and Share signs. Presentation document, Growth report. Education set. Infographic template. 6 steps timeline. Business options
Free with trial 3D Illustration decrease wood brick chart round. Decrease business graph step illustrations Decrease wood brick chart round 2. 3D Illustration decrease wood brick chart round
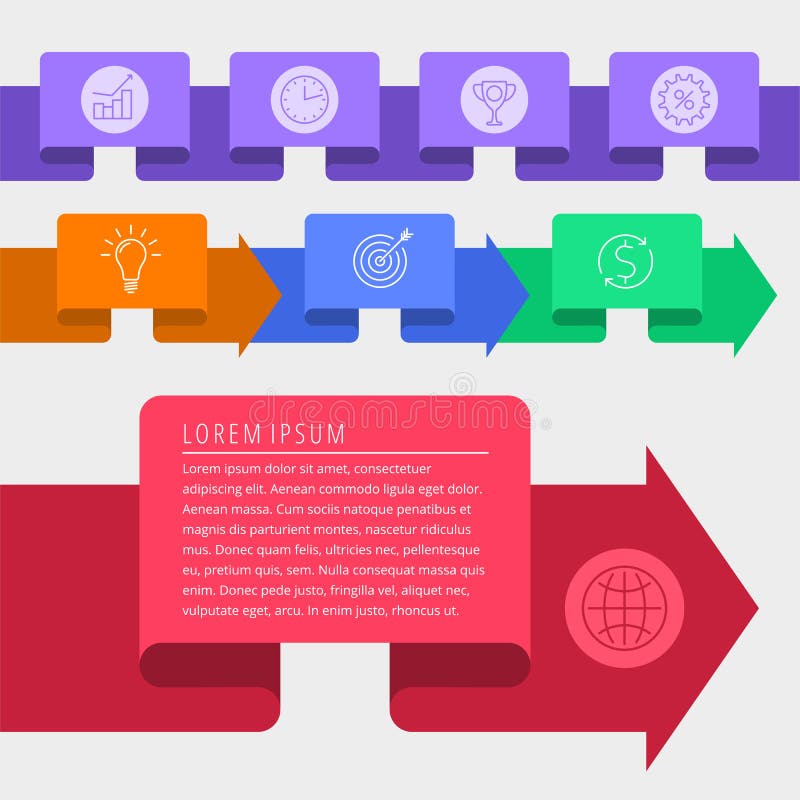
Free with trial Business Infographic icons - Vector Illustration. Decrease business graph step vectors Business Infographic sign. Business Infographic icons - Vector Illustration
Free with trial Diagram Graph And Financial Charts icons set with white background. Thin Line Style stock vector. Decrease business graph step vectors Diagram Graph And Financial Charts icons set with white background.
Free with trial Infographics elements with vector graphs and charts. Business presentation info graphic templates with bar graphs, statistic data step and pie charts, timeline, process and option diagrams. Decrease business graph step vectors Infographics elements with graphs and charts. Infographics elements with vector graphs and charts. Business presentation info graphic templates with bar graphs, statistic data step and pie charts, timeline, process and option diagrams
Free with trial Simple Chart graph diagram bar histograms. Decrease business graph step vectors Chart graph diagram bar histograms
Free with trial Simple Chart graph diagram bar histograms. Decrease business graph step vectors Chart graph diagram bar histograms
Free with trial Simple Chart graph diagram bar histograms. Decrease business graph step vectors Chart graph diagram bar histograms
Free with trial Simple Chart graph diagram bar histograms. Decrease business graph step vectors Chart graph diagram bar histograms
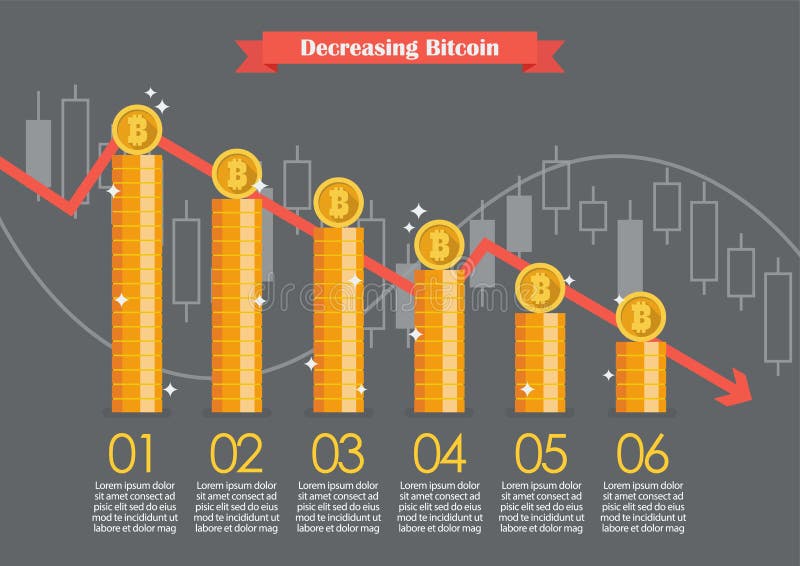
Free with trial Bitcoin with graph down infographic. Financial concept. Decrease business graph step vectors Bitcoin with graph down infographic
Free with trial Decrease of coin stacks bars and shattered coin. 3d rendering. Decrease business graph step illustrations Decrease of coin stacks bars and shattered coin
Free with trial Businessman being crushed by Failure word, business failure and bankruptcy concept. Decrease business graph step vectors Business failure and bankruptcy concept
Free with trial Edit document, Diagram graph and Seo gear line icons set. Timeline process flowchart. Employee sign. Page with pencil, Presentation chart, Web settings. Cogwheel. Technology set. Vector. Decrease business graph step vectors Edit document, Diagram graph and Seo gear icons set. Employee sign. Vector. Edit document, Diagram graph and Seo gear line icons set. Timeline process flowchart. Employee sign. Page with pencil, Presentation chart, Web settings. Cogwheel. Technology set. Vector
Free with trial Ladder to success, progress and regress in business concept, sad businesswoman step down and happy businesswoman step up. Decrease business graph step vectors Progress and regress in business concept, vector illustration. Ladder to success, progress and regress in business concept, sad businesswoman step down and happy businesswoman step up
Free with trial Chart, Decreasing graph and Income money line icons set. Timeline plan infograph. Cashback card sign. Presentation chart, Savings, Money payment. Finance set. Infographics process timeline. Vector. Decrease business graph step vectors Chart, Decreasing graph and Income money icons set. Cashback card sign. Vector. Chart, Decreasing graph and Income money line icons set. Timeline plan infograph. Cashback card sign. Presentation chart, Savings, Money payment. Finance set. Infographics process timeline. Vector
Free with trial Diagram graph, Smartphone holding and Surprise boxes line icons set. Timeline process infograph. Confirmed sign. Presentation chart, Phone, Holiday gifts. Accepted message. Business set. Vector. Decrease business graph step vectors Diagram graph, Smartphone holding and Surprise boxes icons set. Confirmed sign. Vector. Diagram graph, Smartphone holding and Surprise boxes line icons set. Timeline process infograph. Confirmed sign. Presentation chart, Phone, Holiday gifts. Accepted message. Business set. Vector
Free with trial Lightning bolt, Graph chart and Share line icons set. Timeline process flowchart. Verify sign. Messenger, Get report, Referral person. Selected choice. Education set. Vector. Decrease business graph step vectors Lightning bolt, Graph chart and Share icons set. Verify sign. Messenger, Get report, Referral person. Vector. Lightning bolt, Graph chart and Share line icons set. Timeline process flowchart. Verify sign. Messenger, Get report, Referral person. Selected choice. Education set. Vector
Free with trial Graph chart, Air conditioning and Timer line icons set. Timeline process infograph. Credit card sign. Get report, Snowflake, Stopwatch. Loan percent. Technology set. Infographics plan timeline. Vector. Decrease business graph step vectors Graph chart, Air conditioning and Timer icons set. Credit card sign. Get report, Snowflake, Stopwatch. Vector. Graph chart, Air conditioning and Timer line icons set. Timeline process infograph. Credit card sign. Get report, Snowflake, Stopwatch. Loan percent. Technology set. Infographics plan timeline. Vector
Free with trial Question mark, Calendar graph and Safe time line icons set. Timeline process flowchart. 360 degrees sign. Quiz chat, Annual report, Hold clock. Full rotation. Technology set. Vector. Decrease business graph step vectors Question mark, Calendar graph and Safe time icons set. 360 degrees sign. Quiz chat, Annual report, Hold clock. Vector. Question mark, Calendar graph and Safe time line icons set. Timeline process flowchart. 360 degrees sign. Quiz chat, Annual report, Hold clock. Full rotation. Technology set. Vector
Free with trial Bitcoin, Euro money and Cash line icons set. Timeline plan infograph. Graph chart sign. Cryptocurrency coin, Receive cash, Atm payment. Growth report. Finance set. Vector. Decrease business graph step vectors Bitcoin, Euro money and Cash icons set. Graph chart sign. Cryptocurrency coin, Receive cash, Atm payment. Vector. Bitcoin, Euro money and Cash line icons set. Timeline plan infograph. Graph chart sign. Cryptocurrency coin, Receive cash, Atm payment. Growth report. Finance set. Vector