Free with trial Three blue arrows are pointing down, symbolizing a negative trend or decline. Decrease business graph vectors Three blue arrows pointing down representing negative trend. Three blue arrows are pointing down, symbolizing a negative trend or decline
Free with trial This image showcases a vibrant 3D rendering of various financial charts, including bar graphs, pie charts, and a rising arrow, symbolizing growth and profitability. Ideal for presentations, reports, and financial articles. Decrease business graph illustrations Colorful 3D Financial Charts Showing Growth and Profit. This image showcases a vibrant 3D rendering of various financial charts, including bar graphs, pie charts, and a rising arrow, symbolizing growth and profitability. Ideal for presentations, reports, and financial articles.
Free with trial Line chart decreae icon linear vector graphics sign or symbol set for web app ui. Decrease business graph vectors Line chart decreae icon linear graphics set vector in black. Line chart decreae icon linear vector graphics sign or symbol set for web app ui
Free with trial A stack of coins with a green arrow pointing down. The coins are stacked on top of each other, with the bottom coin being the largest. Concept of decline or decrease, as the arrow points downward. Decrease business graph illustrations A stack of coins with a green arrow pointing down
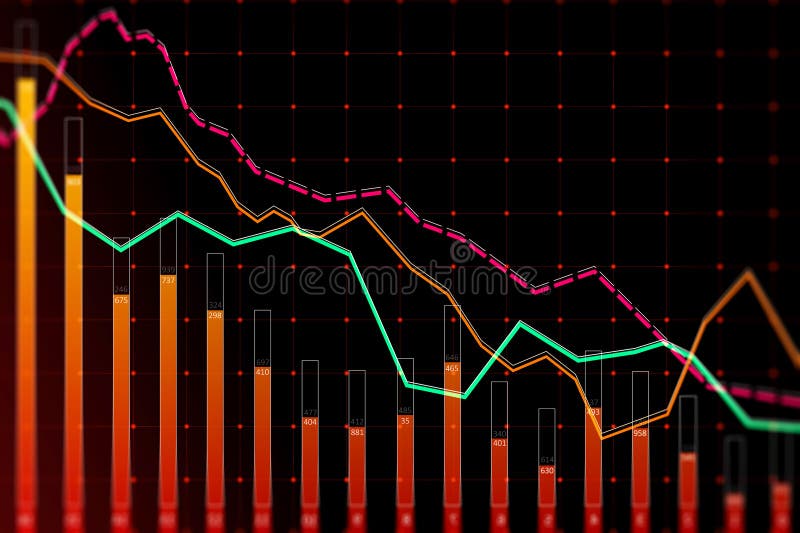
Free with trial Downward red crisis chart grid on dark backdrop. Recession and economic fall concept. 3D Rendering. Decrease business graph illustrations Downward red crisis chart grid on backdrop. Recession and economic fall concept. 3D Rendering
Free with trial Stock Market Data Visualization vector Cryptocurrency Candlestick Chart concept icon or logo element. Decrease business graph vectors Stock Market Data Visualization vector Cryptocurrency Candlestick Chart icon or logo element
Free with trial Economic Loss icon set in thin line outline style and linear vector sign. Decrease business graph vectors Economic Loss icon design in filled and outlined style. Economic Loss icon set in thin line outline style and linear vector sign
Free with trial Hand holding coin with arrows symbolizing increasing and decreasing value. Suitable for financial growth concepts in presentations, articles, and ads. Decrease business graph vectors Hand holding coin with arrows symbolizing increasing and decreasing value
Free with trial A red down arrow on a transparent white background. Decrease business graph vectors A red down arrow on a transparent white background
Free with trial Diagram icons set in outline stroke design for web. Pack line pictograms with growth bar chart, pie data, datum, marketing, analyzing finance, flow, infographic, statistic, other. Vector illustration. Decrease business graph vectors Diagram icons set in outline stroke design for web. Pack line pictograms with growth bar chart, pie data, datum
Free with trial Futuristic 3D Data Visualization on Glass Screen. Decrease business graph illustrations Futuristic 3D Data Visualization on Glass Screen
Free with trial Online Candlestick Chart vector Professional Financial Trading concept colored icon or design element. Decrease business graph vectors Online Candlestick Chart vector Professional Financial Trading colored icon or design element
Free with trial Arrow percent icon in line style. Up and down percentage outline sign symbol illustration. Decrease business graph vectors Arrow percent icon in line style. Up and down percentage outline sign symbol
Free with trial Unhappy businessman hold arrow facing down. Flat Vector Illustration isolated on White Background. Decrease business graph illustrations Unhappy businessman hold arrow facing down
Free with trial 3d illustration of four blue arrows pointing down representing a negative trend. Decrease business graph illustrations Blue arrows pointing down showing negative trend. 3d illustration of four blue arrows pointing down representing a negative trend
Free with trial Dollar up and down icon in outline style. USD arrow sign symbol vector. Decrease business graph vectors Dollar up and down icon in outline style. USD arrow sign symbol
Free with trial Line chart decreae icon linear vector graphics sign or symbol set for web app ui. Decrease business graph vectors Line chart decreae icon Flat line illustration. Line chart decreae icon linear vector graphics sign or symbol set for web app ui
Free with trial A collection of small, black, spherical magnetic balls are arranged on a white surface to form a large arrow pointing downwards. The arrow is composed of multiple rows of balls, with a wider top and tapering to a point. A few individual balls are scattered near the tip of the arrow. The arrangement creates a clear directional symbol. Decrease business graph illustrations Arrow Shape Formed by Black Magnetic Balls Pointing Downward down arrow direction. A collection of small, black, spherical magnetic balls are arranged on a white surface to form a large arrow pointing downwards. The arrow is composed of multiple rows of balls, with a wider top and tapering to a point. A few individual balls are scattered near the tip of the arrow. The arrangement creates a clear directional symbol
Free with trial Three line graphs, data visualization, chart comparison. Decrease business graph vectors Three line graphs, data visualization, chart comparison
Free with trial Financial crisis. The collapse of the economy. Bankruptcy, economic downturn. Vector illustration on white background. Decrease business graph illustrations Financial crisis. The collapse of the economy. Bankruptcy, economic downturn
Free with trial Line art vector icon of stacks of coins with some arrows pointing up and some pointing down, representing market volatility. Decrease business graph vectors Money increasing and decreasing showing market volatility icon. Line art vector icon of stacks of coins with some arrows pointing up and some pointing down, representing market volatility
Free with trial Businessman in suit jumps between cliffs with red downward and green upward arrows, symbolizing market recovery and financial success. Decrease business graph illustrations Businessman jumping from financial crisis to success with red downward and green upward arrows. Businessman in suit jumps between cliffs with red downward and green upward arrows, symbolizing market recovery and financial success
Free with trial Colorful bar and pie charts illustrate data analysis white background. Decrease business graph illustrations Colorful bar and pie charts illustrate data analysis
Free with trial A girl stands confidently, pointing at a finance chart displayed on a large screen. Her expression is focused and determined, highlighting key trends and data that drive her presentation. Decrease business graph illustrations The girl is pointing at the finance chart. A girl stands confidently, pointing at a finance chart displayed on a large screen. Her expression is focused and determined, highlighting key trends and data that drive her presentation.
Free with trial A row of wooden figures, each with a spherical top and a rectangular or cylindrical base, are arranged in descending order of height from left to right. The figures vary in color, starting with a deep red, followed by orange, yellow, green, and then several shades of brown and natural wood. The background is a muted, textured beige. Decrease business graph illustrations Wooden figures arranged in descending height order. A row of wooden figures, each with a spherical top and a rectangular or cylindrical base, are arranged in descending order of height from left to right. The figures vary in color, starting with a deep red, followed by orange, yellow, green, and then several shades of brown and natural wood. The background is a muted, textured beige
Free with trial A glossy, transparent blue arrow curves downwards, pointing towards the bottom right of the frame. The arrow is rendered in 3D and casts a subtle shadow on the white surface it rests upon. Clear details and vibrant colors enhance visual appeal. Decrease business graph illustrations Glossy Blue Arrow Pointing Downwards on a White Background direction decline. A glossy, transparent blue arrow curves downwards, pointing towards the bottom. A glossy, transparent blue arrow curves downwards, pointing towards the bottom right of the frame. The arrow is rendered in 3D and casts a subtle shadow on the white surface it rests upon. Clear details and vibrant colors enhance visual appeal
Free with trial Red and Green Candlestick Chart vector Crypto Trading and Price Action concept colored icon or logo element. Decrease business graph vectors Red and Green Candlestick Chart vector Crypto Trading and Price Action colored icon or logo element
Free with trial Nine black and white icons of abacuses on a white background, each with varying curves on the frame. The beads are arranged differently among the icons, suggesting diverse numerical configurations. The abacus curves either upward or downward, providing distinct shapes across each representation. These simple illustrations emphasize the classic design of the abacus as a counting tool. Decrease business graph vectors Nine simple line graphs displayed in a grid pattern. Nine black and white icons of abacuses on a white background, each with varying curves on the frame. The beads are arranged differently among the icons, suggesting diverse numerical configurations. The abacus curves either upward or downward, providing distinct shapes across each representation. These simple illustrations emphasize the classic design of the abacus as a counting tool.
Free with trial Opportunity cost to compare the return of best foregone option and the chosen option vector. Decrease business graph vectors Opportunity cost to compare the return of best foregone option and the chosen option
Free with trial Stock market chart plunging into red under stormy clouds, symbolizing recession, financial crisis, investment losses and global economic uncertainty in a dramatic digital illustration. Decrease business graph illustrations Stock market decreasing chart line among dark clouds. Stock market chart plunging into red under stormy clouds, symbolizing recession, financial crisis, investment losses and global economic uncertainty in a dramatic digital illustration
Free with trial Four cylindrical bar charts are displayed against a light gray background. The charts represent four items labeled ITEM 11, ITEM 12, ITEM 13, and ITEM 14. Each chart displays data series with circular markers and labels. The data series are colored in shades of teal, blue, and dark blue. The charts have a 3D cylindrical appearance with a slight gradient. Horizontal grid lines with numerical labels. Decrease business graph illustrations Four cylindrical bar charts with blue and teal data. Four cylindrical bar charts are displayed against a light gray background. The charts represent four items labeled ITEM 11, ITEM 12, ITEM 13, and ITEM 14. Each chart displays data series with circular markers and labels. The data series are colored in shades of teal, blue, and dark blue. The charts have a 3D cylindrical appearance with a slight gradient. Horizontal grid lines with numerical labels
Free with trial Stacks of coins visually represent decreasing wealth, signified by a downward-pointing red arrow, indicating financial loss or decline for illustrating economic concepts. Decrease business graph illustrations Coin Stack with Red Arrow Showing Financial Decline. Stacks of coins visually represent decreasing wealth, signified by a downward-pointing red arrow, indicating financial loss or decline for illustrating economic concepts
Free with trial Economy crisis icon Vector symbol or sign set collection in black and white outline. Decrease business graph vectors Economy crisis flat line icon set. Economy crisis Thin line illustration vector. Economy crisis icon Vector symbol or sign set collection in black and white outline
Free with trial Global finance data analysis on keyboard with charts, stunning background Generative AI. Decrease business graph illustrations Global finance data analysis on keyboard with charts
Free with trial Blue Stacked Arrow Up Down on White, Direction ,Growth , This photo was created using generative AI. Decrease business graph illustrations Blue Stacked Arrow Up Down on White, Direction ,Growth
Free with trial Up and down arrow icon on black square. Upward and downward sign symbol vector. Decrease business graph vectors Up and down arrow icon on black square. Upward and downward sign symbol
Free with trial A confused man looking at a declining euro chart with a question mark in a thought bubble, flat style, on a light abstract background. Concept of financial confusion. Vector illustration. Decrease business graph vectors Confused investor with euro chart decline. Vector illustration. A confused man looking at a declining euro chart with a question mark in a thought bubble, flat style, on a light abstract background. Concept of financial confusion. Vector illustration
Free with trial Decreasing bar chart icon on black circle. Market crash illustration concept. Decrease business graph vectors Decreasing bar chart icon on black circle. Market crash concept. Decreasing bar chart icon on black circle. Market crash illustration concept
Free with trial This striking image depicts a 3D rendering of a dramatic market downturn, generated by AI. The red, origami-style arrow plunges downwards, contrasting sharply with the clean, minimalist background. The visual emphasizes the severity of the economic decline. Decrease business graph illustrations AI-Generated Market Crash Visualization. This striking image depicts a 3D rendering of a dramatic market downturn, generated by AI. The red, origami-style arrow plunges downwards, contrasting sharply with the clean, minimalist background. The visual emphasizes the severity of the economic decline.
Free with trial Up and down direction arrow icon with long shadow. Upload and download concept. Decrease business graph vectors Up and down direction arrow icon with long shadow
Free with trial Bull statue with stock market crash in the background. Created with the help of Generative AI tools. Decrease business graph illustrations Bull statue with stock market crash in the background.
Free with trial Decreasing Bar Chart with Downtrend Arrow and Oil Drop. Decrease business graph vectors Decreasing Bar Chart with Downtrend Arrow and Oil Drop
Free with trial Red downward chart. Financial market crash with red arrow. Flat vector illustration isolated on white background. Decrease business graph vectors Red downward chart. Flat vector illustration isolated on white. Red downward chart. Financial market crash with red arrow. Flat vector illustration isolated on white background.
Free with trial A bold red zigzag arrow descends diagonally, symbolizing a downward trend or negative movement. Decrease business graph vectors Red zigzag arrow pointing downward indicating decline. A bold red zigzag arrow descends diagonally, symbolizing a downward trend or negative movement
Free with trial Dreamstime for your design Red arrow down chart on wall. Stock market crash concept. Decrease business graph illustrations Red arrow down chart on wall. Stock market crash concept.
Free with trial Dollar arrow up and down outline icon vector isolated on white background. Decrease business graph vectors Dollar arrow up and down outline icon isolated on white background
Free with trial A glowing neon arrow points downwards, symbolizing a negative trend or decline, set against a dark, textured wall and wet floor. Decrease business graph illustrations Neon Downward Trend Arrow on Dark Textured Background. A glowing neon arrow points downwards, symbolizing a negative trend or decline, set against a dark, textured wall and wet floor
Free with trial The fall chart goes down from the cliff on a light background. Decrease business graph illustrations The fall chart goes down from the cliff on a light background.
Free with trial A black and white icon depicting a bar chart with bars decreasing in height, indicating a significant downward trend. Decrease business graph illustrations Bar chart showing a sharp decline with downward arrow. A black and white icon depicting a bar chart with bars decreasing in height, indicating a significant downward trend
Free with trial A collection of red and green arrows, some pointing up and others down, symbolizing market fluctuations and financial performance. Decrease business graph illustrations Upward and downward arrows representing market trends. A collection of red and green arrows, some pointing up and others down, symbolizing market fluctuations and financial performance
Free with trial An elderly man on concrete stairs, New York skyline. Falling forex charts. Decrease business graph illustrations An elderly man on concrete stairs, New York skyline. Falling forex charts.
Free with trial Three wooden blocks are arranged in a row on a reflective surface against a white background. The leftmost block has two green upward-pointing arrows cut out, revealing a green background. The middle block displays a dark blue percentage symbol. The rightmost block features a red downward-pointing arrow cut out, revealing a red background. Decrease business graph illustrations Wooden blocks with up arrows percentage and down arrow. Three wooden blocks are arranged in a row on a reflective surface against a white background. The leftmost block has two green upward-pointing arrows cut out, revealing a green background. The middle block displays a dark blue percentage symbol. The rightmost block features a red downward-pointing arrow cut out, revealing a red background
Free with trial This 3D graphic depicts a sharp market downturn, visualized with a red arrow plummeting downwards along a gridded bar chart. The image is generated by AI, offering a compelling visual representation of economic decline and financial loss. It showcases the potential for significant drops in various. Decrease business graph illustrations AI-Generated Market Decline Visualization. This 3D graphic depicts a sharp market downturn, visualized with a red arrow plummeting downwards along a gridded bar chart. The image is generated by AI, offering a compelling visual representation of economic decline and financial loss. It showcases the potential for significant drops in various
Free with trial A red background with red lines on it. The red lines are in different sizes and are arranged in a way that creates a sense of movement. The image conveys a feeling of energy and excitement. Decrease business graph vectors A red background with red lines on it
Free with trial Line chart is representing a decreasing trend in statistical data analysis. Decrease business graph vectors Statistical data analysis with line chart showing decreasing trend. Line chart is representing a decreasing trend in statistical data analysis
Free with trial Concept Abstract Art, Blue Watercolor, Financial Growth, Chart, Abstract Design Abstract Blue Watercolor Financial Growth Chart. Decrease business graph illustrations Abstract Blue Watercolor Financial Growth Chart. Concept Abstract Art, Blue Watercolor, Financial. Concept Abstract Art, Blue Watercolor, Financial Growth, Chart, Abstract Design Abstract Blue Watercolor Financial Growth Chart
Free with trial Icon of an arrow pointing down on a shopping cart, representing decreasing sales. Decrease business graph vectors Arrow pointing down on shopping cart icon showing decreasing sales. Icon of an arrow pointing down on a shopping cart, representing decreasing sales
Free with trial Hand raising a sign that says Leftward Direction drawn using engraving technique. Decrease business graph vectors Hand raising a sign that says Leftward Direction Colored. Hand raising a sign that says Leftward Direction drawn using engraving technique
Free with trial Simple up and down arrow on black circle. Upward and downward sign symbol vector. Decrease business graph vectors Simple up and down arrow on black circle. Upward and downward sign symbol
Free with trial A stark red jagged arrow descends diagonally against a solid black background, symbolizing a sharp decline or negative trend. Decrease business graph illustrations Red jagged arrow pointing downward on black background. A stark red jagged arrow descends diagonally against a solid black background, symbolizing a sharp decline or negative trend
Free with trial Cost symbol dollar increase icon pattern seamless isolated on white background. Simple background. Decrease business graph vectors Cost symbol dollar increase icon pattern seamless isolated on white background
Free with trial Concept of investing money in real estate, real estate prices soar. Decrease business graph illustrations Concept of investing money in real estate, real prices soar
Free with trial Concept of investing money in real estate, real estate prices soar. Decrease business graph illustrations Concept of investing money in real estate, real prices soar
Free with trial Concept of investing money in real estate, real estate prices soar. Decrease business graph illustrations Concept of investing money in real estate, real prices soar
Free with trial Concept of investing money in real estate, real estate prices soar. Decrease business graph illustrations Concept of investing money in real estate, real prices soar
Free with trial Financial loss in 3d icon illustration of finance theme, use this element to your design. Decrease business graph vectors Financial loss in 3d icon illustration of finance theme
Free with trial Image is generated with the use of an AI. Decrease business graph illustrations Investment and level of risk concept. Coins of dollar and no ris. image is generated with the use of an AI
Free with trial A collection of twelve black and white vector icons representing various financial concepts. The set includes bar charts and line graphs illustrating growth and trends, a piggy bank for savings, bank buildings symbolizing financial institutions, a safe for security, currency symbols (dollar, euro, yen), and credit debit cards for payments. These icons are ideal for websites, presentations, and applications related to finance, economics, business, and personal money management. Decrease business graph vectors Financial Icons Set: Growth, Savings, Banking, and Payments. A collection of twelve black and white vector icons representing various financial concepts. The set includes bar charts and line graphs illustrating growth and trends, a piggy bank for savings, bank buildings symbolizing financial institutions, a safe for security, currency symbols (dollar, euro, yen), and credit debit cards for payments. These icons are ideal for websites, presentations, and applications related to finance, economics, business, and personal money management.
Free with trial Hand raising a sign that says Rightward Direction drawn using engraving technique. Decrease business graph vectors Hand raising a sign that says Rightward Direction COLORED. Hand raising a sign that says Rightward Direction drawn using engraving technique
Free with trial Arrow percent icon set on black circle. Up and down percentage outline sign symbol vector. Decrease business graph vectors Arrow percent icon set on black circle. Up and down percentage outline sign symbol
Free with trial Collection of thirty charts and graphs icons in line style. Decrease business graph vectors Collection of thirty charts and graphs icons in line style
Free with trial Online sales analysis laptop, charts, shopping cart, office, detailed background Generative AI. Decrease business graph illustrations Online sales analysis laptop, charts, shopping cart, office
Free with trial White jigsaw puzzle with missing piece showing the word 'DEPRECIATION' on a black leather textured background. Decrease business graph illustrations White jigsaw puzzle with missing piece showing the word \'DEPRECIATION\'. White jigsaw puzzle with missing piece showing the word 'DEPRECIATION' on a black leather textured background.
Free with trial Arrow trend-down icon vector set on white background. EPS 10. Decrease business graph vectors Arrow trend-down icon
Free with trial Bar chart showing declining performance and negative trend. Decrease business graph vectors Bar chart showing declining performance and negative trend
Free with trial Nasdaq index falling showing a stock market crash with rain drops on a reflective surface. Decrease business graph illustrations Stock market crashing with nasdaq index falling displayed on a screen. Nasdaq index falling showing a stock market crash with rain drops on a reflective surface
Free with trial Arrow trend-down icon. Decrease business graph vectors Arrow trend-down vector icon set in black and white outlines. Arrow trend-down icon
Free with trial Stock market crash illustration with a red arrow and financial data on a white background. Concept of financial crisis and market recession. 3D Rendering. Decrease business graph illustrations Stock market crash showing a falling trend with red arrow and data on white background. 3D Rendering. Stock market crash illustration with a red arrow and financial data on a white background. Concept of financial crisis and market recession. 3D Rendering
Free with trial Reduction chart icon set. Vector symbols in black and white colors. Decrease business graph vectors Reduction chart icon
Free with trial Declining economy concept with bar chart, arrows, dollar sign on flatlay background,. Decrease business graph illustrations Declining economy concept with bar chart, arrows, dollar sign on flatlay background