Free with trial Reduction chart icon vector icon on white background. EPS10. Decrease business graph vectors Reduction chartline in Thin line black color. flat simple vector symbols illustration. Reduction chart icon vector icon on white background. EPS10
Free with trial Dropping down of the cryptocurrencies. Visualization of bearish sezon in the stock market. Generative AI. Decrease business graph illustrations Dropping down of the cryptocurrencies. Visualization of bearish sezon in the stock market. Generative AI
Free with trial Glowing neon line Global economic crisis icon isolated on black background. World finance crisis. Vector. Decrease business graph illustrations Glowing neon line Global economic crisis icon isolated on black background. World finance crisis. Vector
Free with trial Person using smartphone for stock trading. Mobile phone displays financial data charts. Hands actively interact with screen. Market trends shown in background. Businessman investor. Decrease business graph illustrations Person using smartphone for stock trading. Mobile phone displays financial data, charts. Hands actively interact with screen. Person using smartphone for stock trading. Mobile phone displays financial data charts. Hands actively interact with screen. Market trends shown in background. Businessman investor.
Free with trial China flag with downward arrow on world map symbolizing economic decline or financial crisis. Decrease business graph illustrations China flag with downward arrow on world map symbolizing economic decline or financial crisis
Free with trial That US economy is changing the trend and goes up instead of down (or vice versa). 3D rendering on blue background. Decrease business graph illustrations That US economy is changing the trend and goes up instead of down (or vice versa).
Free with trial That US economy is changing the trend and goes up instead of down (or vice versa). 3D rendering on green background. Decrease business graph illustrations That US economy is changing the trend and goes up instead of down (or vice versa).
Free with trial That US economy is changing the trend and goes up instead of down (or vice versa). 3D rendering on wooden background. Decrease business graph illustrations That US economy is changing the trend and goes up instead of down (or vice versa).
Free with trial That US economy is changing the trend and goes up instead of down (or vice versa). 3D rendering on green background. Decrease business graph illustrations That US economy is changing the trend and goes up instead of down (or vice versa).
Free with trial That US economy is changing the trend and goes up instead of down (or vice versa). 3D rendering on red background. Decrease business graph illustrations That US economy is changing the trend and goes up instead of down (or vice versa).
Free with trial That US economy is changing the trend and goes up instead of down (or vice versa). 3D rendering on orange background. Decrease business graph illustrations That US economy is changing the trend and goes up instead of down (or vice versa).
Free with trial That US economy is changing the trend and goes up instead of down (or vice versa). 3D rendering on yellow background. Decrease business graph illustrations That US economy is changing the trend and goes up instead of down (or vice versa).
Free with trial That US economy is changing the trend and goes up instead of down (or vice versa). 3D rendering on orange background. Decrease business graph illustrations That US economy is changing the trend and goes up instead of down (or vice versa).
Free with trial That US economy is changing the trend and goes up instead of down (or vice versa). 3D rendering on red background. Decrease business graph illustrations That US economy is changing the trend and goes up instead of down (or vice versa).
Free with trial Economic financial downturn in 2025 chart down forecast crisis market crash prediction vector. Decrease business graph vectors Economic financial downturn in 2025 chart down forecast crisis market crash prediction
Free with trial That US economy is changing the trend and goes up instead of down (or vice versa). Supports PNG files with transparent backgrounds. Decrease business graph vectors That US economy is changing the trend and goes up instead of down (or vice versa)
Free with trial That US economy is changing the trend and goes up instead of down (or vice versa). 3D rendering on gold background. Decrease business graph illustrations That US economy is changing the trend and goes up instead of down (or vice versa).
Free with trial Economic downturn in 2025 chart down candle stick bearish stock crypto market prediction vector. Decrease business graph vectors Economic downturn in 2025 chart down candle stick bearish stock crypto market prediction
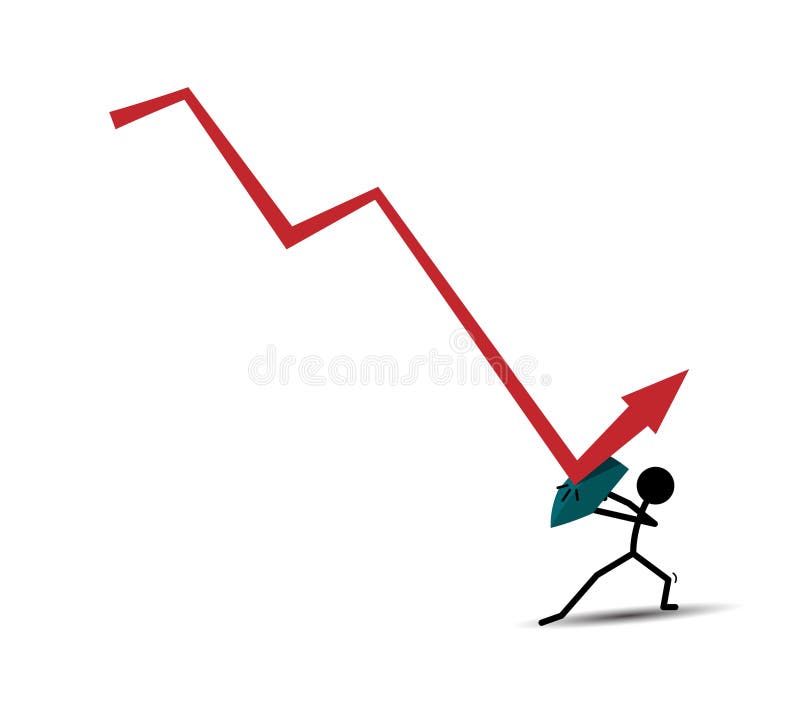
Free with trial Illustration of a graphic diagram going down and being reflected by a shield. . loss or decline. flat design style. Suitable for use in reports, illustrations, presentations, etc. vector design template. Decrease business graph vectors Illustration of a graphic diagram going down and being reflected by a shield. . loss or decline. flat design style. Suitable for
Free with trial A dark oil storage container set against a backdrop of fluctuating financial graphs, highlighted by a sharp red arrow pointing downward, illustrating a market decline. Decrease business graph illustrations Black oil barrel with a red declining arrow and financial chart in the background symbolizing falling crude oil prices and market. A dark oil storage container set against a backdrop of fluctuating financial graphs, highlighted by a sharp red arrow pointing downward, illustrating a market decline
Free with trial Colorful Global economic crisis icon isolated on white background. World finance crisis. Minimalism concept. 3D render illustration. Decrease business graph illustrations Colorful Global economic crisis icon isolated on white background. World finance crisis. Minimalism concept. 3D render
Free with trial Financial crisis. Disappointed person showing empty pockets. Market fall, cart showing arrow going down. Economy collapse concept. Employee without money, poverty vector illustration. Decrease business graph vectors Financial crisis. Disappointed person showing empty pockets. Market fall, cart showing arrow going down. Economy collapse concept
Free with trial Financial crisis. Disappointed person showing empty pockets. Market fall, cart showing arrow going down. Economy collapse concept. Employee without money, poverty vector illustration. Decrease business graph vectors Financial crisis. Disappointed person showing empty pockets. Market fall, cart showing arrow going down. Economy collapse concept
Free with trial Economic critical crisis concept. The down arrow on red world map background. Recession financial, cryptocurrency, gold, and the stock market. Losing money and cash. Bearish. Decrease business graph vectors Economic critical crisis concept. The down arrow on red world map background. Recession financial, cryptocurrency, gold, and the
Free with trial Conceptual image showing an economic downturn. A crane lowers a shipping container, causing a crack in a wall shaped like a declining graph. Illustrates market crash and financial crisis. Decrease business graph illustrations Usa china international trade war economic downturn concept with container and crane showing market crash and financial crisis ... conceptual image showing an economic downturn. A crane lowers a shipping container, causing a crack in a wall shaped like a declining graph. Illustrates market crash and financial crisis.
Free with trial Magnifying glass focuses on stock market chart details. Analyzing trends changes. Financial data in focus. Investment strategy. Visual representation of market trends. Studying market. Decrease business graph illustrations Magnifying glass focuses on stock market chart details. Analyzing trends, changes. Financial data in focus. Investment strategy. Magnifying glass focuses on stock market chart details. Analyzing trends changes. Financial data in focus. Investment strategy. Visual representation of market trends. Studying market.
Free with trial Percentage symbols on coin stacks with red chart arrow going down. Economic recession crisis, inflation, financial loss concept. Represents decreasing interest rates, investment market. Decrease business graph illustrations Percentage symbols on coin stacks with red chart arrow going down. Economic recession crisis, inflation, financial loss concept.
Free with trial This image illustrates a financial chart showing a downward trend with a dollar sign, symbolizing economic decline, investment losses, and market instability. Decrease business graph vectors Vector art of financial chart with downward trend and dollar sign, indicating economic decline and investment loss in the market. This image illustrates a financial chart showing a downward trend with a dollar sign, symbolizing economic decline, investment losses, and market instability
Free with trial Visualize the dynamic world of cryptocurrency trading with this compelling 3D illustration. A mobile phone screen dominates the composition, showcasing intricate candlestick charts alongside prominent buy and sell buttons, all set against a sophisticated dark blue background. This imagery captures the essence of online trading, finance, and investment strategies. Perfect for illustrating concepts. Decrease business graph illustrations Cryptocurrency trading concept displaying a mobile phone screen with candlestick charts buy and sell buttons over a dark blue. Visualize the dynamic world of cryptocurrency trading with this compelling 3D illustration. A mobile phone screen dominates the composition, showcasing intricate candlestick charts alongside prominent buy and sell buttons, all set against a sophisticated dark blue background. This imagery captures the essence of online trading, finance, and investment strategies. Perfect for illustrating concepts
Free with trial Close-up shot of stock market chart with upward and downward trends. Red and blue lines over keyboard show dynamic financial data on screen. Economic analysis forecasting. Decrease business graph illustrations Close-up shot of stock market chart with upward and downward trends. Red and blue lines over keyboard show dynamic financial data
Free with trial Stack of coins with a red downward arrow, illustrating the effect of falling interest rates on savings, Generative AI. Decrease business graph illustrations Stack of coins with a red downward arrow, illustrating the effect of falling interest rates on savings
Free with trial Graphic diagram illustration taken down and cut using scissors. loss or decline. flat design style. Suitable for use in reports, illustrations, presentations, etc. vector design template. Decrease business graph vectors Graphic diagram illustration taken down and cut using scissors. loss or decline. flat design style. Suitable for use in reports
Free with trial Black Searching for food in trash can on streets outdoors icon isolated on transparent background. Homelessness and poverty concept. Green square button. Decrease business graph illustrations Black Searching for food in trash can on streets outdoors icon isolated on transparent background. Homelessness and
Free with trial Digital screen displaying stock market trends analysis with red data points representing a decline, visualized through charts and candlestick diagrams. Decrease business graph illustrations Financial data visualization of stock market trends showing declining statistics and analytical software for trading platform. Digital screen displaying stock market trends analysis with red data points representing a decline, visualized through charts and candlestick diagrams
Free with trial Description: This abstract image represents the concept of a financial crisis in the stock market, with a gold arrow pointing downwards on a blue background. The downtrend symbolizes a decline in stock prices and economic instability. The contrasting colors of gold and blue create a visually striking and impactful representation of the unpredictable nature of financial markets. This image conveys themes of uncertainty, risk, and the interconnectedness of global economies. Decrease business graph illustrations Abstract financial stock market trading chart with gold arrow downtrend on blue background. Description: This abstract image represents the concept of a financial crisis in the stock market, with a gold arrow pointing downwards on a blue background. The downtrend symbolizes a decline in stock prices and economic instability. The contrasting colors of gold and blue create a visually striking and impactful representation of the unpredictable nature of financial markets. This image conveys themes of uncertainty, risk, and the interconnectedness of global economies.
Free with trial A handheld smartphone showing a steep market downturn, highlighted by vivid crimson shades, capturing the tense moment of economic chaos and stock declines. Decrease business graph illustrations Mobile device displaying a dramatic sharp decline in financial market chart with intense red tones symbolizing economic loss or. A handheld smartphone showing a steep market downturn, highlighted by vivid crimson shades, capturing the tense moment of economic chaos and stock declines
Free with trial A stylized depiction of a commodity barrel with coins being deposited and downward arrows, representing a decrease in value or a negative financial trend. Decrease business graph illustrations Conceptual illustration of declining commodity prices with a barrel coins and downward trending indicators symbolizing economic. A stylized depiction of a commodity barrel with coins being deposited and downward arrows, representing a decrease in value or a negative financial trend
Free with trial Flat Design Illustration of NPL Risk Analysis with Declining Bar Chart, Highlighting Financial Trends and Risks. Ideal. Decrease business graph illustrations Flat Design Illustration of NPL Risk Analysis with Declining Bar Chart, Highlighting Financial Trends and Risks. Ideal
Free with trial Animated Stream Of Interfaces With Economic and stock information red and yellow color, speculation fall. Decrease business graph illustrations Animated Stream Of Interfaces With Economic and stock information red and yellow color, speculation fall
Free with trial Animated Stream Of Interfaces With Economic and stock information red and yellow color, speculation fall. Decrease business graph illustrations Animated Stream Of Interfaces With Economic and stock information red and yellow color, speculation fall
Free with trial Animated Stream Of Interfaces With Economic and stock information red and yellow color, speculation fall. Decrease business graph illustrations Animated Stream Of Interfaces With Economic and stock information red and yellow color, speculation fall
Free with trial Animated Stream Of Interfaces With Economic and stock information red and yellow color, speculation fall. Decrease business graph illustrations Animated Stream Of Interfaces With Economic and stock information red and yellow color, speculation fall
Free with trial Animated Stream Of Interfaces With Economic and stock information red and yellow color, speculation fall. Decrease business graph illustrations Animated Stream Of Interfaces With Economic and stock information red and yellow color, speculation fall
Free with trial The red futuristic with neon lights background for the economic crisis, a bearish trend. Hi-tech backdrop. Generative AI. Decrease business graph illustrations The red futuristic with neon lights background for the economic crisis, a bearish trend. Hi-tech backdrop. Generative AI
Free with trial The red futuristic with neon lights background for the economic crisis, a bearish trend. Hi-tech backdrop. Generative AI. Decrease business graph illustrations The red futuristic with neon lights background for the economic crisis, a bearish trend. Hi-tech backdrop. Generative AI
Free with trial The red futuristic with neon lights background for the economic crisis, a bearish trend. Hi-tech backdrop. Generative AI. Decrease business graph illustrations The red futuristic with neon lights background for the economic crisis, a bearish trend. Hi-tech backdrop. Generative AI
Free with trial Pop art line Global economic crisis icon isolated on color background. World finance crisis. Vector. Decrease business graph illustrations Pop art line Global economic crisis icon isolated on color background. World finance crisis. Vector
Free with trial Set line Pie chart infographic Global economic crisis and Drop crude oil price icon. Vector. Decrease business graph vectors Set line Pie chart infographic, Global economic crisis and Drop crude oil price icon. Vector
Free with trial Black background. Motion. Blurry pixel graphics that sway slowly in different directions in abstraction. High quality 4k footage. Decrease business graph illustrations Black background. Motion.Blurry pixel graphics that sway slowly in different directions in abstraction.
Free with trial Dropping down of the cryptocurrencies. Visualization of bearish sezon in the stock market. Generative AI. Decrease business graph illustrations Dropping down of the cryptocurrencies. Visualization of bearish sezon in the stock market. Generative AI
Free with trial Dropping down of the cryptocurrencies. Visualization of bearish sezon in the stock market. Generative AI. Decrease business graph illustrations Dropping down of the cryptocurrencies. Visualization of bearish sezon in the stock market. Generative AI
Free with trial Dropping down of the cryptocurrencies. Visualization of bearish sezon in the stock market. Generative AI. Decrease business graph illustrations Dropping down of the cryptocurrencies. Visualization of bearish sezon in the stock market. Generative AI
Free with trial Dropping down of the cryptocurrencies. Visualization of bearish sezon in the stock market. Generative AI. Decrease business graph illustrations Dropping down of the cryptocurrencies. Visualization of bearish sezon in the stock market. Generative AI
Free with trial Cartoon Gesture Icon Mockup. Flat 3d isometric businessman hand turn cost dial to low position. Cost reduction management concept. 3D rendering on white background. Decrease business graph vectors Cartoon Gesture Icon Mockup.Flat 3d isometric businessman hand turn cost dial to low position.
Free with trial Animation with values of currency exchange rate chart. Motion. Moving stylish chart of bank currencies on stock exchange. Chart with currency values and changing line indicators. Decrease business graph illustrations Animation with values of currency exchange rate chart. Motion. Moving stylish chart of bank currencies on stock exchange
Free with trial Isometric line Global economic crisis icon isolated on yellow background. World finance crisis. Black circle button. Vector. Decrease business graph vectors Isometric line Global economic crisis icon isolated on yellow background. World finance crisis. Black circle button
Free with trial Green Global economic crisis icon isolated on green background. World finance crisis. Long shadow style. Vector. Decrease business graph vectors Green Global economic crisis icon isolated on green background. World finance crisis. Long shadow style. Vector
Free with trial A hand interacts with a digital screen displaying financial growth trends and data visualizations for the year 2025. Decrease business graph illustrations Analyzing financial growth trends on a digital interface. A hand interacts with a digital screen displaying financial growth trends and data visualizations for the year 2025
Free with trial Transparent Backgrounds Mock-up. Flat 3d isometric businessman hand turn cost dial to low position. Cost reduction management concept. Supports PNG files with transparent backgrounds. Decrease business graph vectors Transparent Backgrounds Mock-up.Flat 3d isometric businessman hand turn cost dial to low position.
Free with trial Transparent Backgrounds Mock-up. Flat 3d isometric businessman hand turn cost dial to low position. Cost reduction management concept. Supports PNG files with transparent backgrounds. Decrease business graph vectors Transparent Backgrounds Mock-up.Flat 3d isometric businessman hand turn cost dial to low position.
Free with trial Transparent Backgrounds Mock-up. Flat 3d isometric businessman hand turn cost dial to low position. Cost reduction management concept. Supports PNG files with transparent backgrounds. Decrease business graph vectors Transparent Backgrounds Mock-up.Flat 3d isometric businessman hand turn cost dial to low position.
Free with trial Transparent Backgrounds Mock-up. Flat 3d isometric businessman hand turn cost dial to low position. Cost reduction management concept. Supports PNG files with transparent backgrounds. Decrease business graph vectors Transparent Backgrounds Mock-up.Flat 3d isometric businessman hand turn cost dial to low position.
Free with trial Paper cut Global economic crisis icon isolated on black and red background. World finance crisis. Paper art style. Vector. Decrease business graph vectors Paper cut Global economic crisis icon isolated on black and red background. World finance crisis. Paper art style
Free with trial KYIV, UKRAINE - JANUARY 29, 2025 Nvidia corporation logotype showed on iPhone 15 smartphone display screen. Nvidia is a global leader in artificial intelligence hardware and software. Decrease business graph illustrations KYIV, UKRAINE - JANUARY 29, 2025 Nvidia corporation logotype showed on iPhone 15 smartphone display screen. Nvidia is a
Free with trial KYIV, UKRAINE - JANUARY 29, 2025 Nvidia corporation logotype showed on iPhone 15 smartphone display screen. Nvidia is a global leader in artificial intelligence hardware and software. Decrease business graph illustrations KYIV, UKRAINE - JANUARY 29, 2025 Nvidia corporation logotype showed on iPhone 15 smartphone display screen. Nvidia is a
Free with trial KYIV, UKRAINE - JANUARY 29, 2025 Nvidia corporation logotype showed on iPhone 15 smartphone display screen. Nvidia is a global leader in artificial intelligence hardware and software. Decrease business graph illustrations KYIV, UKRAINE - JANUARY 29, 2025 Nvidia corporation logotype showed on iPhone 15 smartphone display screen. Nvidia is a
Free with trial KYIV, UKRAINE - JANUARY 29, 2025 Nvidia corporation logotype showed on iPhone 15 smartphone display screen. Nvidia is a global leader in artificial intelligence hardware and software. Decrease business graph illustrations KYIV, UKRAINE - JANUARY 29, 2025 Nvidia corporation logotype showed on iPhone 15 smartphone display screen. Nvidia is a
Free with trial Glowing neon line Global economic crisis icon isolated on brick wall background. World finance crisis. Vector. Decrease business graph illustrations Glowing neon line Global economic crisis icon isolated on brick wall background. World finance crisis. Vector
Free with trial Set line Digital speed meter Arrow Financial growth Dollar symbol Mountains with flag and Intersection point icon. Vector. Decrease business graph vectors Set line Digital speed meter, Arrow, Financial growth, Dollar symbol, Mountains with flag, and Intersection point icon
Free with trial Flat bar chart uses dramatically shorter red bars on black to emphasize a sharp fall. Decrease business graph illustrations Flat design simple bar chart with dramatically decreasing red bars on black background, emphasizing fall. Flat bar chart uses dramatically shorter red bars on black to emphasize a sharp fall.
Free with trial Flat bar chart uses dramatically shorter red bars on black to emphasize a sharp fall. Decrease business graph illustrations Flat design simple bar chart with dramatically decreasing red bars on black background, emphasizing fall. Flat bar chart uses dramatically shorter red bars on black to emphasize a sharp fall.
Free with trial Flat bar chart uses dramatically shorter red bars on black to emphasize a sharp fall. Decrease business graph illustrations Flat design simple bar chart with dramatically decreasing red bars on black background, emphasizing fall. Flat bar chart uses dramatically shorter red bars on black to emphasize a sharp fall.
Free with trial Flat bar chart uses dramatically shorter red bars on black to emphasize a sharp fall. Decrease business graph illustrations Flat design simple bar chart with dramatically decreasing red bars on black background, emphasizing fall. Flat bar chart uses dramatically shorter red bars on black to emphasize a sharp fall.
Free with trial Loan Related Vector Line Icon. Contains such Icon as Interest Rate, Investment Plan, Percentage Diagram and more. Pixel Perfect. Decrease business graph vectors Loan Related Vector Line Icon. Contains such Icon as Interest Rate, Investment Plan, Percentage Diagram and more.
Free with trial Loan Related Vector Line Icon. Contains such Icon as Interest Rate, Investment Plan, Percentage Diagram and more. Pixel Perfect. Decrease business graph vectors Loan Related Vector Line Icon. Contains such Icon as Interest Rate, Investment Plan, Percentage Diagram and more.
Free with trial Loan Related Vector Line Icon. Contains such Icon as Interest Rate, Investment Plan, Percentage Diagram and more. Pixel Perfect. Decrease business graph vectors Loan Related Vector Line Icon. Contains such Icon as Interest Rate, Investment Plan, Percentage Diagram and more.
Free with trial Loan Related Vector Line Icon. Contains such Icon as Interest Rate, Investment Plan, Percentage Diagram and more. Pixel Perfect. Decrease business graph vectors Loan Related Vector Line Icon. Contains such Icon as Interest Rate, Investment Plan, Percentage Diagram and more.
Free with trial Loan Related Vector Line Icon. Contains such Icon as Interest Rate, Investment Plan, Percentage Diagram and more. Pixel Perfect. Decrease business graph vectors Loan Related Vector Line Icon. Contains such Icon as Interest Rate, Investment Plan, Percentage Diagram and more.