Free with trial A 3D illustration shows a business professional in a suit and cap pointing at a screen displaying a downward trend chart, a pie chart with a red cross, and a down arrow. Gold coins are scattered around the base of the stand, emphasizing financial or investment concerns. Decrease business graph illustrations Business professional presenting a declining financial performance chart with gold coins. A 3D illustration shows a business professional in a suit and cap pointing at a screen displaying a downward trend chart, a pie chart with a red cross, and a down arrow. Gold coins are scattered around the base of the stand, emphasizing financial or investment concerns
Free with trial Stacks of gold coins are illuminated with a glowing blue financial stock market graph overlay in a dark, abstract. Decrease business graph illustrations Stacks of gold coins with a glowing blue financial stock market graph overlay in a dark setting. Stacks of gold coins are illuminated with a glowing blue financial stock market graph overlay in a dark, abstract
Free with trial Stylized flat vector graph displaying a downward trend with percentage symbols; composed against a stark black background for emphasis. Decrease business graph vectors Downward Trend Graph Illustration Showing Declining Percentage Values on Black Backdrop. Stylized flat vector graph displaying a downward trend with percentage symbols; composed against a stark black background for emphasis.
Free with trial Decrease bar chart icon on black circle. Statistic sign symbol illustration. Decrease business graph vectors Decrease bar chart icon on black circle. Statistic sign symbol
Free with trial The image displays a graph with a downward trending line that is colored in a fiery orange hue, set against a dark blue background with a visible grid pattern. Decrease business graph illustrations Graph showing a declining trend with a fiery orange line against a dark blue grid background. The image displays a graph with a downward trending line that is colored in a fiery orange hue, set against a dark blue background with a visible grid pattern
Free with trial The image shows a transparent screen displaying a graph with a red downward trend, placed on a desk in a dimly lit office environment with a laptop in the background. Decrease business graph illustrations A downward trending graph is displayed on a transparent screen in a dimly lit office setting. The image shows a transparent screen displaying a graph with a red downward trend, placed on a desk in a dimly lit office environment with a laptop in the background
Free with trial Growth vector icon. Graph or diagram with arrow going up and down. Vector illustration. Decrease business graph vectors Growth vector icon. Graph or diagram with arrow going up and down. Vector
Free with trial This is an detailed assembly of essential outline icons for business strategy, data visualization, and planning. Decrease business graph vectors Essential business strategy and data visualization tools in professional outline style. This is an detailed assembly of essential outline icons for business strategy, data visualization, and planning
Free with trial White Financial growth decrease icon isolated on blue background. Increasing revenue. Vector. Decrease business graph illustrations White Financial growth decrease icon isolated on blue background. Increasing revenue. Vector
Free with trial Growth vector icon. Graph or diagram with arrow going up and down. Vector illustration. Decrease business graph vectors Growth vector icon. Graph or diagram with arrow going up and down. Vector
Free with trial This image is a flat design showing a decreasing red bar graph on a black background. It symbolizes a decline or negative trend. Decrease business graph vectors Decreasing Red Bar Graph on Black Background Representing Decline or Negative Trends. This image is a flat design showing a decreasing red bar graph on a black background. It symbolizes a decline or negative trend.
Free with trial A close-up shot reveals a vibrant red line graph sharply declining on a dark blue screen depicting a negative trend in the stock market The image represents financial loss investment risk and market downturn Ideal for illustrating economic instability. Decrease business graph illustrations Close up Red Stock Market Graph Showing Decline Financial Loss Investment Risk AI generated. A close-up shot reveals a vibrant red line graph sharply declining on a dark blue screen depicting a negative trend in the stock market The image represents financial loss investment risk and market downturn Ideal for illustrating economic instability
Free with trial Decrease bar chart icon in generic style. Statistic sign symbol illustration. Decrease business graph vectors Decrease bar chart icon in generic style. Statistic sign symbol
Free with trial Growth vector icon. Graph or diagram with arrow going up and down. Vector illustration. Decrease business graph vectors Growth vector icon. Graph or diagram with arrow going up and down. Vector
Free with trial Modern graphic business charts set featuring financial growth and decline for data visualization. Decrease business graph vectors Modern graphic business charts set featuring financial growth and decline for data visualization
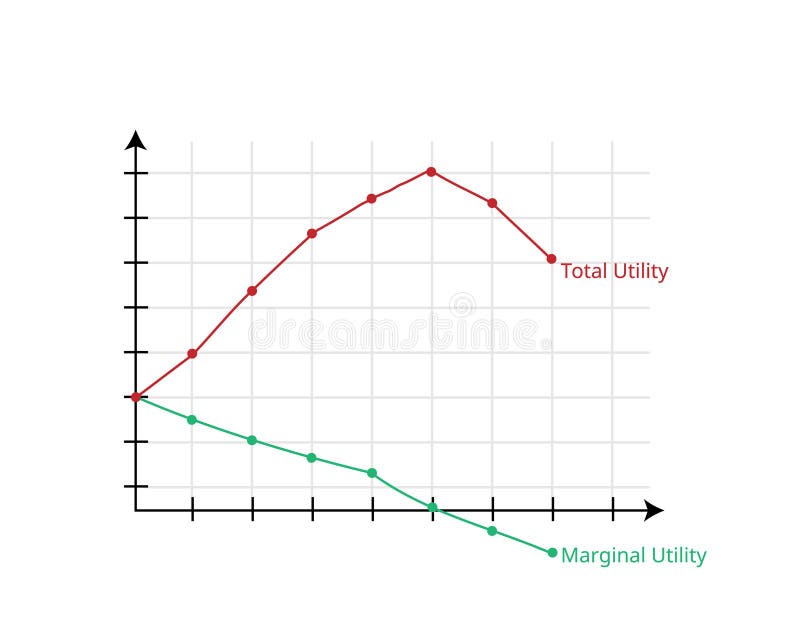
Free with trial Marginal utility and total utility theory graph in economics vector. Decrease business graph vectors Marginal utility and total utility theory graph in economics
Free with trial Crisis. Graphs and charts templates. Business infographics. Statistic and data, bankruptcy, financial crisis, money loss, down arrow, economy reduction. Financial chart. Vector illustration. Decrease business graph illustrations Crisis. Graphs and charts templates. Business infographics.
Free with trial A red line graph showing a downward trend on a white grid background indicating decline or loss. Generative AI. Decrease business graph illustrations A red line graph showing a downward trend on a white grid background indicating decline or loss
Free with trial Stylized business chart icon depicting financial growth, percentage, and decline. Flat design, blue outline with light blue fill, minimalistic style. Decrease business graph vectors Business chart icon showing growth, percentage, and decline in a simple outlined style. Stylized business chart icon depicting financial growth, percentage, and decline. Flat design, blue outline with light blue fill, minimalistic style.
Free with trial Magnifying glass focuses on a blue bar graph with a visible downward trend line, set against a dark, blurred financial backdrop. Bars decrease in height from left to right, emphasizing a decline. The atmosphere is enhanced by subtle ambient reflections and lighting that highlight the graph's detail, symbolizing analysis of negative financial or economic trends. Decrease business graph illustrations Magnifying glass focused on a declining bar graph with a downward trend line on a dark background. Magnifying glass focuses on a blue bar graph with a visible downward trend line, set against a dark, blurred financial backdrop. Bars decrease in height from left to right, emphasizing a decline. The atmosphere is enhanced by subtle ambient reflections and lighting that highlight the graph's detail, symbolizing analysis of negative financial or economic trends.
Free with trial A grid of thin line icons illustrating business growth and financial concepts, featuring charts, graphs, money symbols, and people. Decrease business graph illustrations Business Growth and Financial Analytics Icon Collection with Charts and Money Keywords: business, growth, finance, analytics. A grid of thin line icons illustrating business growth and financial concepts, featuring charts, graphs, money symbols, and people
Free with trial A 3D rendered blue arrow pointing downwards is adorned with a pink circular tag featuring a white percentage symbol. The graphic is isolated on a clean white background, symbolizing a decrease or reduction. Decrease business graph illustrations Blue downward arrow with a pink percentage symbol tag on a white background decrease decline. A 3D rendered blue arrow pointing downwards is adorned with a pink circular tag featuring a white percentage symbol. The graphic is isolated on a clean white background, symbolizing a decrease or reduction
Free with trial Three prominent green downward-pointing arrows each bearing a percentage symbol represent a decrease in financial values or rates. This visual depicts economic decline or reduction effectively. Decrease business graph illustrations Green percentage down arrows symbolizing declining rates finance business growth reduction. Three prominent green downward-pointing arrows each bearing a percentage symbol represent a decrease in financial values or rates. This visual depicts economic decline or reduction effectively
Free with trial Dynamic graph showcasing a decreasing line and an increasing line in vibrant shades of orange, Generated by AI. Decrease business graph illustrations Dynamic graph showcasing a decreasing line and an increasing line in vibrant shades of orange
Free with trial Cartoon bar graph on an easel with a red arrow indicating a downward trend. Clear details and vib. Decrease business graph illustrations Cartoon Bar Graph Showing Downward Trend with Red Arrow chart bar chart. Cartoon bar graph on an easel with a red arrow indicating a downward trend. Clear details and vib
Free with trial Vector icon of a bar chart and graph showing a downward trend financial crisis and recession concept. Decrease business graph vectors Vector icon of a bar chart and graph showing a downward trend financial crisis and recession concept
Free with trial A man is presenting business data on a whiteboard, using a laptop. The chart shows growth and success. He is explaining the strategy and planning to his colleagues. Decrease business graph illustrations Man presenting business data on a whiteboard isolated on white background. A man is presenting business data on a whiteboard, using a laptop. The chart shows growth and success. He is explaining the strategy and planning to his colleagues
Free with trial A stylized flat design of a declining graph with an alert symbol, signifying financial risk and investment losses on a black background. Decrease business graph vectors Financial Risk Warning Graphic: Declining Graph with Alert Symbol for Investment Losses. A stylized flat design of a declining graph with an alert symbol, signifying financial risk and investment losses on a black background.
Free with trial A businessman analyzes a declining business showing financial loss. He uses a laptop to study financial data charts illustrating a downward trend and falling figures. This image effectively conveys concepts of failure, risk, and economic decline, suitable for business and finance publications. Decrease business graph illustrations Businessman analyzing declining business performance using laptop and financial data charts. A businessman analyzes a declining business showing financial loss. He uses a laptop to study financial data charts illustrating a downward trend and falling figures. This image effectively conveys concepts of failure, risk, and economic decline, suitable for business and finance publications
Free with trial Simple vector illustration of a computer screen displaying a downward trending graph. Decrease business graph vectors Computer screen showing graph going down icon. Simple vector illustration of a computer screen displaying a downward trending graph
Free with trial A bear figurine is positioned in front of a computer monitor showing a declining stock market graph. The graph displays a sharp decline in value, represented by a red line on a black background. The bear figurine is likely a symbol of a bear market, indicating a pessimistic outlook on the economy or a specific investment. The image conveys a sense of concern and worry about the financial situation. Decrease business graph illustrations A bear figurine stands in front of a computer monitor displaying a declining stock market graph. A bear figurine is positioned in front of a computer monitor showing a declining stock market graph. The graph displays a sharp decline in value, represented by a red line on a black background. The bear figurine is likely a symbol of a bear market, indicating a pessimistic outlook on the economy or a specific investment. The image conveys a sense of concern and worry about the financial situation.
Free with trial Financial Loss and Stock Market Crash Concept with Red Downward Trend Graph on Digital Tablet generate using AI. Decrease business graph illustrations Financial Loss and Stock Market Crash Concept with Red Downward Trend Graph on Digital Tablet
Free with trial Downward bar chart with red arrow indicating economic downturn or business failure illustration. Decrease business graph vectors Downward bar chart with red arrow indicating economic downturn or business failure illustration
Free with trial A green line graph shows a downward trend, with arrows indicating the direction. it's a visual representation of decline or loss. Decrease business graph illustrations Green line graph showing downward trend with arrows indicating direction on a plain setting. a green line graph shows a downward trend, with arrows indicating the direction. it's a visual representation of decline or loss.
Free with trial This image features a bar chart with orange bars representing performance metrics that steadily decrease over time, accompanied by a downward-sloping line graph that tracks the same trend against a blurred office background. Decrease business graph illustrations A bar chart showing a steady decline in performance metrics over a series of sequential periods. This image features a bar chart with orange bars representing performance metrics that steadily decrease over time, accompanied by a downward-sloping line graph that tracks the same trend against a blurred office background
Free with trial 3D rendered financial graph with percentage signs showing downward trend. Falling arrow, bar chart, economic crisis, losses, financial decline, market crash, budget deficit, investment. Decrease business graph illustrations 3D rendered financial graph with percentage signs showing downward trend. Falling arrow, bar chart, economic crisis, losses
Free with trial A bar chart shows a downward trend with a red arrow on a wooden easel. Clear details and vibrant. Decrease business graph illustrations Downward Trend Bar Chart with Red Arrow on Easel graph business. A bar chart shows a downward trend with a red arrow on a wooden easel. Clear details and vibrant
Free with trial A visual representation of a stock market decline, featuring a red financial graph with a downward trend. The image signifies a bearish market, potential losses, and economic downturns. Decrease business graph illustrations Stock market crash red financial graph showing bearish trend and market decline. A visual representation of a stock market decline, featuring a red financial graph with a downward trend. The image signifies a bearish market, potential losses, and economic downturns
Free with trial Wooden dollar sign stands front of declining stock market graph. Concept of financial crisis, recession, economic downturn market crash. Symbol of money loss and investment risk. Decrease business graph illustrations Wooden dollar sign stands front of declining stock market graph. Concept of financial crisis, recession, economic downturn
Free with trial Abstract financial trading graph with candlestick charts and data analysis on a dark background. Decrease business graph illustrations Abstract financial trading graph with candlestick charts and data analysis on a dark background
Free with trial Financial graph illustrates the decline in Bitcoin value, depicted with a red arrow and blue graph bars in a flat vector style. Decrease business graph vectors Bitcoin value declining depicted through a financial graph and currency on black background. Financial graph illustrates the decline in Bitcoin value, depicted with a red arrow and blue graph bars in a flat vector style.
Free with trial Flat vector design showcasing a downward trending graph with a distinct red arrow. Represents market decline and financial challenges against a stark black background. Decrease business graph vectors Downward Graph with Arrow: A Visual Representation of Market Downturn and Financial Loss. Flat vector design showcasing a downward trending graph with a distinct red arrow. Represents market decline and financial challenges against a stark black background.
Free with trial A flat vector illustration of a declining bar graph with a red arrow on a black background illustrating financial loss. Decrease business graph vectors Declining Bar Graph with Red Arrow Illustrating Financial Downturn on Black Background. A flat vector illustration of a declining bar graph with a red arrow on a black background illustrating financial loss.
Free with trial Downward trend graph on clipboard icon representing financial loss and negative market performance. Decrease business graph vectors Downward trend graph on clipboard icon representing financial loss and negative market performance
Free with trial Decrease bar chart icon set on black circle. Market crash illustration concept. Decrease business graph vectors Decrease bar chart icon set on black circle. Market crash concept. Decrease bar chart icon set on black circle. Market crash illustration concept
Free with trial Economy growth graph down vector icon illustration. Decrease business graph vectors Economy growth graph down icon design. economy growth graph down vector icon illustration
Free with trial Clean vector icon illustrating a declining line graph with push pins, symbolizing data analysis. Decrease business graph illustrations Line graph decline chart icon. Clean vector icon illustrating a declining line graph with push pins, symbolizing data analysis
Free with trial Percent growth and decline icon vector. Increase and decrease percentage arrow concept. Decrease business graph vectors Percent growth and decline icon. Increase and decrease percentage arrow concept
Free with trial The image depicts a gray ladder with black text on each rung, leaning against a blue background with a subtle white graph. Green and red arrows of varying sizes point up and down, indicating change. The ladder's rungs are labeled with 'position' numbers, and a magnifying glass rests on it. The scene symbolizes growth, progress, and examination in a professional or business context, with the arrows. This image was generated using artificial intelligence. Decrease business graph illustrations A gray ladder with black text leans on a blue background with green and red arrows pointing up and down showing change in position. The image depicts a gray ladder with black text on each rung, leaning against a blue background with a subtle white graph. Green and red arrows of varying sizes point up and down, indicating change. The ladder's rungs are labeled with 'position' numbers, and a magnifying glass rests on it. The scene symbolizes growth, progress, and examination in a professional or business context, with the arrows. This image was generated using artificial intelligence.
Free with trial A set of black and white icons representing different types of business and financial charts including bar graphs line graphs and pie charts. Decrease business graph vectors Collection of various business and financial chart icons including bar graphs line graphs and pie charts. A set of black and white icons representing different types of business and financial charts including bar graphs line graphs and pie charts
Free with trial A visual representation of a global economic downturn, featuring a world globe, a downward-pointing red arrow, and a stock market graph overlay, all set against a dark background. Decrease business graph illustrations Global economic downturn depicted with a world globe, red arrow, and stock market graph overlay. A visual representation of a global economic downturn, featuring a world globe, a downward-pointing red arrow, and a stock market graph overlay, all set against a dark background.
Free with trial Computer monitor displaying a descending red line graph with an arrow indicating a downward trend. Decrease business graph vectors Computer monitor displaying a descending red line graph with an arrow indicating a downward trend
Free with trial The "Vector Up and Down Graph Icon" is a graphic symbol designed to represent data trends, changes, or comparisons within a graph or chart. Decrease business graph vectors Vector Up And Down Graph Icon. Up And Down Chart Icon. Growth Diagram Icon. The "Vector Up and Down Graph Icon" is a graphic symbol designed to represent data trends, changes, or comparisons within a graph or chart.
Free with trial The "Vector Up and Down Graph Icon" is a graphic symbol designed to represent data trends, changes, or comparisons within a graph or chart. Decrease business graph vectors Vector Up And Down Graph Icon. Up And Down Chart Icon. Growth Diagram Icon. The "Vector Up and Down Graph Icon" is a graphic symbol designed to represent data trends, changes, or comparisons within a graph or chart
Free with trial Flat design illustration showing colorful bar graph combined with a line chart, both displaying data trends against a simple black background. Decrease business graph vectors Colorful Bar Graph and Line Chart on Black Background Illustrating Data Analysis and Trends. Flat design illustration showing colorful bar graph combined with a line chart, both displaying data trends against a simple black background.
Free with trial A flat, high-contrast, black-and-white icon depicting a bar graph with a downward-pointing arrow. The bars represent a data set that is shrinking or declining over time, with the final arrow emphasizing a negative or losing trend in business or financial metrics. Decrease business graph vectors A minimalist black and white icon showing a downward bar chart indicating a significant loss trend. A flat, high-contrast, black-and-white icon depicting a bar graph with a downward-pointing arrow. The bars represent a data set that is shrinking or declining over time, with the final arrow emphasizing a negative or losing trend in business or financial metrics
Free with trial Hand Drawn Bar Chart Line Graph with Downtrend Arrow Showcasing Loss and Negative Economic Growth. Decrease business graph vectors Hand Drawn Bar Chart Line Graph with Downtrend Arrow Showcasing Loss and Negative Economic Growth
Free with trial Financial Data Chart Analysis with Glowing Stock Market Uptrend Graph in Blue and Orange Colors, Generated by AI. Decrease business graph illustrations Financial Data Chart Analysis with Glowing Stock Market Uptrend Graph in Blue and Orange Colors. Generated by AI
Free with trial A stylized bar graph illustration depicts a financial decline with a downward trending arrow and dollar sign over a black background. Decrease business graph vectors Declining bar graph with downward trending arrow and dollar sign against black backdrop. A stylized bar graph illustration depicts a financial decline with a downward trending arrow and dollar sign over a black background.
Free with trial Performance showing colorful graph with magnifying glass and pie chart on white background keywords: graph, chart, data, analytics, statistics. Decrease business graph illustrations Colorful graph with magnifying glass and pie chart on white background Keywords: graph, chart, data, analytics
Free with trial A 3D bar graph displays a downward trend represented by a red arrow. The bars are composed of orange, green, and red cubes, illustrating fluctuating data points. The overall mood is one of decline or setback. Decrease business graph illustrations Red Arrow Downward Trend Chart Showing Decreasing Business Growth Statistics with Green Orange. A 3D bar graph displays a downward trend represented by a red arrow. The bars are composed of orange, green, and red cubes, illustrating fluctuating data points. The overall mood is one of decline or setback
Free with trial A flat illustration presents a declining graph paired with a dollar coin, symbolizing financial loss and economic downturn with clean lines and colors. Decrease business graph vectors Financial Loss Concept: Graph Depicting Decline with a Dollar Coin, Economy and Investment. A flat illustration presents a declining graph paired with a dollar coin, symbolizing financial loss and economic downturn with clean lines and colors.
Free with trial This image shows a red bar graph with a downward trend indicated by a down arrow, and an upward trend indicated by an up arrow, set against a white background. Decrease business graph vectors Vector art of red bar graph showing a downward trend with an arrow pointing down and an upward trend with an arrow pointing up. This image shows a red bar graph with a downward trend indicated by a down arrow, and an upward trend indicated by an up arrow, set against a white background
Free with trial Market fluctuation in Euro currency. Devaluation and decrease in exchange rate value of Euro. Recession, inflation, depression and falling economy. 3D render. Decrease business graph illustrations Devaluation and decrease in exchange rate value of Euro
Free with trial Falling red arrow illustrating financial downturn on dark grid stock market economic crisis graph Vector illustration for high-quality printing. Decrease business graph illustrations Falling red arrow illustrating financial downturn on dark grid , stock market, economic crisis, graph. Falling red arrow illustrating financial downturn on dark grid stock market economic crisis graph Vector illustration for high-quality printing
Free with trial Falling red arrow on a financial graph illustrating economic downturn instability economy financial markets Suitable for digital platforms. Decrease business graph illustrations Falling red arrow on a financial graph illustrating economic downturn , instability, economy, financial markets. Falling red arrow on a financial graph illustrating economic downturn instability economy financial markets Suitable for digital platforms
Free with trial Abstract illustration of financial crisis, economic downturn. Falling red forex chart on grid. Concept of market crash, stock exchange rate decrease, bankrupt business falling price. Decrease business graph illustrations Abstract illustration of financial crisis, economic downturn. Falling red forex chart on grid. Concept of market crash, stock
Free with trial A red line graph with percentage symbols shows a downward trend, superimposed over stacks of gold coins, isolated on a white background. Decrease business graph illustrations Financial graph showing decreasing interest rates with coin stacks isolated on white background. A red line graph with percentage symbols shows a downward trend, superimposed over stacks of gold coins, isolated on a white background
Free with trial Descending bar graph icon with downward arrow, decline in sales or profits, loss chart, bad investment. Decrease business graph vectors Descending bar graph icon with downward arrow, decline in sales or profits, loss chart, bad investment
Free with trial Illuminated descending bar graph against a gradient blue background suggesting decline. Generative AI. Decrease business graph illustrations Illuminated descending bar graph against a gradient blue background suggesting decline
Free with trial Green screen chart analysis, data visualization, metrics tracking, business growth ,Generative ai. Decrease business graph illustrations Green screen chart analysis, datadriven insights for business growth and performance tracking. Green screen chart analysis, data visualization, metrics tracking, business growth ,Generative ai
Free with trial A digital screen displays a red stock market graph in a financial district. The graph depicts a downward trend, suggesting potential losses or a market downturn, with city buildings out of focus in the background. Decrease business graph illustrations Red Stock Market Graph displayed on a digital screen in the Financial District. A digital screen displays a red stock market graph in a financial district. The graph depicts a downward trend, suggesting potential losses or a market downturn, with city buildings out of focus in the background
Free with trial Declining Bar Graph with Arrow, Decreasing Statistics, Market Downturn, Financial Loss, Negative Trend. Decrease business graph vectors Declining Bar Graph with Arrow, Decreasing Statistics, Market Downturn, Financial Loss, Negative Trend
Free with trial Green arrow showing a downward trend in a dark hallway. Concept of business decline or falling performance in an organization or education. Decrease business graph illustrations Green arrow showing a downward trend in a dark hallway. Concept of business decline or falling performance
Free with trial A 3D bar graph with blue bars decreasing in height from left to right, accompanied by a large red arrow pointing downwards, symbolizing a sharp decline or drop in data over a certain period. Decrease business graph illustrations Graph showing a significant decline in values over time with a red arrow indicating downward trend. A 3D bar graph with blue bars decreasing in height from left to right, accompanied by a large red arrow pointing downwards, symbolizing a sharp decline or drop in data over a certain period
Free with trial A hand in a suit holds a magnifying glass over a financial graph showing a downward trend. The graph blue and white bars and a black line indicating a decline in values. The magnifying glass highlights the graph's data points, emphasizing analysis and cost reduction. The background is a dark blue gradient, and the overall style is a clean, flat. Decrease business graph illustrations Hand holding magnifying glass over downward trending financial graph with cost reduction concept. A hand in a suit holds a magnifying glass over a financial graph showing a downward trend. The graph blue and white bars and a black line indicating a decline in values. The magnifying glass highlights the graph's data points, emphasizing analysis and cost reduction. The background is a dark blue gradient, and the overall style is a clean, flat
Free with trial A 3D bar graph with blue bars decreasing in height from left to right, accompanied by a large red arrow pointing downwards, symbolizing a sharp decline or drop in data over a certain period. Decrease business graph vectors Graph showing a significant decline in values over time with a red arrow indicating downward trend. A 3D bar graph with blue bars decreasing in height from left to right, accompanied by a large red arrow pointing downwards, symbolizing a sharp decline or drop in data over a certain period
Free with trial Financial Market Data, Red Stock Chart Lines over a Cityscape at Night, Business and Finance Concept, Generated by AI. Decrease business graph illustrations Financial Market Data, Red Stock Chart Lines over a Cityscape at Night, Business and Finance Concept
Free with trial Vibrant Cityscape at Night with Illuminated Buildings and a Falling Graph Economic Downturn Concept, Generated by AI. Decrease business graph illustrations Vibrant Cityscape at Night with Illuminated Buildings and a Falling Graph Economic Downturn Concept