Free with trial Infographic with graph of decrease business of china, chinese trade with icons of flag, yuan and map in flat design. Decrease business graph vectors Infographic with graph of decrease business of china
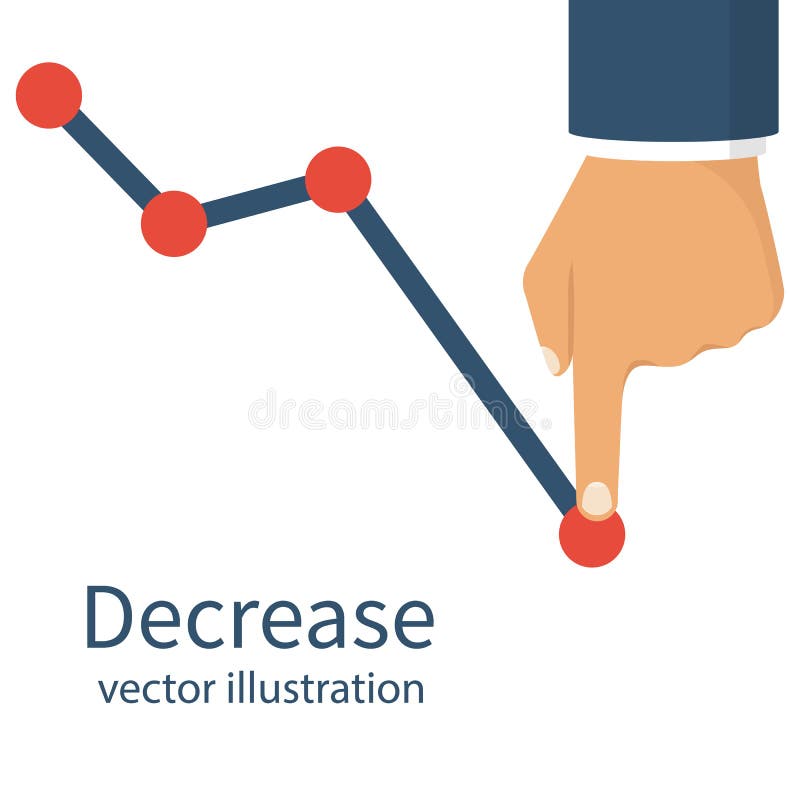
Free with trial Businessman runs and holds coins on a red arrow graph decrease on a stack of coins to coin slot. Business Down, wealth create, financial, investment goal, corporate develop, economic, profit and loss. Decrease business graph vectors Businessman runs and holds coins on a red arrow graph decrease on a stack of coins to coin slot. Business Down, wealth create
Free with trial Finance decrease and crisis graph. Falling down business chart arrow, economic budget collapse, market risks and panic people vector set. Business problem and economy drop, money loss. Decrease business graph vectors Finance decrease and crisis graph. Falling down business chart arrow, economic budget collapse, market risks and panic people
Free with trial Business growth up and down infographics | business graph going down | 3d graph chart decrease infographics - 4k desktop background. Decrease business graph illustrations Business growth up and down infographics | business graph going down | 3d graph chart decrease infographics. Business growth up and down infographics | business graph going down | 3d graph chart decrease infographics - 4k desktop background
Free with trial Business growth up and down infographics | business graph going down | 3d graph chart decrease infographics - 4k desktop background. Decrease business graph illustrations Business growth up and down infographics | business graph going down | 3d graph chart decrease infographics. Business growth up and down infographics | business graph going down | 3d graph chart decrease infographics - 4k desktop background
Free with trial Set line Graph, chart, diagram, Financial growth decrease and Many ways directional arrow. Business infographic template. Vector. Decrease business graph vectors Set line Graph, chart, diagram, Financial growth decrease and Many ways directional arrow. Business infographic template
Free with trial Decline stage concept set. Finance crisis with falling down graph and income decrease. Idea of bancruptcy and business risk. Money loss. Decrease business graph vectors Decline stage concept set. Finance crisis with falling down graph and income decrease. Idea of bancruptcy and business risk. Money
Free with trial Decline stage concept set. Finance crisis with falling down graph and income decrease. Idea of bancruptcy and business risk. Money loss. Decrease business graph vectors Decline stage concept set. Finance crisis with falling down graph and income decrease. Idea of bancruptcy and business risk. Money
Free with trial Red bar graph shows decline with downward arrow, representing financial loss. Business failure reduced performance or decrease of value. Negative trend report. Decrease business graph illustrations Red bar graph shows decline with downward arrow, representing financial loss. Business failure, reduced performance or decrease. Red bar graph shows decline with downward arrow, representing financial loss. Business failure reduced performance or decrease of value. Negative trend report.
Free with trial Decline stage concept set. Finance crisis with falling down graph and income decrease. Idea of bancruptcy and business risk, set flat vector modern illustration. Decrease business graph vectors Decline stage concept set. Finance crisis with falling down graph and income decrease. Idea of bancruptcy and business risk, set
Free with trial Decline stage concept set. Finance crisis with falling down graph and income decrease. Idea of bancruptcy and business risk, set flat vector modern illustration. Decrease business graph vectors Decline stage concept set. Finance crisis with falling down graph and income decrease. Idea of bancruptcy and business risk, set
Free with trial Business growing graph icon set profit increase decrease arrow up down market investment business finance vector black design. Decrease business graph vectors Business growing graph icon set profit increase decrease arrow up down market investment business finance vector black
Free with trial Graph and diagram from boats with decrease. Finance and business concept. 3D Illustration. 3D rendering on blue background. Decrease business graph illustrations Graph and diagram from boats with decrease. Finance and business concept. 3D Illustration.3D rendering
Free with trial Graph and diagram from planes with decrease. Finance and business concept. 3D Illustration. 3D rendering on blue background. Decrease business graph illustrations Graph and diagram from planes with decrease. Finance and business concept. 3D Illustration.3D rendering
Free with trial Graph and diagram from planes with decrease. Finance and business concepts. 3D Illustration isolated. 3D rendering on blue background. Decrease business graph illustrations Graph and diagram from planes with decrease. Finance and business concepts. 3D Illustration isolated.
Free with trial Percent decrease arrow vector icon. GDP market business profit percent arrow down graph. Decrease business graph vectors Percent decrease arrow vector icon. GDP market business percent arrow down. Percent decrease arrow vector icon. GDP market business profit percent arrow down graph
Free with trial Increase and decrease. Business. Finance chart and abstract graph. Arrow up and down. Pixel Perfect Vector Thin Line Icons. Simple Minimal Pictogram. Decrease business graph vectors Increase and decrease. Business. Finance chart. Increase and decrease. Business. Finance chart and abstract graph. Arrow up and down. Pixel Perfect Vector Thin Line Icons. Simple Minimal Pictogram
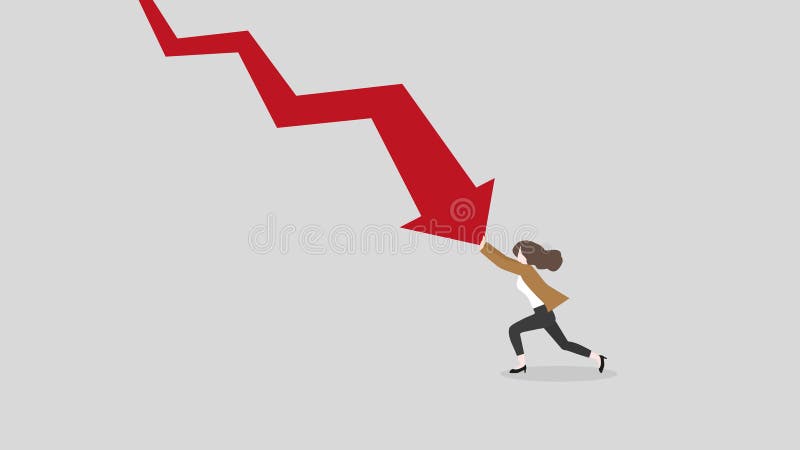
Free with trial A businesswoman pushes decrease business chart diagram. A minimal style of a red down graph of the financial crisis, economic downturn, inflation, recession, failure, bankruptcy, and crisis concept. Decrease business graph vectors A businesswoman pushes decrease business chart diagram
Free with trial Stock and economic crisis graph background. Trade exchange, financial decrease, bed business strategy, digital asset, loss investment fund, online broker, stock collapse and crisis concept. Decrease business graph vectors Stock and economic crisis graph background. Trade exchange, financial decrease
Free with trial Stock and economic crisis graph background. Trade exchange, financial decrease, bed business strategy, digital asset, loss investment fund, online broker, stock collapse and crisis concept. Decrease business graph illustrations Stock and economic crisis graph background. Trade exchange, financial decrease
Free with trial Decrease graph. Businessman hand down profit business chart. Stock financial trade market diagram. Vector illustration flat design. Isolated on white background. Declining graph. Downward arrow. Decrease business graph vectors Decrease graph vector isolated icon on blue background. Decrease graph. Businessman hand down profit business chart. Stock financial trade market diagram. Vector illustration flat design. Isolated on white background. Declining graph. Downward arrow.
Free with trial Stock and economic crisis graph background. Trade exchange, financial decrease, bed business strategy, digital asset, loss investment fund, online broker, stock collapse and crisis concept. Decrease business graph illustrations Stock and economic crisis graph background. Trade exchange, financial decrease
Free with trial Cost low and loss. Decrease revenue. Crisis of economy. Icon of money inflation. Graph of financial investment with arrow down. Reduction of business. Bankruptcy of company or lack of budget. Vector. Decrease business graph vectors Cost low and loss. Decrease revenue. Crisis of economy. Icon of money inflation. Graph of financial investment with arrow down.
Free with trial Businessman and decrease graph background. The concept of business failure. Vector illustration. Decrease business graph vectors Businessman and decrease graph background
Free with trial Business graph with red arrow down represents the decrease, three-dimensional rendering, 3D illustration. Decrease business graph illustrations Business graph down #2. Business graph with red arrow down represents the decrease, three-dimensional rendering, 3D illustration
Free with trial Decrease graph icon. Businessman hand down profit business chart. Stock financial trade market diagram. Vector illustration flat design. Isolated on white background. Declining graph. Downward arrow. Decrease business graph vectors Decrease graph icon
Free with trial Business graph with red arrow down represents the decrease, three-dimensional rendering, 3D illustration. Decrease business graph illustrations Business graph down #3. Business graph with red arrow down represents the decrease, three-dimensional rendering, 3D illustration
Free with trial Decrease graph. Businessman hand down profit business chart. Stock financial trade market diagram. Vector illustration flat design. on white background. Declining graph. Downward arrow. Decrease business graph vectors Decrease graph, declining. Decrease graph. Businessman hand down profit business chart. Stock financial trade market diagram. Vector illustration flat design. on white background. Declining graph. Downward arrow.
Free with trial Abstract Graph Decrease Badge And Label Collection, vector editable design, can be used for business or presentation design. Decrease business graph vectors Abstract Graph Decrease Badge And Label Collection
Free with trial Abstract Graph Decrease Silhouette Illustration, vector editable design, can be used for business or presentation design. Decrease business graph vectors Abstract Graph Decrease Silhouette Illustration
Free with trial Oil price decrease graph color line icon with down arrows, barrels and drop of crude oil. Economic and energy industry crisis vector outline symbol, economy downturn, finance and business recession. Decrease business graph vectors Oil price decrease graph line icon, energy crisis. Oil price decrease graph color line icon with down arrows, barrels and drop of crude oil. Economic and energy industry crisis vector outline symbol, economy downturn, finance and business recession
Free with trial Cost reduction graph displaying financial decrease with an interactive digital pen. High-resolution image featuring a laptop, smartphone, and ample copy space on a modern wooden desk. Perfect for business presentations, financial reports, and marketing campaigns. Decrease business graph illustrations Financial Cost Reduction Digital Graph, Business Laptop, Modern Office Workspace. Cost reduction graph displaying financial decrease with an interactive digital pen. High-resolution image featuring a laptop, smartphone, and ample copy space on a modern wooden desk. Perfect for business presentations, financial reports, and marketing campaigns.
Free with trial Financial graph with green and red pointers, Business strategy, Business concept, Price increase, Price decrease. Decrease business graph vectors Financial graph with green and red pointers, Business strategy, Business concept
Free with trial Financial graph with green and red pointers, Business strategy, Business concept, Price increase, Price decrease. Decrease business graph vectors Financial graph with green and red pointers, Business strategy, Business concept
Free with trial Financial graph with green and red pointers, Business strategy, Business concept, Price increase, Price decrease. Decrease business graph vectors Financial graph with green and red pointers, Business strategy, Business concept
Free with trial This vector illustration features a set of two minimalist graphs depicting a significant decline. Each graph includes a downward-sloping line chart with an accompanying filled area, clearly indicating a negative trend. One version is presented in black on a white background, while the other is white on a black background, offering versatile usage. This icon is ideal for illustrating concepts of business loss, economic recession, market downturns, financial crisis, poor performance, or any data showing a decrease. Perfect for presentations, reports, infographics, and web design. Decrease business graph vectors Declining Business Graph Icon Set - Negative Trend Chart. This vector illustration features a set of two minimalist graphs depicting a significant decline. Each graph includes a downward-sloping line chart with an accompanying filled area, clearly indicating a negative trend. One version is presented in black on a white background, while the other is white on a black background, offering versatile usage. This icon is ideal for illustrating concepts of business loss, economic recession, market downturns, financial crisis, poor performance, or any data showing a decrease. Perfect for presentations, reports, infographics, and web design.
Free with trial Up and down graph icons. Arrow charts, growth diagram and decline graph, business data analysis and financial trend. Market statistic information vector set. Increase and decrease graph symbols. Decrease business graph vectors Up and down graph icons. Arrow charts, growth diagram and decline graph, business data analysis and financial trend. Market
Free with trial Graph with decrease report. Diagram with recession and bankruptcy progress. Business and finance vector illustration. Decrease business graph vectors Graph with decrease report. Diagram with recession and bankruptcy progress
Free with trial Graph with decrease report. Diagram with recession and bankruptcy progress. Business and finance vector illustration. Decrease business graph vectors Graph with decrease report. Diagram with recession and bankruptcy progress
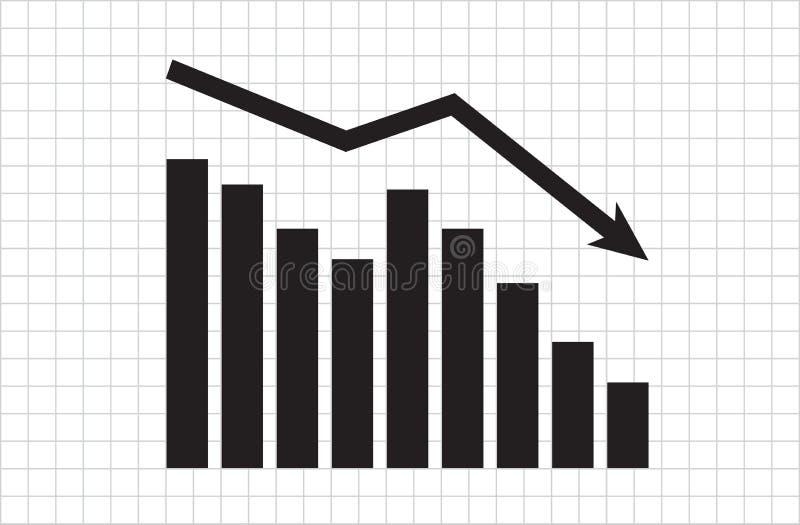
Free with trial Downward blue arrow, hand gesture, and declining bar graph. Ideal for business loss, negative trends, economy, failure, recession setback performance. Simple flat metaphor. Decrease business graph illustrations Downward Arrow with Hand and Declining Bar Graph Representing Business Loss or Decrease. Downward blue arrow, hand gesture, and declining bar graph. Ideal for business loss, negative trends, economy, failure, recession setback performance. Simple flat metaphor
Free with trial Business graph data in a bar chart showing increase and decrease with blue line illustration on plain background. Decrease business graph vectors Business graph data in a bar chart showing increase and decrease with blue line illustration on plain background
Free with trial Graph reduce CO2 or carbon concept. futuristic decrease down graph chart. CO2 emission using clean energy and limit global warming. green business from renewable energy. vector design. Decrease business graph illustrations Graph reduce CO2 or carbon concept. futuristic decrease down graph chart. CO2 emission using clean energy and limit global warming
Free with trial Abstract Graph Decrease Icon Set, vector editable design, can be used for business or presentation design. Decrease business graph vectors Abstract Graph Decrease Icon Set
Free with trial Finance data analytics, decrease graph line icon. Business research report analysis, finance performance analytics or company statistic outline vector icon column infographics and pointing down arrow. Decrease business graph illustrations Finance data analytics, decrease graph line icon
Free with trial Decline graph chart icon. Descending market stock scheme vector illustration. Decrease statistics symbol. Failing finance data sign. Arrow down economic analysis. Business loss trend. Report diagram. Decrease business graph vectors Decline graph chart icon. Descending market stock scheme vector illustration. Decrease statistics symbol. Failing finance data
Free with trial Stock and economic crisis graph background. Trade exchange, financial decrease, bed business strategy, digital asset, loss investment fund, online broker, stock collapse and crisis concept. Decrease business graph illustrations Stock and economic crisis graph background. Trade exchange, financial decrease
Free with trial A critical flat vector icon showing a downward trending line graph, symbolizing business decline, negative statistics, and falling values. Essential for financial warnings, market analysis, risk assessment, or performance reviews. It clearly visualizes a decrease in metrics and potential challenges, vector design Generative AI. Decrease business graph vectors Downward Trending Line Graph Icon for Business Decline, vector design Generative AI. A critical flat vector icon showing a downward trending line graph, symbolizing business decline, negative statistics, and falling values. Essential for financial warnings, market analysis, risk assessment, or performance reviews. It clearly visualizes a decrease in metrics and potential challenges, vector design Generative AI
Free with trial Bar graph showing a downward trend, business decline, economic decrease, market analysis, financial chart. Decrease business graph vectors Bar chart with downward trend arrow business decline graph. Bar graph showing a downward trend, business decline, economic decrease, market analysis, financial. Bar graph showing a downward trend, business decline, economic decrease, market analysis, financial chart
Free with trial A red graph with arrows illustrating decrease and increase, representing data analysis and performance evaluation in business. Suitable for reports and presentations. Decrease business graph vectors Vector art of red graph with arrow, illustrating decrease and increase, representing data analysis and performance evaluation in. A red graph with arrows illustrating decrease and increase, representing data analysis and performance evaluation in business. Suitable for reports and presentations
Free with trial A concise vector illustration of a red downward trending line graph, indicating an economic downturn or statistical decrease. This graphic is ideal for financial analysis, business reports, performance reviews, or economic forecasts. It clearly represents a decline in data, suitable for analytical and business-oriented designs, vector design Generative AI. Decrease business graph vectors Red downward trend line graph, economic downturn, statistical decrease, vector design Generative AI. A concise vector illustration of a red downward trending line graph, indicating an economic downturn or statistical decrease. This graphic is ideal for financial analysis, business reports, performance reviews, or economic forecasts. It clearly represents a decline in data, suitable for analytical and business-oriented designs, vector design Generative AI
Free with trial Decrease graph line icon, outline vector sign, linear style pictogram isolated on white. Business bar chart symbol, logo illustration. Editable stroke. Decrease business graph vectors Decrease graph line icon
Free with trial Business problems, financial decrease graph vector illustration. Businessman hand down profit business chart. Stock financial trade market diagram. Declining graph. Downward arrow. Decrease business graph vectors Business problems, financial decrease graph vector illustration. Businessman hand down profit business chart. Stock
Free with trial Economic crisis icon with bar graph, coronavirus cell and dolar symbol. Business concept. Graph that shows decrease in sales or earnings because of coronavirus Covid-19. Decrease business graph vectors Economic crisis icon with bar graph, coronavirus cell and dolar symbol. Business concept
Free with trial Business decline graph vector icon. Decrease diagram filled flat sign for mobile concept and web design. Falling graph arrow glyph icon. Crisys symbol, logo illustration. Vector graphics. Decrease business graph vectors Business decline graph vector icon
Free with trial Economic crisis icon with bar graph, coronavirus cell and euro symbol. Business concept. Graph that shows decrease in sales or earnings because of coronavirus Covid-19. Decrease business graph vectors Economic crisis icon with bar graph, coronavirus cell and euro symbol. Business concept
Free with trial 3d illustration: Black barrels of oil graph chart stock market with red line arrow on a grid. Petroleum business, black gold, gasoline production. Purchase sale, auction, exchange. Profit decrease. Decrease business graph illustrations 3d illustration: Black barrels of oil graph chart stock market with red line arrow on a grid. Petroleum business, black gold, ga
Free with trial Business graph arrow dropping down. Price falling, decrease, bankrupt concept. 3d render. Decrease business graph illustrations Business graph arrow dropping down. Price falling, bankruptcy concept. Business graph arrow dropping down. Price falling, decrease, bankrupt concept. 3d render
Free with trial Graph table arrow decrease icon. dollar money fall down symbol. economy stretching rising drop. Business lost crisis decrease. cost reduction bankrupt icon. vector illustration. Decrease business graph vectors Graph table arrow decrease icon. dollar money fall down symbol. economy stretching rising drop. Business lost crisis decrease. cos
Free with trial Decrease graph icon vector, filled flat sign, solid pictogram isolated on white. Business bar chart symbol, logo illustration. Decrease business graph vectors Decrease graph icon vector
Free with trial Decrease graph concept. Young guy at laptop analyzes graphs and charts. Modern technologies and work with statistics. Business failures, unlucky entrepreneur. Cartoon flat vector illustration. Decrease business graph vectors Decrease graph concept
Free with trial Woman courier near rising and falling graph symbolizing changing trends in logistics business. Courier girl falls after onset of crisis and decrease in flow of customers from online stores. Decrease business graph vectors Woman courier near rising and falling graph symbolizing changing trends in logistics business
Free with trial Business decline graph line icon. Decrease diagram linear style sign for mobile concept and web design. Falling graph arrow outline vector icon. Crisys symbol, logo illustration. Vector graphics. Decrease business graph vectors Business decline graph line icon
Free with trial Business decline graph line icon. Decrease diagram linear style sign for mobile concept and web design. Falling graph arrow outline vector icon. Crisys symbol, logo illustration. Vector graphics. Decrease business graph vectors Business decline graph line icon
Free with trial Business decline graph line icon. Decrease diagram linear style sign for mobile concept and web design. Falling graph arrow outline vector icon. Crisys symbol, logo illustration. Vector graphics. Decrease business graph vectors Business decline graph line icon
Free with trial Economic crisis icon with bar graph and rocket. Business symbol. Graph that shows decrease in sales or earnings. Decrease business graph vectors Economic crisis icon with bar graph and rocket. Business symbol
Free with trial Decreasing graph with point down arrow, concept of business loss, 3D rendering illustration. Decrease business graph illustrations Decrease graph with point down arrow, concept of business loss, 3D rendering illustration
Free with trial Large mobile phone with falling red business graph. Sad young blogger girl on knees. decrease in views and subscribers. Internet statistics. Business problem. woman and a smartphone. Flat illustration. Decrease business graph vectors Large mobile phone with falling red business graph. Sad young blogger girl on knees. decrease in views and subscribers
Free with trial Cargo ship, cargo container work with crane at dock, port or harbour. Freight transport with drop arrow, decrease graph or bar chart. Concept of business, import export, market, trade, demand, supply. Decrease business graph illustrations Cargo ship, cargo container and crane at port. Concept of decrease, business. Cargo ship, cargo container work with crane at dock, port or harbour. Freight transport with drop arrow, decrease graph or bar chart. Concept of business, import export, market, trade, demand, supply
Free with trial Statistics word and green decrease graph. Business concept. Economic data. Population survey. Negative report. 3d render. Decrease business graph illustrations Statistics word and green decrease graph
Free with trial Graph table arrow decrease icon. dollar money fall down symbol. economy stretching rising drop. Business lost crisis decrease. cost reduction bankrupt icon. vector illustration. Decrease business graph vectors Graph table arrow decrease icon. dollar money fall down symbol. economy stretching rising drop. Business lost crisis decrease. cos
Free with trial Vector illustration of corporate business dynamics increase and decrease graph icon symbol. black and white color, line drawing style. color can be edited. 2500 x 2500 pixel perfect. Decrease business graph vectors Vector illustration of corporate business dynamics increase and decrease graph icon symbol.
Free with trial An icon of a line graph showing a downward trend, symbolizing decline, decrease, or negative performance. Ideal for financial reports, market analysis, and economic downturns. Represents challenges and reduction, perfect for business analytics and reports, vector design Generative AI. Decrease business graph vectors Downward Trend Graph Icon for Business Decline, vector design Generative AI. An icon of a line graph showing a downward trend, symbolizing decline, decrease, or negative performance. Ideal for financial reports, market analysis, and economic downturns. Represents challenges and reduction, perfect for business analytics and reports, vector design Generative AI
Free with trial A minimal style of a red down graph of the financial crisis, economic downturn, inflation, recession, failure, bankruptcy, and crisis concept. A businessman pushes a decrease business chart diagram. Decrease business graph vectors A businessman pushes a decrease business chart diagram
Free with trial A minimal style of a red down graph of the financial crisis, economic downturn, inflation, recession, failure, bankruptcy, and crisis concept. A businessman push up a decrease business chart diagram. Decrease business graph vectors A businessman push up a decrease business chart diagram
Free with trial Businessman stick figure character downfall when try to hold decrease arrow graph chart with a rope. Business failure, investment loss, market crash crisis. hand drawn style vector doodle illustration. Decrease business graph vectors Businessman stick figure character downfall when try to hold decrease arrow graph chart with a rope. Business failure, investment
Free with trial Stock market candle stick graph. business and stock market graph. arrow decrease vector. Decrease business graph vectors Stock market candle stick graph. business and stock market graph
Free with trial A minimal style of a red down graph of the financial crisis, economic downturn, inflation, recession, failure, bankruptcy, and crisis concept. Businessmen team push a decrease business chart diagram. Decrease business graph vectors Businessmen team push a decrease business chart diagram
Free with trial A minimal style of a red down graph of the financial crisis, economic downturn, inflation, recession, failure, bankruptcy, and crisis concept. Businessmen team push a decrease business chart diagram. Decrease business graph vectors Businessmen team push a decrease business chart diagram
Free with trial This image features a striking red neon-style line graph on a black background, symbolizing decline, decrease, or downward trend in data visualization. Ideal for business, finance, and analytics concepts, it visually represents performance drops or negative growth in a modern, eye-catching manner. Decrease business graph illustrations Red Neon Declining Graph Line Icon for Business Data Visualization. This image features a striking red neon-style line graph on a black background, symbolizing decline, decrease, or downward trend in data visualization. Ideal for business, finance, and analytics concepts, it visually represents performance drops or negative growth in a modern, eye-catching manner.
Free with trial Graph table arrow decrease icon. dollar money fall down symbol. economy stretching rising drop. Business lost crisis decrease. cost reduction bankrupt icon. vector illustration. Decrease business graph vectors Graph table arrow decrease icon. dollar money fall down symbol. economy stretching rising drop. Business lost crisis decrease. cos