Free with trial Flat icons related to financial transactions pertaining to business or personal both. Very well crafted business and finance icons set to be used in related projects. Grab this pack and enjoy designing. Decrease calculation illustrations Set of Business and Finance Flat Icons. Flat icons related to financial transactions pertaining to business or personal both. Very well crafted business and finance icons set to be used in related projects. Grab this pack and enjoy designing
Free with trial A percentage sign is a symbol used to indicate a proportion or ratio in relation to a whole. It is commonly used in finance, business, and marketing contexts, and more. Decrease calculation vectors Illustration of a percentage sign, a symbol used to indicate a proportion or ratio in relation to a whole. A percentage sign is a symbol used to indicate a proportion or ratio in relation to a whole. It is commonly used in finance, business, and marketing contexts, and more
Free with trial Stacks of gold coins in front. Blur model plane in background. Sunny light shines. Image represents air travel cost, vacation budget, holiday planning, flight expense saving money for. Decrease calculation illustrations Stacks of gold coins in front. Blur model plane in background. Sunny light shines. Image represents air travel cost, vacation
Free with trial Red 3D 1% Percentage Symbol for Finance and Discount Concepts. Decrease calculation illustrations Red 3D 1% Percentage Symbol for Finance
Free with trial A charming 3D render of a percentage symbol (%) composed of soft, pastel-colored elements. The two circles are rendered in a delicate pink and a calming blue, while the diagonal line is a gentle mint green. The objects have a smooth, rounded texture, suggesting a playful and approachable aesthetic. The symbol is subtly lit, casting a soft shadow on a clean white background, making it ideal for designs related to finance, sales, discounts, or any concept requiring a percentage representation with a modern and friendly feel. Decrease calculation vectors Soft Pastel Percentage Symbol 3D Render. A charming 3D render of a percentage symbol (%) composed of soft, pastel-colored elements. The two circles are rendered in a delicate pink and a calming blue, while the diagonal line is a gentle mint green. The objects have a smooth, rounded texture, suggesting a playful and approachable aesthetic. The symbol is subtly lit, casting a soft shadow on a clean white background, making it ideal for designs related to finance, sales, discounts, or any concept requiring a percentage representation with a modern and friendly feel.
Free with trial Percent Symbol Isolated on White Background for Financial and Mathematical Design. Illustration. Decrease calculation illustrations Percent Symbol Isolated on White Background
Free with trial A clean and modern vector illustration of a percentage sign, featuring two pale yellow circles with maroon outlines and a light blue diagonal bar also outlined in maroon. This simple graphic is set against a crisp white background, making it versatile for various design projects. It effectively conveys concepts of discounts, sales, financial rates, statistics, and promotions. Ideal for use in business presentations, marketing materials, educational content, websites, and mobile applications to highlight numerical data or special offers. Decrease calculation vectors Percentage Sign Vector Icon Illustration. A clean and modern vector illustration of a percentage sign, featuring two pale yellow circles with maroon outlines and a light blue diagonal bar also outlined in maroon. This simple graphic is set against a crisp white background, making it versatile for various design projects. It effectively conveys concepts of discounts, sales, financial rates, statistics, and promotions. Ideal for use in business presentations, marketing materials, educational content, websites, and mobile applications to highlight numerical data or special offers.
Free with trial Minus or negative sign vector illustration, cute mathematical symbol. Decrease calculation vectors Minus or negative sign vector illustration, cute mathematical symbol
Free with trial A set of colorful, glossy buttons featuring plus and minus signs. Decrease calculation vectors Vector Icons for Addition and Subtraction. A set of colorful, glossy buttons featuring plus and minus signs
Free with trial A clear visual representation of decision-making. An orange 'plus' block stands for positive choices and growth, while two 'minus' blocks below represent subtractions or disadvantages. Decrease calculation vectors Simple Plus and Minus Button Illustration. A clear visual representation of decision-making. An orange 'plus' block stands for positive choices and growth, while two 'minus' blocks below represent subtractions or disadvantages
Free with trial Minus icon set in thin line outline style and linear vector sign. Decrease calculation vectors Minus icon Flat simple outline set. Minus icon set in thin line outline style and linear vector sign
Free with trial A bold white percentage symbol displayed centrally on a solid black background, representing discounts, statistics, or general numerical proportions. Decrease calculation illustrations White percentage symbol on black background. A bold white percentage symbol displayed centrally on a solid black background, representing discounts, statistics, or general numerical proportions
Free with trial A vibrant, glossy red 3D percentage symbol stands prominently on a clean white background, casting a subtle shadow. This eye-catching graphic is perfect for conveying concepts of discounts, sales, interest rates, financial growth, or statistical data. Its bold, modern design makes it ideal for marketing campaigns, business presentations, retail promotions, economic reports, or any project requiring a clear and impactful representation of percentages, savings, or performance metrics. Decrease calculation illustrations Red 3D Percentage Symbol on White Background. A vibrant, glossy red 3D percentage symbol stands prominently on a clean white background, casting a subtle shadow. This eye-catching graphic is perfect for conveying concepts of discounts, sales, interest rates, financial growth, or statistical data. Its bold, modern design makes it ideal for marketing campaigns, business presentations, retail promotions, economic reports, or any project requiring a clear and impactful representation of percentages, savings, or performance metrics.
Free with trial A high-quality 3D rendering of a dark gray calculator with a large, red percentage symbol resting on the plus button. The image is clean, modern, and perfect for illustrating concepts related to finance, discounts, interest rates, sales, and percentage calculations. The isolated white background makes it easy to incorporate into various designs. Decrease calculation vectors 3D Render of Calculator with Percentage Sign. A high-quality 3D rendering of a dark gray calculator with a large, red percentage symbol resting on the plus button. The image is clean, modern, and perfect for illustrating concepts related to finance, discounts, interest rates, sales, and percentage calculations. The isolated white background makes it easy to incorporate into various designs.
Free with trial Minus icon web design logo set collection in flat vector. Decrease calculation vectors Minus icon Outline vector for web ui. Minus icon web design logo set collection in flat vector
Free with trial Negative sign icon vector line logo mark or symbol set collection outline style. Decrease calculation vectors Negative sign icon Flat art illustration in outline. negative sign icon vector line logo mark or symbol set collection outline style
Free with trial A black minus sign symbol is centered within a black ring against a green backdrop, suggesting the concept of subtraction or negation for mathematical representations. Decrease calculation illustrations Minus Sign Symbol Black Ring Green Background. A black minus sign symbol is centered within a black ring against a green backdrop, suggesting the concept of subtraction or negation for mathematical representations
Free with trial A miniature white house model sits atop colorful building blocks spelling "TAX," symbolizing the concept of property taxation and home ownership expenses. The pastel-colored blocks and clean background create a clear, conceptual image ideal for illustrating financial topics. This visual represents the financial burden and responsibility associated with owning real estate, making it perfect for articles, blogs, and presentations on mortgages, real estate investment, annual taxes, and personal finance management. The soft lighting and minimalist composition offer ample copy space. Decrease calculation illustrations Property Tax Concept with Miniature House on \'TAX\' Blocks. A miniature white house model sits atop colorful building blocks spelling "TAX," symbolizing the concept of property taxation and home ownership expenses. The pastel-colored blocks and clean background create a clear, conceptual image ideal for illustrating financial topics. This visual represents the financial burden and responsibility associated with owning real estate, making it perfect for articles, blogs, and presentations on mortgages, real estate investment, annual taxes, and personal finance management. The soft lighting and minimalist composition offer ample copy space.
Free with trial Simple graphic design showing interconnected circles, one with a plus sign and the other with a minus sign. Useful for website design, apps, and presentations. Decrease calculation vectors Plus and Minus Circle Icons: Add and Subtract Symbols. Simple graphic design showing interconnected circles, one with a plus sign and the other with a minus sign. Useful for website design, apps, and presentations.
Free with trial Subtract symbol icon in a black circle, minus button. Decrease calculation vectors Subtract symbol icon in a black circle, minus button
Free with trial Economy crisis icon Vector symbol or sign set collection in black and white outline. Decrease calculation vectors Economy crisis flat line icon set. Economy crisis Thin line illustration vector. Economy crisis icon Vector symbol or sign set collection in black and white outline
Free with trial Two circular icons representing plus and minus signs, a basic mathematical concept. Decrease calculation vectors A simple illustration showing two black circles one with a plus and one. Two circular icons representing plus and minus signs, a basic mathematical concept.
Free with trial A hand is shown placing the final wooden block to complete a percentage symbol, symbolizing financial concepts and business decisions. Decrease calculation illustrations Hand placing wooden blocks to form a percentage symbol. A hand is shown placing the final wooden block to complete a percentage symbol, symbolizing financial concepts and business decisions
Free with trial Minus Sign within a Black Circle Shape Simple Subtraction Symbol. Decrease calculation vectors Minus Sign within a Black Circle Shape Simple Subtraction Symbol
Free with trial This image depicts a close-up of a hand using a pen to review detailed financial data, generated by AI. The image emphasizes precision and attention to detail in financial analysis. The cool blue tones enhance the professional and analytical nature of the task. Decrease calculation illustrations Analyzing Financial Data. This image depicts a close-up of a hand using a pen to review detailed financial data, generated by AI. The image emphasizes precision and attention to detail in financial analysis. The cool blue tones enhance the professional and analytical nature of the task.
Free with trial Bright blue arrow points downward, signifying a drop in value above shiny gold coins. Decrease calculation illustrations Money falling down towards golden coins in a minimalistic setting. Bright blue arrow points downward, signifying a drop in value above shiny gold coins
Free with trial A vibrant 3D rendering featuring a black minus and percentage sign combination, set against a playful, irregularly shaped pink background with a bright green border. The icon is prominently displayed on a dark, textured surface, creating a modern and eye-catching visual. This graphic effectively symbolizes discounts, sales, price reductions, and special offers, making it ideal for e-commerce promotions, marketing campaigns, financial presentations, or any content related to savings and deals. Decrease calculation illustrations Vibrant 3D Minus Percentage Icon for Discount and Sale Promotions. A vibrant 3D rendering featuring a black minus and percentage sign combination, set against a playful, irregularly shaped pink background with a bright green border. The icon is prominently displayed on a dark, textured surface, creating a modern and eye-catching visual. This graphic effectively symbolizes discounts, sales, price reductions, and special offers, making it ideal for e-commerce promotions, marketing campaigns, financial presentations, or any content related to savings and deals.
Free with trial This image depicts a vibrant blue calculator positioned next to a colorful bar graph and stack of gold coins, symbolizing financial success and growth. The scene is clean and bright, perfect for illustrating financial concepts. Decrease calculation illustrations Colorful Calculator, Bar Graph, and Coins Representing Financial Growth. This image depicts a vibrant blue calculator positioned next to a colorful bar graph and stack of gold coins, symbolizing financial success and growth. The scene is clean and bright, perfect for illustrating financial concepts.
Free with trial An abstract visualization blending climate change data with a winter landscape. The image conveys the convergence of data-driven insights and natural environment representation, showcasing patterns and trends of global warming. Generative AI. Decrease calculation illustrations Abstract Representation of Climate Data Convergence in Winter Landscape. An abstract visualization blending climate change data with a winter landscape. The image conveys the convergence of data-driven insights and natural environment representation, showcasing patterns and trends of global warming. Generative AI
Free with trial A 3D rendered figure interacts with a large red percent symbol against a neutral background. Generative AI. Decrease calculation illustrations A 3D rendered figure interacts with a large red percent symbol against a neutral background. Generative AI
Free with trial Lilac Round Shape with Minus Sign Design Element Simple Graphic Illustration. Decrease calculation vectors Lilac Round Shape with Minus Sign Design Element Simple Graphic Illustration
Free with trial Wooden house model sits beside three percentage blocks on a light wooden table against a dark background, illustrating financial concepts. Decrease calculation illustrations Wooden House Model and Percentage Blocks Representing Real Estate Interest. Wooden house model sits beside three percentage blocks on a light wooden table against a dark background, illustrating financial concepts
Free with trial Seventy-one percent is displayed in textured gold against a peach backdrop offering a visual for financial promotions or sales statistics. Decrease calculation illustrations Golden Seventy-one Percent on Peach Background Displaying Discount or Rate. Seventy-one percent is displayed in textured gold against a peach backdrop offering a visual for financial promotions or sales statistics
Free with trial Shiny blue percentage sign sits atop document suggesting discounts or interest rates This image conveys financial concepts for marketing and presentations. Decrease calculation illustrations Percentage Sign on Document Business Finance Discount Concept. Shiny blue percentage sign sits atop document suggesting discounts or interest rates This image conveys financial concepts for marketing and presentations
Free with trial 3D rendering of a cute cartoon house model, a calculator, and stacks of coins, illustrating the concept of home buying expenses and financial planning. A great image for articles, websites, or presentations related to real estate, mortgages, and financial planning. Decrease calculation illustrations Cartoon House Model with Calculator and Coins: Home Purchase Cost Calculation. 3D rendering of a cute cartoon house model, a calculator, and stacks of coins, illustrating the concept of home buying expenses and financial planning. A great image for articles, websites, or presentations related to real estate, mortgages, and financial planning.
Free with trial This 3D render shows a calculator with a colorful bar chart made of cubes illustrating growth and success in business and finance. Perfect for presentations and infographics. Decrease calculation illustrations Colorful 3D Calculator with Growing Bar Chart Cubes for Business and Finance. This 3D render shows a calculator with a colorful bar chart made of cubes illustrating growth and success in business and finance. Perfect for presentations and infographics.
Free with trial A simple graphic design element featuring a rounded rectangle shape with a horizontal line across the center. Perfect for web design, app icons, or user interface elements. Decrease calculation vectors Rounded Rectangle Shape with Horizontal Line, Simple Geometric Design Element. A simple graphic design element featuring a rounded rectangle shape with a horizontal line across the center. Perfect for web design, app icons, or user interface elements.
Free with trial Graph going Up and Down sign with green and red arrows vector set. Flat design vector set of a concept of sales bar chart symbol icon with arrow moving down and sales bar chart with arrow moving up. Decrease calculation vectors Graph going Up and Down sign with green and red arrows vector set. Vector set of a concept of sales bar chart symbol icon. Graph going Up and Down sign with green and red arrows vector set. Flat design vector set of a concept of sales bar chart symbol icon with arrow moving down and sales bar chart with arrow moving up.
Free with trial Percentage symbol icon in circle shape abstract concept for discount or finance. Decrease calculation vectors Percentage symbol icon in circle shape abstract concept for discount or finance
Free with trial A 10% portion, often represented as a decimal, fraction, or percentage, is a fundamental concept in various fields. Whether calculating savings, understanding ratios, or simply dividing something into tenths, this fraction holds significant importance. This visual representation explores the practical application of a 10% reduction or increase, showing its impact on various quantities. From. Decrease calculation illustrations Understanding the Impact of a 10 Portion Savings Ratios and Fractions Explained. A 10% portion, often represented as a decimal, fraction, or percentage, is a fundamental concept in various fields. Whether calculating savings, understanding ratios, or simply dividing something into tenths, this fraction holds significant importance. This visual representation explores the practical application of a 10% reduction or increase, showing its impact on various quantities. From
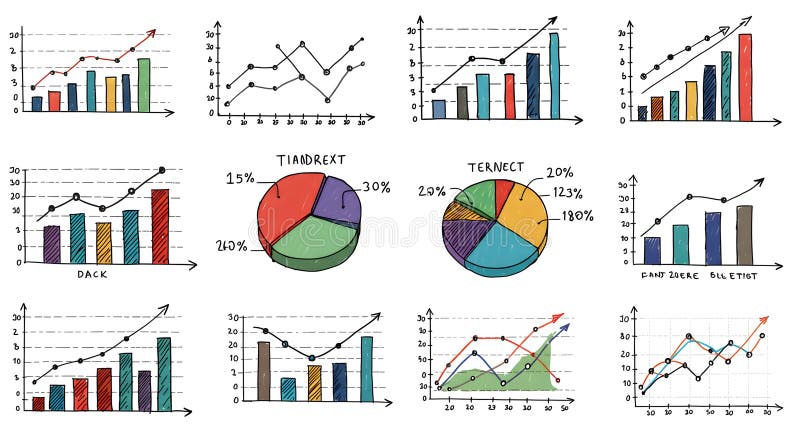
Free with trial A collection of hand-drawn style charts and diagrams that can be used to display data and analyze progress, ideal for business presentations, reports, or data visualizations. Decrease calculation illustrations Hand-Drawn Collection of Statistical Charts and Diagrams for Business Analytics. A collection of hand-drawn style charts and diagrams that can be used to display data and analyze progress, ideal for business presentations, reports, or data visualizations
Free with trial A collection of minimalist outline icons depicting economic recession, financial crisis, and downturn related concepts. Perfect for illustrating articles, presentations, or websites focused on economic issues and market trends. Decrease calculation vectors Minimalist Outline Economic Recession And Financial Crisis Icon Set Illustration. A collection of minimalist outline icons depicting economic recession, financial crisis, and downturn related concepts. Perfect for illustrating articles, presentations, or websites focused on economic issues and market trends.
Free with trial An image with a signpost pointing in two different directions in German. One direction points to plus, the other points to minus. Decrease calculation illustrations Signposts the direct way to plus versus minus. An image with a signpost pointing in two different directions in German. One direction points to plus, the other points to minus
Free with trial An image with a signpost pointing in two different directions in German. One direction points to plus, the other points to minus. Decrease calculation illustrations Signposts the direct way to plus versus minus. An image with a signpost pointing in two different directions in German. One direction points to plus, the other points to minus
Free with trial A 3D rendered gray percentage symbol is presented against a clean white background. The symbol is composed of two circles and a diagonal line, with subtle shading that gives it a three-dimensional appearance. The lighting highlights the smooth surfaces of the symbol. Decrease calculation illustrations 3D Rendered Gray Percentage Symbol on White Background sign discount. A 3D rendered gray percentage symbol is presented against a clean white background. The symbol is composed of two circles and a diagonal line, with subtle shading that gives it a three-dimensional appearance. The lighting highlights the smooth surfaces of the symbol
Free with trial Modern line icon of a percentage symbol inside a circular gauge for financial concepts. Decrease calculation vectors Modern line icon of a percentage symbol inside a circular gauge for financial concepts
Free with trial Minus Sign Symbol Hand Drawn Illustration Black and White Circle Outline Subtraction. Decrease calculation vectors Minus Sign Symbol Hand Drawn Illustration Black and White Circle Outline Subtraction
Free with trial Close-Up of Wooden Number Blocks with Mathematical Symbols for Decision Making Concept. , Generated by AI. Decrease calculation illustrations Close-Up of Wooden Number Blocks with Mathematical Symbols for Decision Making Concept.
Free with trial Minus icon vector. Black subtraction symbol. White circle background. Green backdrop shadow. EPS 10. Decrease calculation vectors Minus icon vector. Black subtraction symbol. White circle background. Green backdrop shadow.
Free with trial Illustrated Percentage Sign with Radial Lines for Sales, Discounts, and Financial Concepts. Decrease calculation vectors Illustrated Percentage Sign with Radial Lines for Sales, Discounts, and Financial Concepts
Free with trial An elegant and minimalist graphic featuring a stylized percentage symbol, intricately designed with flowing lines and decorative waves, set against a plain white backdrop. Decrease calculation vectors A decorative flourish with a percentage symbol in the center, isolated on transparent background. An elegant and minimalist graphic featuring a stylized percentage symbol, intricately designed with flowing lines and decorative waves, set against a plain white backdrop
Free with trial Bar graph with circles and lines darker flat icons on color round background. Decrease calculation vectors Bar graph with circles and lines color darker flat icons. Bar graph with circles and lines darker flat icons on color round background
Free with trial Candlestick chart graph for stock market, financial investment, forex trading and business report concept. Vector illustration. Decrease calculation vectors Candlestick chart graph for stock market, financial investment
Free with trial Money bags with tax text and an american flag representing financial contributions impacting the usa macroeconomy. Decrease calculation illustrations Us tax bags impacting government finance and economy. Money bags with tax text and an american flag representing financial contributions impacting the usa. Money bags with tax text and an american flag representing financial contributions impacting the usa macroeconomy
Free with trial Monochrome vector graphic of a less than sign. This could be used in the teaching of maths at primary or secondary level. Decrease calculation vectors Monochrome vector graphic of a less than sign. This could be used in the teaching of maths at primary or secondary level
Free with trial Digital financial chart displays rising falling stock market data. Dynamic investment data visualization shows fluctuating market trends. Abstract financial interface with glowing. Decrease calculation illustrations Digital financial chart displays rising, falling stock market data. Dynamic investment data visualization shows fluctuating. Digital financial chart displays rising falling stock market data. Dynamic investment data visualization shows fluctuating market trends. Abstract financial interface with glowing.
Free with trial A digital hand displays an illuminated financial growth graph with various statistics against a dark city backdrop, emphasizing technology in data analysis and investment trends. Scalp. Decrease calculation illustrations Digital hand presenting glowing financial growth graph with statistics and global connectivity showcasing data analytics. A digital hand displays an illuminated financial growth graph with various statistics against a dark city backdrop, emphasizing technology in data analysis and investment trends. Scalp
Free with trial A financial report with bar graph and line chart is a visual tool for business data analysis, offering insights for presentation, review, and strategic decision-making. Decrease calculation vectors Vector art of financial report with bar graph and line chart, showing business data and analysis for presentation and review. A financial report with bar graph and line chart is a visual tool for business data analysis, offering insights for presentation, review, and strategic decision-making
Free with trial Bold black plus sign, minus symbol appear on plain white background. Essential math icons represent core concepts like positive, negative, addition, subtraction. Serve as graphic. Decrease calculation illustrations Bold black plus sign, minus symbol appear on plain white background. Essential math icons represent core concepts like positive
Free with trial This bar graph visually represents a declining trend, effectively conveying data reduction and downward progression for analytical purposes and interpretation. Decrease calculation vectors Vector art of declining bar graph showing a downward trend in data representation and visualization for statistical analysis. This bar graph visually represents a declining trend, effectively conveying data reduction and downward progression for analytical purposes and interpretation
Free with trial This image features the "3%" symbol, representing a small percentage. It can denote a discount, interest rate, or statistical value in finance and mathematics. Decrease calculation vectors Vector art of three percent symbol representing a small percentage, discount, interest rate, or statistical value in finance and. This image features the "3%" symbol, representing a small percentage. It can denote a discount, interest rate, or statistical value in finance and mathematics
Free with trial Stock market trading graph in red color as economy 3D illustration background, Generative AI. Decrease calculation illustrations Stock market trading graph in red color as economy 3D illustration background, Generative AI
Free with trial Stock market trading graph in red color as economy 3D illustration background, Generative AI. Decrease calculation illustrations Stock market trading graph in red color as economy 3D illustration background, Generative AI
Free with trial Stock market trading graph in red color as economy 3D illustration background, Generative AI. Decrease calculation illustrations Stock market trading graph in red color as economy 3D illustration background, Generative AI
Free with trial Stock market trading graph in red color as economy 3D illustration background, Generative AI. Decrease calculation illustrations Stock market trading graph in red color as economy 3D illustration background, Generative AI
Free with trial Generated with the use of AI. Stock market trading graph in red color as economy 3D illustration background. Trading trends and economic development. Generative AI. Decrease calculation illustrations Stock market trading graph in red color as economy 3D illustration background. Trading trends and economic development. Generative
Free with trial Generated with the use of AI. Stock market trading graph in red color as economy 3D illustration background. Trading trends and economic development. Generative AI. Decrease calculation illustrations Stock market trading graph in red color as economy 3D illustration background. Trading trends and economic development. Generative
Free with trial Generated with the use of AI. Stock market trading graph in red color as economy 3D illustration background. Trading trends and economic development. Generative AI. Decrease calculation illustrations Stock market trading graph in red color as economy 3D illustration background. Trading trends and economic development. Generative
Free with trial Generated with the use of AI. Stock market trading graph in red color as economy 3D illustration background. Trading trends and economic development. Generative AI. Decrease calculation illustrations Stock market trading graph in red color as economy 3D illustration background. Trading trends and economic development. Generative
Free with trial Calculation of business decrease or negative results illustration. Decrease calculation illustrations Calculation of business decrease or negative results
Free with trial Set Calculation of expenses Dollar rate decrease Burning dollar bill Global economic crisis news Shutdown factory Stop delivery cargo truck and Mobile stock trading icon. Vector. Decrease calculation vectors Set Calculation of expenses, Dollar rate decrease, Burning dollar bill, Global economic crisis news, Shutdown factory. Set Calculation of expenses Dollar rate decrease Burning dollar bill Global economic crisis news Shutdown factory Stop delivery cargo truck and Mobile stock trading icon. Vector.
Free with trial Set Pie chart infographic, Calculation of expenses, Dollar rate decrease and Mobile stock trading icon. Vector. Decrease calculation illustrations Set Pie chart infographic, Calculation of expenses, Dollar rate decrease and Mobile stock trading icon. Vector
Free with trial Set Money bag, Gold bars, Dollar rate decrease and Calculation of expenses icon. Vector. Decrease calculation vectors Set Money bag, Gold bars, Dollar rate decrease and Calculation of expenses icon. Vector
Free with trial Set line Dollar rate decrease Calculation of expenses and Pie chart infographic icon. Vector. Decrease calculation vectors Set line Dollar rate decrease, Calculation of expenses and Pie chart infographic icon. Vector
Free with trial Set Dollar rate decrease Calculation of expenses Money bomb dollar crisis Pie chart infographic Safe Hanging sign with Sale and Briefcase icon. Vector. Decrease calculation illustrations Set Dollar rate decrease, Calculation of expenses, Money bomb dollar crisis, Pie chart infographic, Safe, Hanging sign. Set Dollar rate decrease Calculation of expenses Money bomb dollar crisis Pie chart infographic Safe Hanging sign with Sale and Briefcase icon. Vector.
Free with trial Set line Dollar rate decrease, Calculation of expenses, and Prison cell door icon. Vector. Decrease calculation vectors Set line Dollar rate decrease, Calculation of expenses, and Prison cell door icon. Vector
Free with trial Set Isometric line Calculation of expenses, Tearing money banknote, Dollar rate decrease and icon. Vector. Decrease calculation vectors Set Isometric line Calculation of expenses, Tearing money banknote, Dollar rate decrease and icon. Vector
Free with trial Set line Contract money and pen Calculation of expenses Dollar rate decrease Money bomb dollar crisis Drop in crude oil price Global economic Tearing banknote and bag icon. Vector. Decrease calculation vectors Set line Contract money and pen, Calculation of expenses, Dollar rate decrease, Money bomb dollar crisis, Drop in crude. Set line Contract money and pen Calculation of expenses Dollar rate decrease Money bomb dollar crisis Drop in crude oil price Global economic Tearing banknote and bag icon. Vector.