Free with trial Graph and diagram from planes with decrease. Finance and business concept. 3D Illustration. 3D rendering on blue background. Decrease chart icon illustration illustrations Graph and diagram from planes with decrease. Finance and business concept. 3D Illustration.3D rendering
Free with trial Sustainability, environmental responsibility, green initiatives, carbon reduction, climate action, collaboration. Handshake, carbon footprint icon thermometer falling chart. Sustainability. Decrease chart icon illustration vectors Handshake Eco-Friendly Partnership with Carbon Footprint Reduction and Climate Action Concept. Sustainability, environmental responsibility, green initiatives, carbon reduction, climate action, collaboration. Handshake, carbon footprint icon thermometer falling chart. Sustainability
Free with trial Golden dollar sign with circular chart showing financial growth and decline on black background. Vector graphic design. Decrease chart icon illustration vectors Golden dollar sign with circular chart showing financial growth and decline on black background
Free with trial Graph and diagram from planes with decrease. Finance and business concepts. 3D Illustration isolated. 3D rendering on blue background. Decrease chart icon illustration illustrations Graph and diagram from planes with decrease. Finance and business concepts. 3D Illustration isolated.
Free with trial Botswana oil industry concept, industrial illustration - lowering down chart on Botswana flag background. 3D Illustration. Decrease chart icon illustration illustrations Lowering down chart on Botswana flag background - industrial illustration of Botswana oil industry or market concept. 3D. Botswana oil industry concept, industrial illustration - lowering down chart on Botswana flag background. 3D Illustration
Free with trial Barbados oil industry concept, industrial illustration - lowering down chart on Barbados flag background. 3D Illustration. Decrease chart icon illustration illustrations Lowering down chart on Barbados flag background - industrial illustration of Barbados oil industry or market concept. 3D. Barbados oil industry concept, industrial illustration - lowering down chart on Barbados flag background. 3D Illustration
Free with trial Golden dollar coins stack and down arrow. Flat vector icon isolated on white. Economy, finance, money symbol. Currency pictogram. Vector illustration. decrease. Decrease chart icon illustration vectors Golden dollar coins stack and down arrow. Flat vector icon isolated on white. Economy, finance, money symbol. Currency pictogram.
Free with trial Golden dollar coins stack and down arrow. Flat vector icon isolated on white. Economy, finance, money symbol. Currency pictogram. Vector illustration. decrease. Decrease chart icon illustration vectors Golden dollar coins stack and down arrow. Flat vector icon isolated on white. Economy, finance, money symbol. Currency pictogram.
Free with trial Golden dollar coins stack and down arrow. Flat vector icon isolated on white. Economy, finance, money symbol. Currency pictogram. Vector illustration. decrease. Decrease chart icon illustration vectors Golden dollar coins stack and down arrow. Flat vector icon isolated on white. Economy, finance, money symbol. Currency pictogram.
Free with trial Golden dollar coins stack and down arrow. Flat vector icon isolated on white. Economy, finance, money symbol. Currency pictogram. Vector illustration. decrease. Decrease chart icon illustration vectors Golden dollar coins stack and down arrow. Flat vector icon isolated on white. Economy, finance, money symbol. Currency pictogram.
Free with trial Two drop and growth technology icon with gear. outline simple trend stats logotype graphic stroke art web design isolated on white. concept of key performance indicator or operation strategy symbol. Decrease chart icon illustration vectors Two drop and growth technology icon with gear
Free with trial Red 3D arrow pointing downward for crisis, business decline, sales decrease, or financial loss concept design. Vector illustration. Decrease chart icon illustration vectors Red 3D arrow pointing downward for crisis
Free with trial Decline graph line outline icon isolated on white. Vector illustration. Decrease chart icon illustration vectors Decline graph line outline icon
Free with trial 3D Isometric Flat Vector Illustration of Increase Interest Rates, Percent Up. Decrease chart icon illustration vectors 3D Isometric Flat Vector Illustration of Increase Interest Rates
Free with trial 3D Isometric Flat Vector Illustration of Website Traffic Decline, Reflecting Poor Engagement And Web Performance. Decrease chart icon illustration vectors 3D Isometric Flat Vector Illustration of Website Traffic Decline
Free with trial Price Drop Icon. A flat illustration featuring a gold dollar coin with three red arrows pointing down. Decrease chart icon illustration vectors Price Drop Icon
Free with trial 3D bear market trading chart with Bitcoin coin symbol representing crypto bearish trend. Decrease chart icon illustration illustrations 3D Bear Market icon. 3D bear market trading chart with Bitcoin coin symbol representing crypto bearish trend.
Free with trial Conceptual graph with decrease report. Dark diagram with recession and bankruptcy progress. Business and finance vector illustration. Decrease chart icon illustration vectors Conceptual graph with decrease report. Dark diagram with recession and bankruptcy progress. Business and finance vector
Free with trial Financial Graph Decline icon vector image. Suitable for mobile application web application and print media. Decrease chart icon illustration vectors Financial Graph Decline icon vector image.
Free with trial A simple illustration of a bar chart with a downward arrow showing decline, loss, negative growth, or decreasing business and financial performance. Decrease chart icon illustration vectors Downward Trend Analytics Icon. A simple illustration of a bar chart with a downward arrow showing decline, loss, negative growth, or decreasing business and financial performance
Free with trial Downward graph line with sad face, email icon, and user profile symbol. Ideal for analytics, failure, feedback, notification, business trends, communication and simple flat metaphor. Decrease chart icon illustration vectors Declining Chart with Sad Face, Email Notification, and User Profile Icons. Downward graph line with sad face, email icon, and user profile symbol. Ideal for analytics, failure, feedback, notification, business trends, communication and simple flat metaphor
Free with trial Comparing Bar Chart Data Analysis Icons vol 30444. Decrease chart icon illustration vectors Comparing Bar Chart Data Analysis Icons
Free with trial Downward trending line graph with sad face emotion, classic phone icon, and computer monitor. Ideal for business loss, analytics, communication issues, technology, finance, statistics simple flat. Decrease chart icon illustration vectors Declining Sales Graph with Sad Face, Phone Icon, and Monitor Display. Downward trending line graph with sad face emotion, classic phone icon, and computer monitor. Ideal for business loss, analytics, communication issues, technology, finance, statistics simple flat
Free with trial Sad face beside sales trend line graph indicating decrease. Empty basket symbolizes low retail activity. Ideal for business decline, loss, market crisis, consumer struggle, analytics, recession. Decrease chart icon illustration illustrations Declining Sales Chart with Sad Face and Empty Shopping Basket. Sad face beside sales trend line graph indicating decrease. Empty basket symbolizes low retail activity. Ideal for business decline, loss, market crisis, consumer struggle, analytics, recession
Free with trial Bar graph with varying heights beside a line chart with rising and falling pattern on a grid. Ideal for business analysis, statistics, metrics, trends, presentation, infographics, simple flat. Decrease chart icon illustration illustrations Data Visualization with Bar Graph and Line Chart in Minimalist Design. Bar graph with varying heights beside a line chart with rising and falling pattern on a grid. Ideal for business analysis, statistics, metrics, trends, presentation, infographics, simple flat
Free with trial A clean and modern vector illustration featuring graphic symbols for business growth and decline. This EPS file shows an upward-trending green arrow for success and a downward-trending red arrow for loss, both depicted on a stylized financial chart. Ideal for corporate presentations, financial reports, economic analysis, and stock market metaphors. Decrease chart icon illustration vectors Growth And Decline Chart Graphic Symbol. A clean and modern vector illustration featuring graphic symbols for business growth and decline. This EPS file shows an upward-trending green arrow for success and a downward-trending red arrow for loss, both depicted on a stylized financial chart. Ideal for corporate presentations, financial reports, economic analysis, and stock market metaphors.
Free with trial Percentage symbol inside a circular arrow illustrating financial performance, interest rates, tax calculations, market fluctuations, or economic cycles in a modern sketch style illustration. Decrease chart icon illustration illustrations Percentage symbol revolving looping business icon. Percentage symbol inside a circular arrow illustrating financial performance, interest rates, tax calculations, market fluctuations, or economic cycles in a modern sketch style illustration
Free with trial Low price vector 3d icon. Arrow with percent and flying coins. Cartoon discount offer illustration. Decrease chart icon illustration vectors Low price vector 3d icon
Free with trial Business graphic vector set. Chart line, round and candlestick graph trend glassmorphism effect. Transparent glass blur button on gradient arrows. Financial diagram statistics with percentage sign. Decrease chart icon illustration vectors Business graphic vector set, chart line, round and candlestick graph glassmorphism effect, glass blur button on arrow. Business graphic vector set. Chart line, round and candlestick graph trend glassmorphism effect. Transparent glass blur button on gradient arrows. Financial diagram statistics with percentage sign
Free with trial Minimalistic human head profile alongside descending bar chart, showcasing analysis, statistics, and progress trends. Ideal for business, evaluation, decision-making, trends, growth performance. Decrease chart icon illustration illustrations Human Profile Beside Downward Bar Chart Representing Analytics and Performance Trends. Minimalistic human head profile alongside descending bar chart, showcasing analysis, statistics, and progress trends. Ideal for business, evaluation, decision-making, trends, growth performance
Free with trial Decreasing Bar Chart Icons for Business Analytics vol 34819. Decrease chart icon illustration vectors Decreasing Bar Chart Icons for Business Analytics
Free with trial Financial analysis, performance monitoring, economic crisis, stock market trends, investment risk, data alerts. Sad face and bell symbol near a declining graph. Financial analysis and performance. Decrease chart icon illustration illustrations Financial Decline and Alert Notification with a Chart and Sad Face Icon. Financial analysis, performance monitoring, economic crisis, stock market trends, investment risk, data alerts. Sad face and bell symbol near a declining graph. Financial analysis and performance
Free with trial A flat illustration of business graphs and charts showing analysis results. Featuring clean design and vibrant color scheme. Decrease chart icon illustration vectors Colorful business graph and chart flat style design. A flat illustration of business graphs and charts showing analysis results. Featuring clean design and vibrant color scheme.
Free with trial Downward arrow, message bubble with dots, and chart with decreasing points. Ideal for data analysis, trends, communication, decline, business, marketing simple flat metaphor. Decrease chart icon illustration illustrations Declining Trend Indicated by Arrow with Chart and Communication Bubble. Downward arrow, message bubble with dots, and chart with decreasing points. Ideal for data analysis, trends, communication, decline, business, marketing simple flat metaphor
Free with trial A flat design bar chart displays a downward trend, highlighted by a red arrow. Minimalist graphic, illustrative style. Decrease chart icon illustration vectors Flat bar chart showing downward trend with red arrow. A flat design bar chart displays a downward trend, highlighted by a red arrow. Minimalist graphic, illustrative style.
Free with trial A flat design vector illustration showing a graph with rising and falling bars, marked by green and red arrows indicating increase and decrease. Ideal for financial concepts. Decrease chart icon illustration vectors Bar chart showing positive and negative data trends. A flat design vector illustration showing a graph with rising and falling bars, marked by green and red arrows indicating increase and decrease. Ideal for financial concepts
Free with trial Illustration of a descending bar graph with an arrow signifying decline. Percentage symbol indicates decrease. Minimalist flat style, on black background. Decrease chart icon illustration vectors Declining bar graph with percentage drop indicator icon. Illustration of a descending bar graph with an arrow signifying decline. Percentage symbol indicates decrease. Minimalist flat style, on black background.
Free with trial Two opposing arrows, a clock, and a growth chart with an upward trend. Ideal for business, productivity, time management, performance, progress efficiency and decision-making. A simple flat. Decrease chart icon illustration illustrations Upward and Downward Arrows with Clock and Growth Chart Representing Time and Progress. Two opposing arrows, a clock, and a growth chart with an upward trend. Ideal for business, productivity, time management, performance, progress efficiency and decision-making. A simple flat
Free with trial Web report line icon. Halftone dotted pattern. Gradient icon with grain shadow. Column graph sign. Growth diagram symbol. Line web report icon. Various designs. Vector. Decrease chart icon illustration illustrations Web report line icon. Column graph sign. Halftone dotted pattern. Vector. Web report line icon. Halftone dotted pattern. Gradient icon with grain shadow. Column graph sign. Growth diagram symbol. Line web report icon. Various designs. Vector
Free with trial Business analysis, performance tracking, resource management, environmental monitoring, sustainability, decline. Declining arrow with graph and water droplet. Business analysis and environmental. Decrease chart icon illustration vectors Data Analysis Concept with Decline Arrow, Chart, and Blue Water Droplet Icon. Business analysis, performance tracking, resource management, environmental monitoring, sustainability, decline. Declining arrow with graph and water droplet. Business analysis and environmental
Free with trial Isometric banner template showing inflation concept. Vector illustration of financial crisis, rising prices, and money value decrease. Data analysis report with charts and upward arrow for web design. Decrease chart icon illustration vectors Inflation And Economic Crisis Data Analysis Isometric Banner Template Vector Illustration. Isometric banner template showing inflation concept. Vector illustration of financial crisis, rising prices, and money value decrease. Data analysis report with charts and upward arrow for web design
Free with trial A striking 3D isometric illustration featuring a blue house icon positioned above a downward-trending red arrow and a blue base, all set against a clean white background. This graphic powerfully symbolizes a falling housing market, real estate crisis, property value depreciation, economic recession, or financial downturn. It's an ideal visual for conveying concepts of market instability, investment risks, and challenges within the housing industry, suitable for financial reports, news articles, and business presentations. Decrease chart icon illustration vectors Housing Market Decline with Downward Arrow Icon. A striking 3D isometric illustration featuring a blue house icon positioned above a downward-trending red arrow and a blue base, all set against a clean white background. This graphic powerfully symbolizes a falling housing market, real estate crisis, property value depreciation, economic recession, or financial downturn. It's an ideal visual for conveying concepts of market instability, investment risks, and challenges within the housing industry, suitable for financial reports, news articles, and business presentations.
Free with trial Downward arrow, bar chart in browser window, abstract leaf shape. Ideal for business, analytics, environment, economy, growth planning strategy concepts. Simple flat metaphor. Decrease chart icon illustration vectors Data Chart with Downward Arrow and Leaf Element for Trend Analysis and Growth Concept. Downward arrow, bar chart in browser window, abstract leaf shape. Ideal for business, analytics, environment, economy, growth planning strategy concepts. Simple flat metaphor
Free with trial Stacked Euro Coins Decline Icon Set: Financial Market Down vol 34476. Decrease chart icon illustration vectors Stacked Euro Coins Decline Icon Set: Financial Market Down
Free with trial Medicine bottle surrounded by upward and downward arrows with bar chart illustrating statistics and growth. Ideal for health, medicine, pharmaceutical industry, research, statistics, marketing, data. Decrease chart icon illustration vectors Medicine Bottle with Rising Arrow and Bar Chart Representing Growth and Decline Trends. Medicine bottle surrounded by upward and downward arrows with bar chart illustrating statistics and growth. Ideal for health, medicine, pharmaceutical industry, research, statistics, marketing, data
Free with trial Downward trend line on grid chart with sad face and progress icon signaling mediocre results or declining metrics. Ideal for failure, analytics, market loss, strategy, performance, results, simple. Decrease chart icon illustration illustrations Declining Trend on Graph with Sad Face Symbolizing Negative Results or Performance. Downward trend line on grid chart with sad face and progress icon signaling mediocre results or declining metrics. Ideal for failure, analytics, market loss, strategy, performance, results, simple
Free with trial Colorful pie chart is showing positive statistics and business growth, target and financial analysis and marketing report, data with copy space. Decrease chart icon illustration vectors Colorful pie chart is showing positive statistics and business growth, target and financial analysis and marketing
Free with trial Presentation board line icon. Halftone dotted pattern. Gradient icon with grain shadow. Column graph sign. Growth diagram symbol. Line presentation board icon. Various designs. Vector. Decrease chart icon illustration vectors Presentation board line icon. Column graph sign. Halftone dotted pattern. Vector. Presentation board line icon. Halftone dotted pattern. Gradient icon with grain shadow. Column graph sign. Growth diagram symbol. Line presentation board icon. Various designs. Vector
Free with trial Sad face next to bug and downward bar chart symbolizing technical failures, system errors, or negative trends. Ideal for technology, software development, cybersecurity, troubleshooting, performance. Decrease chart icon illustration vectors Sad face with bug and declining chart representing software issues or performance failures. Sad face next to bug and downward bar chart symbolizing technical failures, system errors, or negative trends. Ideal for technology, software development, cybersecurity, troubleshooting, performance
Free with trial A clean and simple illustration featuring a variety of common crochet stitch symbols. The chart includes symbols for chain, slip stitch, single crochet, double crochet, and more. This visual guide is perfect for crochet patterns, instructional materials, and educational resources for both beginners and experienced crocheters. The minimalist design ensures clarity and easy understanding. Decrease chart icon illustration illustrations Crochet Stitch Symbols Chart. A clean and simple illustration featuring a variety of common crochet stitch symbols. The chart includes symbols for chain, slip stitch, single crochet, double crochet, and more. This visual guide is perfect for crochet patterns, instructional materials, and educational resources for both beginners and experienced crocheters. The minimalist design ensures clarity and easy understanding.
Free with trial Bar chart with descending bars, coin falling, minimal cloud above. Ideal for finance, economy, loss, risk, business investments or savings themes. Simple flat metaphor. Decrease chart icon illustration vectors Decreasing Bar Chart with Dropping Coin Symbolizing Financial Decline and Economic Challenges. Bar chart with descending bars, coin falling, minimal cloud above. Ideal for finance, economy, loss, risk, business investments or savings themes. Simple flat metaphor
Free with trial Sad face emoticon beside password entry field and decreasing bar chart. Ideal for cybersecurity, data loss, decline, failure, frustration, protection issues, simple flat metaphor. Decrease chart icon illustration vectors Sad face with password entry and declining bar chart conveying data security or performance issues. Sad face emoticon beside password entry field and decreasing bar chart. Ideal for cybersecurity, data loss, decline, failure, frustration, protection issues, simple flat metaphor
Free with trial A clear, black and white vector illustration of a lace knitting chart with a corresponding legend. The grid pattern contains various symbols representing different knitting stitches, such as knit, yarn over, and decreases. The legend on the right provides a key to decipher the symbols, making it a complete instructional guide. This graphic is perfect for craft blogs, knitting pattern books, DIY tutorials, hobby magazines, and any content related to needlework, textiles, and handmade crafts. The clean design is easy to read and understand. Decrease chart icon illustration illustrations Lace Knitting Chart and Stitch Legend. A clear, black and white vector illustration of a lace knitting chart with a corresponding legend. The grid pattern contains various symbols representing different knitting stitches, such as knit, yarn over, and decreases. The legend on the right provides a key to decipher the symbols, making it a complete instructional guide. This graphic is perfect for craft blogs, knitting pattern books, DIY tutorials, hobby magazines, and any content related to needlework, textiles, and handmade crafts. The clean design is easy to read and understand.
Free with trial Black glyph icon representing a broken downward arrow, symbolizing decline, financial crisis, market downturn, failure, or negative trends. Ideal for business presentations, economic reports, data visualization, infographics, and conceptual designs indicating loss, recession, or problems. Simple, clean graphic illustration on a white background. Generated by AI. Decrease chart icon illustration vectors Declining Trend Broken Downward Arrow Icon. Black glyph icon representing a broken downward arrow, symbolizing decline, financial crisis, market downturn, failure, or negative trends. Ideal for business presentations, economic reports, data visualization, infographics, and conceptual designs indicating loss, recession, or problems. Simple, clean graphic illustration on a white background. Generated by AI
Free with trial A detailed black and white illustration of a knitting pattern stitch chart. This graphical guide features a grid with various symbols, icons, and abbreviations like 'k2tog' and 'ssk', representing different knitting stitches and techniques. The chart is organized by rows and columns, providing a visual map for creating intricate designs, particularly in lace knitting. This image is ideal for crafting websites, DIY tutorials, knitting books, hobby blogs, and instructional materials related to needlework, textiles, and handmade crafts. Decrease chart icon illustration illustrations Knitting Pattern Stitch Chart
Free with trial Set line Financial growth decrease, Data analysis, and Server on black and white. Vector. Decrease chart icon illustration illustrations Set line Financial growth decrease, Data analysis, and Server on black and white. Vector
Free with trial Blue curved arrow pointing down and right vector illustration. Business growth, financial decline, process flow, navigation path, strategic movement, data visualization. Wavy directional pointer. Decrease chart icon illustration vectors Blue curved arrow pointing down and right for business growth and process flow vector illustration. Blue curved arrow pointing down and right vector illustration. Blue curved arrow pointing down and right vector illustration. Business growth, financial decline, process flow, navigation path, strategic movement, data visualization. Wavy directional pointer
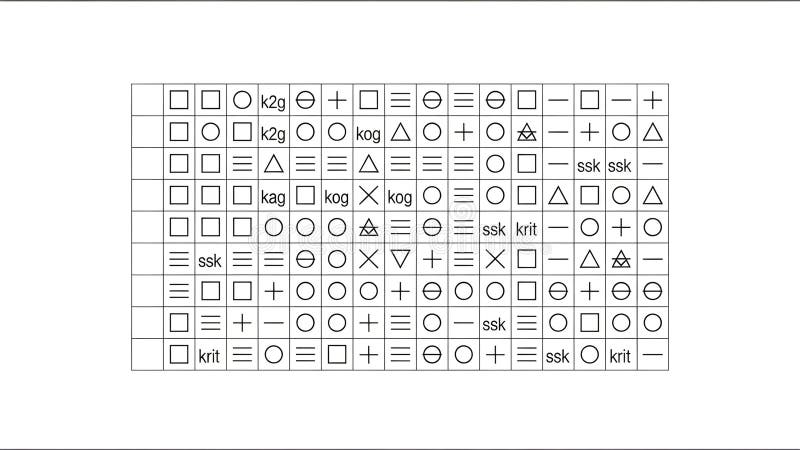
Free with trial A detailed black and white illustration of a complex knitting pattern chart on a clean white background. The grid is filled with various symbols, including geometric shapes like circles, squares, and triangles, alongside standard knitting abbreviations such as 'k2g', 'ssk', and 'kog'. This graphic represents a stitch legend or a visual guide for creating intricate lace or colorwork designs. It's perfect for craft-related websites, publications, tutorials, and projects that require a visual representation of handmade instructions, patterns, or complex codes. Decrease chart icon illustration illustrations Knitting Pattern Chart with Symbols and Abbreviations. A detailed black and white illustration of a complex knitting pattern chart on a clean white background. The grid is filled with various symbols, including geometric shapes like circles, squares, and triangles, alongside standard knitting abbreviations such as 'k2g', 'ssk', and 'kog'. This graphic represents a stitch legend or a visual guide for creating intricate lace or colorwork designs. It's perfect for craft-related websites, publications, tutorials, and projects that require a visual representation of handmade instructions, patterns, or complex codes.
Free with trial Falling bar chart with downward arrow representing business decline and financial problems. Ideal for risk, loss, and economic downturn concepts. Decrease chart icon illustration vectors Business decline chart downward trend problem failure vector silhouette illustration design. Falling bar chart with downward arrow representing business decline and financial problems. Ideal for risk, loss, and economic downturn concepts
Free with trial Set line Data analysis, Financial growth decrease, and Search data. Business infographic template. Vector. Decrease chart icon illustration illustrations Set line Data analysis, Financial growth decrease, and Search data. Business infographic template. Vector
Free with trial Blue Global economic crisis icon isolated on blue background. World finance crisis. Minimalism concept. 3D render illustration. Decrease chart icon illustration illustrations Blue Global economic crisis icon isolated on blue background. World finance crisis. Minimalism concept. 3D render
Free with trial 3D Isometric Flat Vector Illustration of Real Estate Investment Risks, Fluctuations In Housing Prices. Decrease chart icon illustration vectors 3D Isometric Flat Vector Illustration of Real Estate Investment Risks
Free with trial Doodle Graph icon. Blue pen hand drawn infographic symbol on a notepaper piece. Line art style graphic design element. Web button with shadow. Decline, save on expences concept. Decrease chart icon illustration vectors Doodle Graph icon
Free with trial Purple Global economic crisis icon isolated on purple background. World finance crisis. Minimalism concept. 3D render illustration. Decrease chart icon illustration illustrations Purple Global economic crisis icon isolated on purple background. World finance crisis. Minimalism concept. 3D render
Free with trial A flat design vector illustration depicting a financial market data board or stock ticker. The black-bordered display features various stock symbols, numerical values like '$ ,80K', '$ ,22,50', and indicators of market performance. Prominently highlighted in red is the word 'LOSING', accompanied by a red downward arrow signifying a price drop, and a red downward triangle. Conversely, a green upward arrow indicates a price increase. This icon effectively visualizes concepts of financial loss, gain, market volatility, and investment trends, suitable for business, finance, and economic content. Decrease chart icon illustration illustrations Financial Market Data Board Icon with Loss and Gain Indicators. A flat design vector illustration depicting a financial market data board or stock ticker. The black-bordered display features various stock symbols, numerical values like '$ ,80K', '$ ,22,50', and indicators of market performance. Prominently highlighted in red is the word 'LOSING', accompanied by a red downward arrow signifying a price drop, and a red downward triangle. Conversely, a green upward arrow indicates a price increase. This icon effectively visualizes concepts of financial loss, gain, market volatility, and investment trends, suitable for business, finance, and economic content.
Free with trial Circular maze with a descending bar chart icon, symbolizing the challenge of navigating business data and analytics amid declines, obstacles, and the search for strategic solutions and recovery. Decrease chart icon illustration illustrations Navigating complex data decline challenges and finding solutions. Circular maze with a descending bar chart icon, symbolizing the challenge of navigating business data and analytics amid declines, obstacles, and the search for strategic solutions and recovery
Free with trial Set Drop in crude oil price, Dollar rate decrease, and Global economic crisis on seamless pattern. Vector. Decrease chart icon illustration vectors Set Drop in crude oil price, Dollar rate decrease, and Global economic crisis on seamless pattern. Vector
Free with trial Price drop icon. Cost reduction symbol. Oil value Vector. Cheap fuel. EPS 10. Decrease chart icon illustration vectors Price drop icon. Cost reduction symbol. Oil value Vector. Cheap fuel.
Free with trial A minimalist illustration of a downward pointing zigzag arrow, conveying decline, direction, and a sense of motion. Great for illustrating a negative trend or movement. Decrease chart icon illustration vectors Simple Bold Zigzag Decline Arrow Direction Sign Symbol Icon Element. A minimalist illustration of a downward pointing zigzag arrow, conveying decline, direction, and a sense of motion. Great for illustrating a negative trend or movement.
Free with trial White Global economic crisis icon isolated with long shadow background. World finance crisis. Pink hexagon button. Vector. Decrease chart icon illustration illustrations White Global economic crisis icon isolated with long shadow background. World finance crisis. Pink hexagon button
Free with trial Bar chart representation of data increase growth and finance. Data analysis. Decrease chart icon illustration vectors Bar chart representation of data increase growth and finance. Data analysis
Free with trial Set line Shopping cart and dollar, Piggy bank hammer, Financial growth decrease and Money plant the pot. Business infographic template. Vector. Decrease chart icon illustration illustrations Set line Shopping cart and dollar, Piggy bank hammer, Financial growth decrease and Money plant the pot. Business
Free with trial Pink Searching for food in trash can on streets outdoors icon isolated on pink background. Homelessness and poverty concept. Minimalism concept. 3D render illustration. Decrease chart icon illustration illustrations Pink Searching for food in trash can on streets outdoors icon isolated on pink background. Homelessness and poverty
Free with trial This image features a minimalist and modern vector icon of a jagged downward trending line graph, sharply declining from left to right, symbolizing financial loss, economic downturn, or market decline, set against a clean and uncluttered white background suitable for use in presentations, reports, infographics, or digital media to visually communicate negative trends or decreasing performance. Decrease chart icon illustration illustrations Sharp downward trending line graph icon isolated on white background representing financial loss or market decline vector. This image features a minimalist and modern vector icon of a jagged downward trending line graph, sharply declining from left to right, symbolizing financial loss, economic downturn, or market decline, set against a clean and uncluttered white background suitable for use in presentations, reports, infographics, or digital media to visually communicate negative trends or decreasing performance
Free with trial Up Down Pointer Icon Scroll Gesture Point Pointing Page Upward Downward Navigation Direction Swipe North South Sign Symbol Graphic Illustration Path. Decrease chart icon illustration vectors Up Down Pointer Icon Scroll Gesture Point Pointing Page Upward Downward Navigation Direction Swipe North South
Free with trial Inflation sign. Sack pictogram with dollar sign and arrow down. Symbol of money depreciation vector linear illustration. Decrease chart icon illustration vectors Inflation sign. Sack pictogram with dollar sign and arrow down. Symbol of money depreciation vector linear illustration.
Free with trial Basic charts line icon set. Bar diagram, pie and histogram graph. Data visualization, growth and distribution analysis for business and finance. Vector illustration Editable Stroke. Decrease chart icon illustration illustrations Basic charts line icon set. Bar diagram, pie and histogram graph. Data visualization, growth and distribution analysis
Free with trial Set Money plant in the pot, Financial growth decrease, Bank building and bag. Business infographic template. Vector. Decrease chart icon illustration vectors Set Money plant in the pot, Financial growth decrease, Bank building and bag. Business infographic template. Vector
Free with trial Set line Falling property prices, Shutdown of factory, Drop crude oil and Global economic crisis news icon. Vector. Decrease chart icon illustration illustrations Set line Falling property prices, Shutdown of factory, Drop crude oil and Global economic crisis news icon. Vector
Free with trial Blue bar chart with decreasing values beside a soft cloud shape and horizontal lines. Ideal for data analytics, cloud computing, business growth, technology, forecasts, trends, and innovation. Simple. Decrease chart icon illustration illustrations Minimalist Bar Chart with Cloud Element Representing Data Analysis and Cloud Computing Concepts. Blue bar chart with decreasing values beside a soft cloud shape and horizontal lines. Ideal for data analytics, cloud computing, business growth, technology, forecasts, trends, and innovation. Simple