Free with trial Set of economic crisis icons. Thin linear style icons Pack. Vector Illustration Outline icons collection. Decrease chart icon illustration vectors Set of economic crisis icons. Thin linear style icons Pack. Vector Illustration
Free with trial Downward graph trend with red points, sad face, and a file folder suggests failure, loss, or poor performance. Ideal for business, data, analysis, decline management error simple flat metaphor. Decrease chart icon illustration vectors Declining Graph with Sad Face Emphasizing Negative Analytics and Data Loss. Downward graph trend with red points, sad face, and a file folder suggests failure, loss, or poor performance. Ideal for business, data, analysis, decline management error simple flat metaphor
Free with trial Black arrows illustrating an upward and downward zigzag fluctuation, symbolizing a dynamic process of movement, change, and varying trends on a clean white background. Decrease chart icon illustration vectors Fluctuation movement with up and down zigzag arrows. Black arrows illustrating an upward and downward zigzag fluctuation, symbolizing a dynamic process of movement, change, and varying trends on a clean white background
Free with trial Financial business concept going bankrupt flat vector design. design vector illustration. Decrease chart icon illustration vectors Finance flat concept going bankrupt vector design illustration. financial business concept going bankrupt flat vector design.design vector illustration
Free with trial This is an illustration of an arrow pointing down to the right (down mark). Decrease chart icon illustration vectors Illustration of a downward arrow (down mark) on the right shoulder. This is an illustration of an arrow pointing down to the right (down mark).
Free with trial 3D percent icons with red and green arrows symbolizing price growth and fall. Modern vector concept for business, finance, sale, and economy illustration, up and down financial rate design. Decrease chart icon illustration vectors 3D percent icons with red and green arrows symbolizing price growth and fall. Modern vector concept for business
Free with trial Laptop displaying a stock market graph with red and green lines indicating a downward trend in share prices. Decrease chart icon illustration illustrations Laptop showing decreasing chart representing stock market crash. Laptop displaying a stock market graph with red and green lines indicating a downward trend in share prices
Free with trial Laptop displaying a stock market graph with red and green lines indicating a downward trend in share prices. Decrease chart icon illustration vectors Laptop showing decreasing chart representing stock market crash. Laptop displaying a stock market graph with red and green lines indicating a downward trend in share prices
Free with trial Downward line graph with data points, sad orange face symbolizing negativity, and a robot suggesting AI involvement or automation. Ideal for business, AI, automation, data analysis, technology. Decrease chart icon illustration vectors Declining Chart with Robot and Sad Face Indicating Negative Trends and AI Interaction. Downward line graph with data points, sad orange face symbolizing negativity, and a robot suggesting AI involvement or automation. Ideal for business, AI, automation, data analysis, technology
Free with trial Declining bar chart with bold red fake label above a minimal cloud. Ideal for misinformation, fraud, analysis, skepticism, distrust, validation, critical thinking. Simple flat metaphor. Decrease chart icon illustration vectors Data Misrepresentation Concept with Declining Graph and Fake Label in Simple Style. Declining bar chart with bold red fake label above a minimal cloud. Ideal for misinformation, fraud, analysis, skepticism, distrust, validation, critical thinking. Simple flat metaphor
Free with trial Sad emoticon alongside two keys and a downward bar chart reflecting themes of loss, failure, missed opportunity, and regression. Ideal for business setback, financial trouble, discouragement, or. Decrease chart icon illustration vectors Sad face with keys and declining bar graph representing loss, failure, and setback themes. Sad emoticon alongside two keys and a downward bar chart reflecting themes of loss, failure, missed opportunity, and regression. Ideal for business setback, financial trouble, discouragement, or
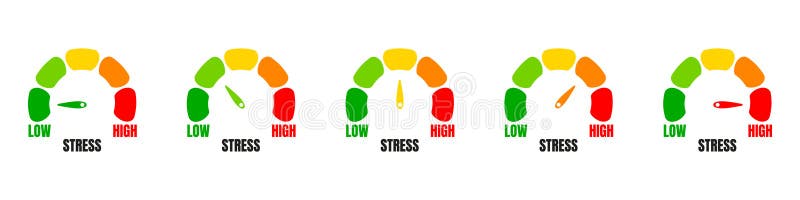
Free with trial Stress level meter, progress bar gauge isolated over white background, stress meter vector medical illustration. vector. Decrease chart icon illustration vectors Stress level meter, progress bar gauge isolated over white background, stress meter vector medical illustration
Free with trial Bar chart with upward trend, sad face, and analytics dashboard highlights challenges in progress or data performance. Ideal for financial difficulty, business risk, loss assessment, data analysis. Decrease chart icon illustration vectors Rising Bar Graph with Sad Face Symbolizing Negative Growth or Challenges in Analytics. Bar chart with upward trend, sad face, and analytics dashboard highlights challenges in progress or data performance. Ideal for financial difficulty, business risk, loss assessment, data analysis
Free with trial Flat Design Illustration Financial Debt Penalties and Time Constraints. Decrease chart icon illustration vectors Flat Design Illustration Financial Debt Penalties and Time Constraints
Free with trial A crisp vector illustration of an orange downward trending line graph, signifying a fall, loss, or negative economic movement. This versatile icon is perfect for financial dashboards, business analysis, or reporting on declining statistics. Its clear visual representation quickly conveys a reduction in values, making it highly effective, vector design Generative AI. Decrease chart icon illustration vectors Orange Downward Trending Financial Graph, vector design Generative AI. A crisp vector illustration of an orange downward trending line graph, signifying a fall, loss, or negative economic movement. This versatile icon is perfect for financial dashboards, business analysis, or reporting on declining statistics. Its clear visual representation quickly conveys a reduction in values, making it highly effective, vector design Generative AI
Free with trial A collection of simple finance graphic element icons, depicting trends, charts, and money. These icons can be used to visualize various financial concepts, such as growth, decline, and investment. Decrease chart icon illustration vectors Simple Style Finance Graphic Element Icons with Trend, Chart and Money. A collection of simple finance graphic element icons, depicting trends, charts, and money. These icons can be used to visualize various financial concepts, such as growth, decline, and investment.
Free with trial Flat vector design illustration of bankruptcy finance business concept. design vector illustration. Decrease chart icon illustration vectors Flat vector design illustration of bankruptcy finance business concept
Free with trial Broken circular chart graphic symbolizing failure and division with blue and red segments. Decrease chart icon illustration vectors Broken circular chart graphic symbolizing failure and division with blue and red segments
Free with trial Dollar coin next to declining bar graph and directional arrow illustrating financial downturn. Ideal for finance, economics, investment, stock market, loss, budget analysis, simple flat metaphor. Decrease chart icon illustration illustrations Dollar Sign Coin and Declining Bar Chart with Arrow Indicating Financial Downward Trend. Dollar coin next to declining bar graph and directional arrow illustrating financial downturn. Ideal for finance, economics, investment, stock market, loss, budget analysis, simple flat metaphor
Free with trial Downward-sloping line graph on grid, sad face expressing disappointment, person running away. Ideal for business failure, loss, decline, negative growth, setback, challenge simple flat metaphor. Decrease chart icon illustration illustrations Declining Performance Chart with Sad Face and Running Figure Symbolizing Loss or Failure. Downward-sloping line graph on grid, sad face expressing disappointment, person running away. Ideal for business failure, loss, decline, negative growth, setback, challenge simple flat metaphor
Free with trial Financial business concept going bankrupt flat vector design. design vector illustration. Decrease chart icon illustration vectors Financial business concept going bankrupt flat vector design illustration. financial business concept going bankrupt flat vector design.design vector illustration
Free with trial Discover a diverse collection of flat illustration concept vectors, perfect for enhancing your design projects. Explore creativity with our unique visuals. Decrease chart icon illustration vectors Cost reduction concept costs cut costs optimization business Flat vector concept illustration. Discover a diverse collection of flat illustration concept vectors, perfect for enhancing your design projects. Explore creativity with our unique visuals
Free with trial Bankruptcy concept in flat design business. design vector illustration. Decrease chart icon illustration vectors Bankruptcy concept in flat illustration vector design business. bankruptcy concept in flat design business.design vector illustration
Free with trial Prohibition sign with declining bar chart and people icons. No decline concept. EPS 10. Decrease chart icon illustration vectors Prohibition sign with declining bar chart and people icons. No decline concept.
Free with trial Data analysis graphs with up and down arrow line icons set. Increase and reduction of economy or trend charts, price boost, stock market research thin black and red outline symbols vector illustration. Decrease chart icon illustration vectors Data analysis graphs with up and down arrow, economy or trend charts line icons set. Data analysis graphs with up and down arrow line icons set. Increase and reduction of economy or trend charts, price boost, stock market research thin black and red outline symbols vector illustration
Free with trial CO2 inside cloud shape with blue downward arrows indicating reduction, next to bar chart and small cloud. Ideal for sustainability, environment, data, carbon reduction, climate change, eco-friendly. Decrease chart icon illustration vectors Reducing Carbon Emissions with Data Analysis Highlighted by Cloud Imagery and Downward Arrows. CO2 inside cloud shape with blue downward arrows indicating reduction, next to bar chart and small cloud. Ideal for sustainability, environment, data, carbon reduction, climate change, eco-friendly
Free with trial The up and down nature of interest rates is the subject of this 3-d illustration with percentage rate symbols indicating either up or down movement. Decrease chart icon illustration illustrations The up and down nature of interest rates is the subject of this 3-d illustration with percentage rate symbols
Free with trial Increase and reduction of economy or trend charts, price boost, stock market research thin black outline symbols vector illustration. Data analysis graphs with up and down arrow line icons set. Decrease chart icon illustration vectors Data analysis graphs with up and down arrow, economy or trend charts line icons set. Increase and reduction of economy or trend charts, price boost, stock market research thin black outline symbols vector illustration. Data analysis graphs with up and down arrow line icons set.
Free with trial Signed document with a frown face and declining bar chart symbolizing failure, loss, rejection, or performance drop. Ideal for business, finance, loss, analysis, feedback strategy simple landing. Decrease chart icon illustration vectors Document with Signature, Sad Face, and Bar Graph Highlighting Decline in Performance or Approval. Signed document with a frown face and declining bar chart symbolizing failure, loss, rejection, or performance drop. Ideal for business, finance, loss, analysis, feedback strategy simple landing
Free with trial Bar graph with downward trend, arrows indicating loss, and coins falling. Ideal for finance, economics, business, investment, budgeting revenue loss and decline concepts. Simple flat metaphor. Decrease chart icon illustration illustrations Revenue Decline Illustration with Bar Graph, Arrows, and Falling Coins Symbolizing Financial Loss. Bar graph with downward trend, arrows indicating loss, and coins falling. Ideal for finance, economics, business, investment, budgeting revenue loss and decline concepts. Simple flat metaphor
Free with trial Business icons set in comic style. Make money cartoon vector illustration on isolated background. Media internet splash effect business concept. Decrease chart icon illustration vectors Business icons set in comic style. Make money cartoon vector illustration on isolated background. Media internet splash effect
Free with trial Chess king symbolizing leadership beside a declining bar graph for strategy, business performance. Ideal for growth analysis, planning, decision-making, leadership vision, competition, management. Decrease chart icon illustration illustrations Strategic planning concept with chess king and declining bar chart for business analysis insights. Chess king symbolizing leadership beside a declining bar graph for strategy, business performance. Ideal for growth analysis, planning, decision-making, leadership vision, competition, management
Free with trial A collection of financial icons in vector format. The transparent background is valuable for designers. Decrease chart icon illustration vectors Financial Increase and Decrease Icons Vector Illustration on transparent background. A collection of financial icons in vector format. The transparent background is valuable for designers
Free with trial Financial business concept going bankrupt flat vector design. design vector illustration. Decrease chart icon illustration vectors Financial concept going bankrupt flat vector design illustration. financial business concept going bankrupt flat vector design.design vector illustration
Free with trial A 3D illustration depicts financial data analysis. On the left, a purple rectangular panel shows a red downward-trending arrow and a small pie chart with red, yellow, and blue segments. Below it, another purple panel displays a candlestick chart with red and blue bars. To the right, an orange magnifying glass with a turquoise lens hovers, suggesting investigation. The entire composition is set. Decrease chart icon illustration illustrations 3D Render of Financial Data Visualization with Downward Trend Graph and Magnifying Glass. A 3D illustration depicts financial data analysis. On the left, a purple rectangular panel shows a red downward-trending arrow and a small pie chart with red, yellow, and blue segments. Below it, another purple panel displays a candlestick chart with red and blue bars. To the right, an orange magnifying glass with a turquoise lens hovers, suggesting investigation. The entire composition is set
Free with trial Financial business concept going bankrupt flat vector design. design vector illustration. Decrease chart icon illustration vectors Financial concept going bankrupt flat vector design illustration. financial business concept going bankrupt flat vector design.design vector illustration
Free with trial Declining bar graph on a trolley, showing a downward arrow, stock market trend, loss illustration. Decrease chart icon illustration vectors Declining bar graph on a trolley, showing a downward arrow, stock market trend, loss illustration
Free with trial Percentage symbol in circle with arrow up and arrow down icons represents financial growth and decrease. Decrease chart icon illustration vectors Percentage symbol in circle with arrow up and arrow down icons represents financial growth and decrease
Free with trial 3D Hand is holding Diagram and dollar illustration. Dollar value rising. Exchange rate or financial report, economy or investment concept. Trendy and modern vector in 3d style. Decrease chart icon illustration vectors 3D Hand is holding Diagram and dollar illustration. Dollar value rising. Exchange rate or financial report, economy
Free with trial Declining Bar Chart: Representing Loss, Reduction, and Negative Trends with a Downward-Pointing Arrow Graphic. Decrease chart icon illustration vectors Declining Bar Chart: Representing Loss, Reduction, and Negative Trends with a Downward-Pointing Arrow Graphic
Free with trial This high-quality vector graphic features a simple, hand-drawn red arrow pointing downwards. Perfect for presentations, websites, infographics, and any project requiring a clear and concise directional indicator. The minimalist design ensures versatility across various styles and applications. Download this easily scalable vector and enhance your designs with a clean and professional look. Ideal for illustrating decline, decrease, or a downward trend. This versatile asset is perfect for both digital and print use, offering high-resolution quality for crisp results. Decrease chart icon illustration illustrations Hand-Drawn Red Down Arrow: Simple, Clean, and Versatile Vector Graphic for Presentations, Websites, and More! UI UX sign. This high-quality vector graphic features a simple, hand-drawn red arrow pointing downwards. Perfect for presentations, websites, infographics, and any project requiring a clear and concise directional indicator. The minimalist design ensures versatility across various styles and applications. Download this easily scalable vector and enhance your designs with a clean and professional look. Ideal for illustrating decline, decrease, or a downward trend. This versatile asset is perfect for both digital and print use, offering high-resolution quality for crisp results.
Free with trial A simple yet effective hand-drawn red arrow pointing downwards. This vector graphic is ideal for various applications, from presentations and websites to marketing materials. Its clean design makes it easily adaptable to different projects, conveying decline, decrease, or negative trends clearly and concisely. Perfect for illustrating data, showcasing negative growth, or simply adding a visual cue to your design. The minimalist aesthetic ensures versatility across diverse design styles. Decrease chart icon illustration illustrations Hand Drawn Red Down Arrow: Simple, Clean Vector Graphic for Presentations, Websites, and Marketing Materials. Perfect. A simple yet effective hand-drawn red arrow pointing downwards. This vector graphic is ideal for various applications, from presentations and websites to marketing materials. Its clean design makes it easily adaptable to different projects, conveying decline, decrease, or negative trends clearly and concisely. Perfect for illustrating data, showcasing negative growth, or simply adding a visual cue to your design. The minimalist aesthetic ensures versatility across diverse design styles.
Free with trial Set line Website with stocks market Search engine Browser setting Financial growth increase window Photo retouching and mail and icon. Vector. Decrease chart icon illustration vectors Set line Website with stocks market, Search engine, Browser setting, Financial growth increase, window, Photo retouching. Set line Website with stocks market Search engine Browser setting Financial growth increase window Photo retouching and mail and icon. Vector.
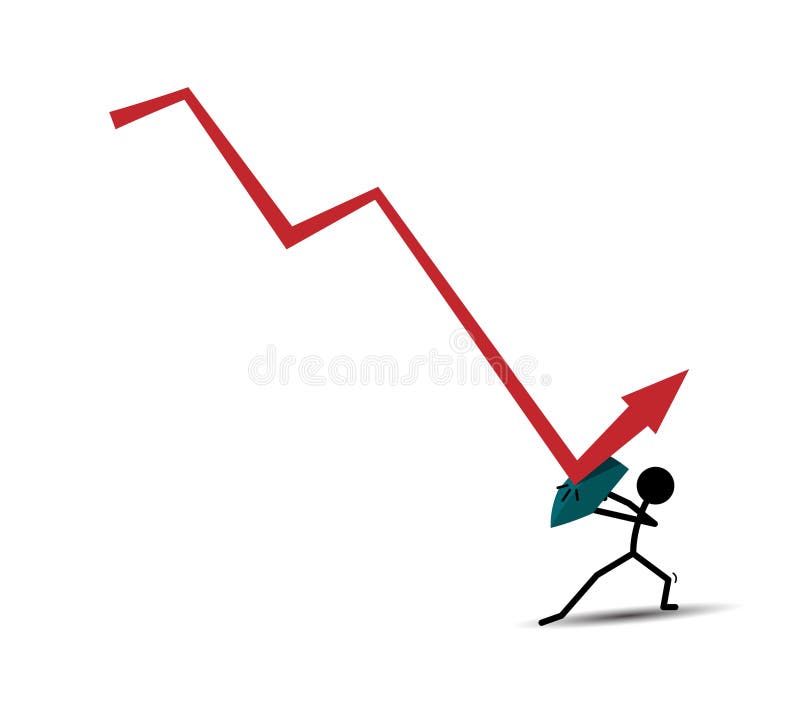
Free with trial Illustration of a graphic diagram going down and being reflected by a shield. . loss or decline. flat design style. Suitable for use in reports, illustrations, presentations, etc. vector design template. Decrease chart icon illustration vectors Illustration of a graphic diagram going down and being reflected by a shield. . loss or decline. flat design style. Suitable for
Free with trial Three red arrows pointing down with white percentage symbols signifying a drop in prices or economic decline isolated on transparent background. Decrease chart icon illustration vectors Three red downward pointing arrows with percentage symbols indicating a decrease in value or sales isolated on transparent. Three red arrows pointing down with white percentage symbols signifying a drop in prices or economic decline isolated on transparent background
Free with trial Graphic diagram illustration taken down and cut using scissors. loss or decline. flat design style. Suitable for use in reports, illustrations, presentations, etc. vector design template. Decrease chart icon illustration vectors Graphic diagram illustration taken down and cut using scissors. loss or decline. flat design style. Suitable for use in reports
Free with trial Financial market crash and economic decline downward arrows on digital blue dashboard with global statistics investment loss stock price reduction in global trade. Decrease chart icon illustration vectors Financial market crash and economic decline downward arrows on digital blue dashboard with global statistics investment loss stock
Free with trial Financial and Business infographic with 5 options or processes. Infographic with icons and text. Vector illustration. Decrease chart icon illustration vectors Financial and Business infographic with 5 options or processes.
Free with trial Collection of green upward and red downward arrows in different shapes and styles, symbolizing growth, success, decline, and loss. Clean vector illustration isolated on transparent background, ideal for business, finance, analytics, marketing, and infographic design. Decrease chart icon illustration vectors Green and Red Arrow Set Isolated on Transparent Background, Growth and Decline Vector Icons. Collection of green upward and red downward arrows in different shapes and styles, symbolizing growth, success, decline, and loss. Clean vector illustration isolated on transparent background, ideal for business, finance, analytics, marketing, and infographic design.
Free with trial Minimalist vector illustration showing a black diagram with a downward arrow symbolizing economic decline, financial loss, recession, or negative business performance. Clean and modern design isolated on a white background, ideal for business presentations, financial reports, infographics, websites, mobile apps, and marketing materials related to economics, finance, investment, and analytics. Decrease chart icon illustration vectors . Minimalist vector illustration showing a black diagram with a downward arrow symbolizing economic decline, financial loss, recession, or negative business performance. Clean and modern design isolated on a white background, ideal for business presentations, financial reports, infographics, websites, mobile apps, and marketing materials related to economics, finance, investment, and analytics.
Free with trial Brown sad face beside a statistical graph with downward trends. Ideal for failure, economic loss, low performance, recession, disappointment, market analysis, simple flat metaphor. Decrease chart icon illustration vectors Downward Business Trends Illustrated by Sad Face and Declining Graph. Brown sad face beside a statistical graph with downward trends. Ideal for failure, economic loss, low performance, recession, disappointment, market analysis, simple flat metaphor
Free with trial Blue downward arrow beside a user profile document with lines and icons. Ideal for analytics, report decline, performance review, career management, trend analysis, business analysis, simple flat. Decrease chart icon illustration vectors Downward Trend Arrow and User Profile Document Representation. Blue downward arrow beside a user profile document with lines and icons. Ideal for analytics, report decline, performance review, career management, trend analysis, business analysis, simple flat
Free with trial Modern elegant thunder padlock logo design, ideal for energy security, power systems, electricity protection, and dynamic branding identity. Decrease chart icon illustration vectors Modern and elegant thunder padlock logo. Modern elegant thunder padlock logo design, ideal for energy security, power systems, electricity protection, and. Modern elegant thunder padlock logo design, ideal for energy security, power systems, electricity protection, and dynamic branding identity.
Free with trial Downward arrows representing decline, calculator symbolizing calculations, and percentage sign for financial analysis. Ideal for business, finance, data analysis, interest rate, savings, growth. Decrease chart icon illustration vectors Decreasing Trends with Financial Calculation and Percentage Concept. Downward arrows representing decline, calculator symbolizing calculations, and percentage sign for financial analysis. Ideal for business, finance, data analysis, interest rate, savings, growth
Free with trial Bold downward arrow and coins dropping, representing decline in money value or financial crisis. Ideal for economics, finance, decline, crisis, loss, risk economic issues. Simple flat metaphor. Decrease chart icon illustration illustrations Downward Financial Trend Illustrated with Falling Coins and Bold Down Arrow. Bold downward arrow and coins dropping, representing decline in money value or financial crisis. Ideal for economics, finance, decline, crisis, loss, risk economic issues. Simple flat metaphor
Free with trial A clean flat design vector illustration featuring opposing arrows symbolizing growth and decline, perfect for financial or business concepts. Decrease chart icon illustration vectors Black zigzag arrows indicating market trends. A clean flat design vector illustration featuring opposing arrows symbolizing growth and decline, perfect for financial or business concepts
Free with trial Wavy green arrows visualizing market movement, trend fluctuation, and economic volatility, depicting both growth and decline, ideal for financial data and business analytics concepts. Decrease chart icon illustration illustrations Wavy arrows showing up and down fluctuation trend. Wavy green arrows visualizing market movement, trend fluctuation, and economic volatility, depicting both growth and decline, ideal for financial data and business analytics concepts
Free with trial Bankruptcy concept in flat design business. design vector illustration. Decrease chart icon illustration vectors Bankruptcy concept in flat vector design business. bankruptcy concept in flat design business.design vector illustration
Free with trial Graph with curve, labeled axes, data table, hand with coin, and dollar symbols. Ideal for finance, business, economy, investment data visualization analytics simple landing page. Decrease chart icon illustration illustrations Financial graph with data table, hand receiving coins, and analysis concept design. Graph with curve, labeled axes, data table, hand with coin, and dollar symbols. Ideal for finance, business, economy, investment data visualization analytics simple landing page
Free with trial Line graph showing downward trend, large sad face, smaller happy face, and individual figure. Ideal for performance analysis, emotions tracking, business trends, psychology, market research feedback. Decrease chart icon illustration vectors Declining Performance Graph with Emotions and Individual Representation. Line graph showing downward trend, large sad face, smaller happy face, and individual figure. Ideal for performance analysis, emotions tracking, business trends, psychology, market research feedback
Free with trial Illustration of a growing energy independence with a simple oil barrel with a decreasing sign, a solar panel receiving sun, and a stylized wind turbine. Vector flat icon design on a white background for a resource transition illustration --chaos 30 --ar 16:9 --v 7 Job ID: 592d63c7-ea9f-4b58-8aae-19f2fa4830a1. Decrease chart icon illustration illustrations Energy Transition Solar, Wind, Oil Barrel, and Falling Market Graph. Illustration of a growing energy independence with a simple oil barrel with a decreasing sign, a solar panel receiving sun, and a stylized wind turbine. Vector flat icon design on a white background for a resource transition illustration --chaos 30 --ar 16:9 --v 7 Job ID: 592d63c7-ea9f-4b58-8aae-19f2fa4830a1
Free with trial Downward Trend Line Graph Icons for Financial Data vol 34820. Decrease chart icon illustration vectors Downward Trend Line Graph Icons for Financial Data
Free with trial Line graph illustrating data analysis and business statistics, charting financial growth, market changes, and performance metrics for visual information and infographic content. Decrease chart icon illustration illustrations Analyzing data with line graph showing business trends. Line graph illustrating data analysis and business statistics, charting financial growth, market changes, and performance metrics for visual information and infographic content
Free with trial Bankruptcy concept in flat design business. design vector illustration. Decrease chart icon illustration vectors Bankruptcy finance business concept flat vector design. bankruptcy concept in flat design business.design vector illustration
Free with trial Business performance, negative trends, data analysis, economic decline, search results, user concerns. Sad emoticon, graph with downward trend magnifying glass. Business and negative trends. Decrease chart icon illustration vectors Declining Graph with Sad Face and Search Bar Negative Trends and Analysis. Business performance, negative trends, data analysis, economic decline, search results, user concerns. Sad emoticon, graph with downward trend magnifying glass. Business and negative trends
Free with trial Red frowning face, line graph showing decline, pants, and small graph inset. Ideal for retail, business trends, economic downturn, loss, failure clothing sales simple flat metaphor. Decrease chart icon illustration illustrations Declining Sales Concept with Frowning Face, Pants, and Downward Line Graph. Red frowning face, line graph showing decline, pants, and small graph inset. Ideal for retail, business trends, economic downturn, loss, failure clothing sales simple flat metaphor
Free with trial Downward line graph with data points, red sad emoticon, error message box, and cloud. Ideal for business loss, mistakes, failure, analytics issues, disappointment error handling or recovery. Decrease chart icon illustration vectors Declining Trend with Error Message and Sad Emoticon Representing Failure or Loss. Downward line graph with data points, red sad emoticon, error message box, and cloud. Ideal for business loss, mistakes, failure, analytics issues, disappointment error handling or recovery
Free with trial Sad face beside a downward trend graph with red nodes, a pointing hand, blue card. Ideal for business loss, economic decline, poor performance, failure, recession, financial crisis simple flat. Decrease chart icon illustration vectors Declining Line Graph with Sad Face and Pointer Highlighting Negative Performance. Sad face beside a downward trend graph with red nodes, a pointing hand, blue card. Ideal for business loss, economic decline, poor performance, failure, recession, financial crisis simple flat
Free with trial Flat vector illustration displaying a green dollar bill with down arrows signifying economic decline or loss of funds. Decrease chart icon illustration vectors Dollar bill with down arrows depicting money loss concept. Flat vector illustration displaying a green dollar bill with down arrows signifying economic decline or loss of funds.
Free with trial Cardboard box with label beside a fluctuating line graph, denoting analytics, efficiency, shipment tracking, or delivery trends. Ideal for logistics, e-commerce, data trends, analysis operations. Decrease chart icon illustration vectors Box with Shipping Label and Data Graph Representing Logistics and Performance Trends. Cardboard box with label beside a fluctuating line graph, denoting analytics, efficiency, shipment tracking, or delivery trends. Ideal for logistics, e-commerce, data trends, analysis operations
Free with trial Sad face next to a declining line graph indicating falling satisfaction levels. Green, orange, and red happy faces for feedback. Ideal for data trends, surveys, reports, performance, analysis. Decrease chart icon illustration illustrations Declining satisfaction levels represented with happy faces and a downward trend graph. Sad face next to a declining line graph indicating falling satisfaction levels. Green, orange, and red happy faces for feedback. Ideal for data trends, surveys, reports, performance, analysis
Free with trial Line graph with downward trend and red markers, sad face symbolizing disappointment, outlined clouds indicating challenges. Ideal for analysis, business, growth, crisis, finance, performance or. Decrease chart icon illustration vectors Declining Graph with Sad Face and Clouds Representing Negative Trends and Challenges. Line graph with downward trend and red markers, sad face symbolizing disappointment, outlined clouds indicating challenges. Ideal for analysis, business, growth, crisis, finance, performance or
Free with trial Minimalist style gradient blue diagram showing downward trend line graph on black background representing economic decline or loss. Decrease chart icon illustration vectors Downward trend line graph on black background for infographic. Minimalist style gradient blue diagram showing downward trend line graph on black background representing economic decline or loss.
Free with trial A simple flat style bar graph shows a negative trend, with a downward arrow on a black background. Decrease chart icon illustration vectors Decreasing bar graph with downward arrow over black background. A simple flat style bar graph shows a negative trend, with a downward arrow on a black background.
Free with trial Sad face beside a descending line graph with plotted points, accompanied by a robot holding a data file. Ideal for technology, analytics, business insights, AI impact, performance review. Decrease chart icon illustration vectors Declining Trends Analyzed by AI Robot with Sad Face Indicating Negative Performance. Sad face beside a descending line graph with plotted points, accompanied by a robot holding a data file. Ideal for technology, analytics, business insights, AI impact, performance review
Free with trial Sales analysis. Sales with charts highlighting performance and revenue decline. Sales data optimization for retail strategies, e-commerce insights, and business reports. Decrease chart icon illustration vectors Data Analytics and Sales Decline Concept with Graphs and Marketing Visuals on Screen. Sales analysis. Sales with charts highlighting performance and revenue decline. Sales data optimization for retail strategies, e-commerce insights, and business reports
Free with trial Vertical arrow pointing downward next to bar graph with decreasing metrics. Ideal for business analysis, data visualization, financial downturn, market decline, trend report, economics, simple flat. Decrease chart icon illustration illustrations Declining Bar Graph with Arrow Indicating Downward Trend in Performance or Statistics. Vertical arrow pointing downward next to bar graph with decreasing metrics. Ideal for business analysis, data visualization, financial downturn, market decline, trend report, economics, simple flat
Free with trial Stylized graphic depicts a deceased emoticon with downward-pointing indicators. Flat design against a black background suggesting financial downturn or failure. Decrease chart icon illustration vectors Deceased Emoticon with Downward Indicators on a Black Background. Stylized graphic depicts a deceased emoticon with downward-pointing indicators. Flat design against a black background suggesting financial downturn or failure.
Free with trial Large percentage sign within a speech bubble and a person holding a pointer, pointing at an arrow. Ideal for finance, business, education, statistics, analysis, presentations strategy. Simple flat. Decrease chart icon illustration vectors Financial Presentation With Percentage Sign and Person Explaining Using a Pointer. Large percentage sign within a speech bubble and a person holding a pointer, pointing at an arrow. Ideal for finance, business, education, statistics, analysis, presentations strategy. Simple flat
Free with trial Large location marker, CO2 footprint, clipboard graph report, and downward arrow conveying emission reduction. Ideal for sustainability, green initiatives, data, environmental impact, efficiency. Decrease chart icon illustration vectors Carbon Footprint Reduction Concept with Location, CO2 Footprint, Report, and Dropping Emissions Indicator. Large location marker, CO2 footprint, clipboard graph report, and downward arrow conveying emission reduction. Ideal for sustainability, green initiatives, data, environmental impact, efficiency