Free with trial Business arrow up success seamless pattern isolated on black background. Simple background. Decrease dollar vectors Business arrow up success seamless pattern isolated on black background
Free with trial Stock showing diverse collection of black and white for financial data analysis charts and graphs keywords: financial, data, analysis, charts. Decrease dollar illustrations Diverse Collection of Black and White for Financial Data Analysis Charts and Graphs Keywords: financial, data
Free with trial Illustration of a business activities. Decrease dollar illustrations Illustration of a business activities
Free with trial Business arrow up success seamless pattern isolated on white background. Simple background. Decrease dollar vectors Business arrow up success seamless pattern isolated on white background
Free with trial This comprehensive vector icon set illustrates various financial market trends, economic indicators, and potential crises. Featuring line graphs, bar charts, pie charts, dollar signs, piggy banks, and warning sirens, the collection uses a striking red and black color palette to depict both growth and decline. Concepts like stock market volatility, investment risks, economic downturns, and business analytics are visually represented. Ideal for financial reports, business presentations, economic news, investment platforms, and educational materials requiring clear and impactful visual communication of market dynamics. Decrease dollar vectors Financial Market Trends and Crisis Vector Icons Set. This comprehensive vector icon set illustrates various financial market trends, economic indicators, and potential crises. Featuring line graphs, bar charts, pie charts, dollar signs, piggy banks, and warning sirens, the collection uses a striking red and black color palette to depict both growth and decline. Concepts like stock market volatility, investment risks, economic downturns, and business analytics are visually represented. Ideal for financial reports, business presentations, economic news, investment platforms, and educational materials requiring clear and impactful visual communication of market dynamics.
Free with trial Decreasing arrow and golden coins heap. Crisis, money and loss concept. 3d rendering. Decrease dollar illustrations Decreasing arrow and golden coins heap
Free with trial A conceptual vector illustration on the theme of financial obligations. The image shows a desk calendar titled 'Loan Repayment' with marked due dates, alongside stacks of gold dollar coins. A descending red arrow points towards the money, symbolizing debt reduction, payment costs, or financial expenses. This graphic is perfect for illustrating concepts like personal finance, budgeting, mortgage payments, credit deadlines, debt management, and financial planning. The clean, flat design is ideal for websites, infographics, and presentations. Decrease dollar vectors Loan Repayment Schedule and Debt Management Concept. A conceptual vector illustration on the theme of financial obligations. The image shows a desk calendar titled 'Loan Repayment' with marked due dates, alongside stacks of gold dollar coins. A descending red arrow points towards the money, symbolizing debt reduction, payment costs, or financial expenses. This graphic is perfect for illustrating concepts like personal finance, budgeting, mortgage payments, credit deadlines, debt management, and financial planning. The clean, flat design is ideal for websites, infographics, and presentations.
Free with trial Blue Cost reduction icon isolated on blue background. Minimalism concept. 3D render illustration. Decrease dollar illustrations Blue Cost reduction icon isolated on blue background. Minimalism concept. 3D render illustration
Free with trial Hot and cold wallet for storing cryptocurrency or Bitcoin. Blockchain technology. Virtual mining. Pouch with golden BTC token. Ecommerce cash. Fintech payment. Vector set of virtual e-wallet icons. Decrease dollar vectors Hot and cold wallet for storing cryptocurrency or Bitcoin. Blockchain technology. Pouch with golden BTC token. Ecommerce cash. Hot and cold wallet for storing cryptocurrency or Bitcoin. Blockchain technology. Virtual mining. Pouch with golden BTC token. Ecommerce cash. Fintech payment. Vector set of virtual e-wallet icons
Free with trial Scale with illustrations of cash and home stocks. The concept of inflation. Stock Illustration. Home price is decrease. Decrease dollar vectors Scale with illustrations of cash and home stocks. The concept of inflation. Stock Illustration
Free with trial Downward arrow alongside a money bag and binary code speech bubble showing cost reduction concepts. Ideal for finance, technology, coding, efficiency, investment, savings, simple flat metaphor. Decrease dollar illustrations Decreasing Costs with Digital Transformation and Binary Communication. Downward arrow alongside a money bag and binary code speech bubble showing cost reduction concepts. Ideal for finance, technology, coding, efficiency, investment, savings, simple flat metaphor
Free with trial This image depicts a financial downturn, with stacks of coins decreasing under a magnifying glass, accompanied by a. Decrease dollar illustrations Economic Downturn Magnifying Glass on Falling Money Graph. This image depicts a financial downturn, with stacks of coins decreasing under a magnifying glass, accompanied by a.
Free with trial Blue Global economic crisis icon isolated on blue background. World finance crisis. Minimalism concept. 3D render illustration. Decrease dollar illustrations Blue Global economic crisis icon isolated on blue background. World finance crisis. Minimalism concept. 3D render
Free with trial Purple Global economic crisis icon isolated on purple background. World finance crisis. Minimalism concept. 3D render illustration. Decrease dollar illustrations Purple Global economic crisis icon isolated on purple background. World finance crisis. Minimalism concept. 3D render
Free with trial A flat design vector illustration depicting a financial market data board or stock ticker. The black-bordered display features various stock symbols, numerical values like '$ ,80K', '$ ,22,50', and indicators of market performance. Prominently highlighted in red is the word 'LOSING', accompanied by a red downward arrow signifying a price drop, and a red downward triangle. Conversely, a green upward arrow indicates a price increase. This icon effectively visualizes concepts of financial loss, gain, market volatility, and investment trends, suitable for business, finance, and economic content. Decrease dollar illustrations Financial Market Data Board Icon with Loss and Gain Indicators. A flat design vector illustration depicting a financial market data board or stock ticker. The black-bordered display features various stock symbols, numerical values like '$ ,80K', '$ ,22,50', and indicators of market performance. Prominently highlighted in red is the word 'LOSING', accompanied by a red downward arrow signifying a price drop, and a red downward triangle. Conversely, a green upward arrow indicates a price increase. This icon effectively visualizes concepts of financial loss, gain, market volatility, and investment trends, suitable for business, finance, and economic content.
Free with trial A comprehensive vector icon collection illustrating various aspects of financial crises, market downturns, and economic challenges. This set includes symbols like bull and bear market dynamics, broken shields representing risk and vulnerability, declining bar charts, candlestick patterns, and emergency indicators. Concepts such as bankruptcy, recession, financial loss, and market volatility are visually conveyed. Ideal for financial news, economic reports, business presentations, educational materials, and articles discussing market risks or economic forecasts. Decrease dollar vectors Financial Crisis, Market Downturn, and Bankruptcy Vector Icons Set. A comprehensive vector icon collection illustrating various aspects of financial crises, market downturns, and economic challenges. This set includes symbols like bull and bear market dynamics, broken shields representing risk and vulnerability, declining bar charts, candlestick patterns, and emergency indicators. Concepts such as bankruptcy, recession, financial loss, and market volatility are visually conveyed. Ideal for financial news, economic reports, business presentations, educational materials, and articles discussing market risks or economic forecasts.
Free with trial Set line Mobile stock trading, Contract money and pen and Global economic crisis on seamless pattern. Vector. Decrease dollar illustrations Set line Mobile stock trading, Contract money and pen and Global economic crisis on seamless pattern. Vector
Free with trial Stickman presenting income growth with upward arrow and expenses decrease illustrated with chart. Perfect for financial themed presentations. Use as simple visual tool to show financial concepts on. Decrease dollar illustrations Stickman with Financial Graphic Illustration on White Background. Stickman presenting income growth with upward arrow and expenses decrease illustrated with chart. Perfect for financial themed presentations. Use as simple visual tool to show financial concepts on
Free with trial Price drop icon. Cost reduction symbol. Oil value Vector. Cheap fuel. EPS 10. Decrease dollar vectors Price drop icon. Cost reduction symbol. Oil value Vector. Cheap fuel.
Free with trial Financial crisis, business bankruptcy, money loss, and economy collapse concepts. Vector of crisis financial, bankruptcy and recession illustration. Decrease dollar vectors Financial crisis, business bankruptcy, money loss, and economy collapse concepts
Free with trial White Global economic crisis icon isolated with long shadow background. World finance crisis. Pink hexagon button. Vector. Decrease dollar illustrations White Global economic crisis icon isolated with long shadow background. World finance crisis. Pink hexagon button. Vector
Free with trial Bear market business vector concept. Symbol of finance, downturn, trading. Minimal design eps10 illustration. Decrease dollar vectors Bear market business vector concept. Symbol of finance, downturn, trading. Minimal illustration
Free with trial A 3D rendering depicts a scale balancing location markers (representing market presence) and a downward-trending arrow (symbolizing market value decline). It visually represents the complex relationship between a business's geographic reach and its financial performance, highlighting how even strong. Decrease dollar illustrations Location vs. Market Value. A 3D rendering depicts a scale balancing location markers (representing market presence) and a downward-trending arrow (symbolizing market value decline). It visually represents the complex relationship between a business's geographic reach and its financial performance, highlighting how even strong
Free with trial Pink Searching for food in trash can on streets outdoors icon isolated on pink background. Homelessness and poverty concept. Minimalism concept. 3D render illustration. Decrease dollar illustrations Pink Searching for food in trash can on streets outdoors icon isolated on pink background. Homelessness and poverty
Free with trial This vector illustration set features six distinct icons representing key financial and economic concepts. It includes bar charts depicting growth with a green arrow and decline with a red arrow, alongside currency exchange rate indicators for USD, INR, and EUR. Two donut charts visualize data distribution, while a world map colored green and red signifies global market trends or segmentation. Ideal for business presentations, financial reports, economic analysis, and investment-related content, these versatile graphics convey complex data clearly and concisely. Decrease dollar vectors Financial Growth, Decline, and Global Market Data Visualization Icons Set. This vector illustration set features six distinct icons representing key financial and economic concepts. It includes bar charts depicting growth with a green arrow and decline with a red arrow, alongside currency exchange rate indicators for USD, INR, and EUR. Two donut charts visualize data distribution, while a world map colored green and red signifies global market trends or segmentation. Ideal for business presentations, financial reports, economic analysis, and investment-related content, these versatile graphics convey complex data clearly and concisely.
Free with trial A close-up view of black financial and business chart icons arranged in a grid on a light background. Decrease dollar illustrations Close-up of financial and business chart icons on a grid finance charts. A close-up view of black financial and business chart icons arranged in a grid on a light background
Free with trial A collection of minimalist glyph style icons representing various aspects of the economy, business challenges, and financial crisis situations. These icons are designed for use in presentations, websites, and other visual materials related to finance and business. Decrease dollar vectors Minimalist Glyph Style Economy and Business Crisis Symbol Icon Collection. A collection of minimalist glyph style icons representing various aspects of the economy, business challenges, and financial crisis situations. These icons are designed for use in presentations, websites, and other visual materials related to finance and business.
Free with trial Collection of business growth and financial analysis icons featuring bar charts and arrows with editable line art and flat shape style. Editable vector icon set. Decrease dollar vectors Collection of business growth and financial analysis icons featuring bar charts and arrows with editable line art and flat shape
Free with trial This vector illustration shows a set of money bags coins cash and arrows representing finance and business concepts in a simple black style calm professional. Generative AI. Decrease dollar vectors Money bag coin stack cash arrow finance business currency icon set vector illustration. This vector illustration shows a set of money bags coins cash and arrows representing finance and business concepts in a simple black style calm professional. Generative AI
Free with trial Set line Falling property prices, Shutdown of factory, Drop crude oil and Global economic crisis news icon. Vector. Decrease dollar illustrations Set line Falling property prices, Shutdown of factory, Drop crude oil and Global economic crisis news icon. Vector
Free with trial A woman is working on a laptop analyzing a digital graph that shows cost reduction for a successful business model She is using a pen to focus on the downward trend highlighting the strategy and financial planning for efficiency and growth This highlights digital transformation for effective business analysis and future cost management. Decrease dollar illustrations Cost Reduction Strategy Digital Transformation Business Analysis and Financial Planning for Success. A woman is working on a laptop analyzing a digital graph that shows cost reduction for a successful business model She is using a pen to focus on the downward trend highlighting the strategy and financial planning for efficiency and growth This highlights digital transformation for effective business analysis and future cost management
Free with trial Illustration of a business activities. Decrease dollar vectors Illustration of a business activities
Free with trial Illustration of a business activities. Decrease dollar vectors Illustration of a business activities
Free with trial Illustration of a business activities. Decrease dollar vectors Illustration of a business activities
Free with trial Illustration of a business activities. Decrease dollar vectors Illustration of a business activities
Free with trial Illustration of a business activities. Decrease dollar vectors Illustration of a business activities
Free with trial Illustration of a business activities. Decrease dollar vectors Illustration of a business activities
Free with trial Illustration of a business activities. Decrease dollar vectors Illustration of a business activities
Free with trial Set line Shutdown of factory, Bank building, Global economic crisis news and Stop delivery cargo truck icon. Vector. Decrease dollar illustrations Set line Shutdown of factory, Bank building, Global economic crisis news and Stop delivery cargo truck icon. Vector
Free with trial Financial crisis concept. Broken piggy bank and declining chart, loss of money vector concept, bankruptcy, onset of poverty, budget recession, market fall. Bad economy and lower investment costs. Decrease dollar vectors Financial crisis concept. Broken piggy bank and declining chart, loss of money vector concept, bankruptcy, onset of
Free with trial A conceptual illustration of market analysis featuring a bar chart, magnifying glass, upward and downward arrows, and business icons on white. Decrease dollar illustrations Market Analysis Concept with Bar Chart Magnifying Glass and Upward Arrow graph. A conceptual illustration of market analysis featuring a bar chart, magnifying glass, upward and downward arrows, and business icons on white
Free with trial Modern Finance Icon set Clean Line Style on white background, Created AI. Decrease dollar vectors Modern Finance Icons Clean Line Style, Upbeat Financial Mood. Modern Finance Icon set Clean Line Style on white background, Created AI
Free with trial 3D bar chart with red arrows pointing upwards, reflecting off a shiny, blue surface. The clean, minimalist design symbolizes financial growth, business success, and positive market trends. Ideal for use in presentations, financial reports, and marketing materials related to investment, stock market, and economic progress. Decrease dollar illustrations Financial Growth 3D Bar Chart with Red Arrows. 3D bar chart with red arrows pointing upwards, reflecting off a shiny, blue surface. The clean, minimalist design symbolizes financial growth, business success, and positive market trends. Ideal for use in presentations, financial reports, and marketing materials related to investment, stock market, and economic progress
Free with trial 3D bar chart with red arrows pointing upwards, reflecting off a shiny, blue surface. The clean, minimalist design symbolizes financial growth, business success, and positive market trends. Ideal for use in presentations, financial reports, and marketing materials related to investment, stock market, and economic progress. Decrease dollar illustrations Financial Growth 3D Bar Chart with Red Arrows. 3D bar chart with red arrows pointing upwards, reflecting off a shiny, blue surface. The clean, minimalist design symbolizes financial growth, business success, and positive market trends. Ideal for use in presentations, financial reports, and marketing materials related to investment, stock market, and economic progress
Free with trial 3D bar chart with red arrows pointing upwards, reflecting off a shiny, blue surface. The clean, minimalist design symbolizes financial growth, business success, and positive market trends. Ideal for use in presentations, financial reports, and marketing materials related to investment, stock market, and economic progress. Decrease dollar illustrations Financial Growth 3D Bar Chart with Red Arrows. 3D bar chart with red arrows pointing upwards, reflecting off a shiny, blue surface. The clean, minimalist design symbolizes financial growth, business success, and positive market trends. Ideal for use in presentations, financial reports, and marketing materials related to investment, stock market, and economic progress
Free with trial An illustration depicts the concepts of inflation and deflation with contrasting visual elements. The left side showcases a chaotic arrangement of currency and objects, representing inflation. Conversely, the right presents a structured, geometric composition associated with deflation. The design utilizes vibrant colors and a central arrow, symbolizing economic shifts, suitable for commercial and. Decrease dollar illustrations Inflation versus deflation economic concepts illustrated with currency and shapes. An illustration depicts the concepts of inflation and deflation with contrasting visual elements. The left side showcases a chaotic arrangement of currency and objects, representing inflation. Conversely, the right presents a structured, geometric composition associated with deflation. The design utilizes vibrant colors and a central arrow, symbolizing economic shifts, suitable for commercial and
Free with trial Money Transfer Icons Set, Currency Exchange Logo, Crypto Financial Services. Vector illustration. Decrease dollar vectors Money Transfer Icons Set, Currency Exchange Logo, Crypto Financial Services. Vector
Free with trial Illustration shows a stressed businessman with falling arrows and a sad face beside coins and a happy businessman with rising arrows and graphs. Positive financial mood. Generative AI. Decrease dollar vectors Businessman stressed and happy financial growth comparison vector illustration with coins and charts. Illustration shows a stressed businessman with falling arrows and a sad face beside coins and a happy businessman with rising arrows and graphs. Positive financial mood. Generative AI
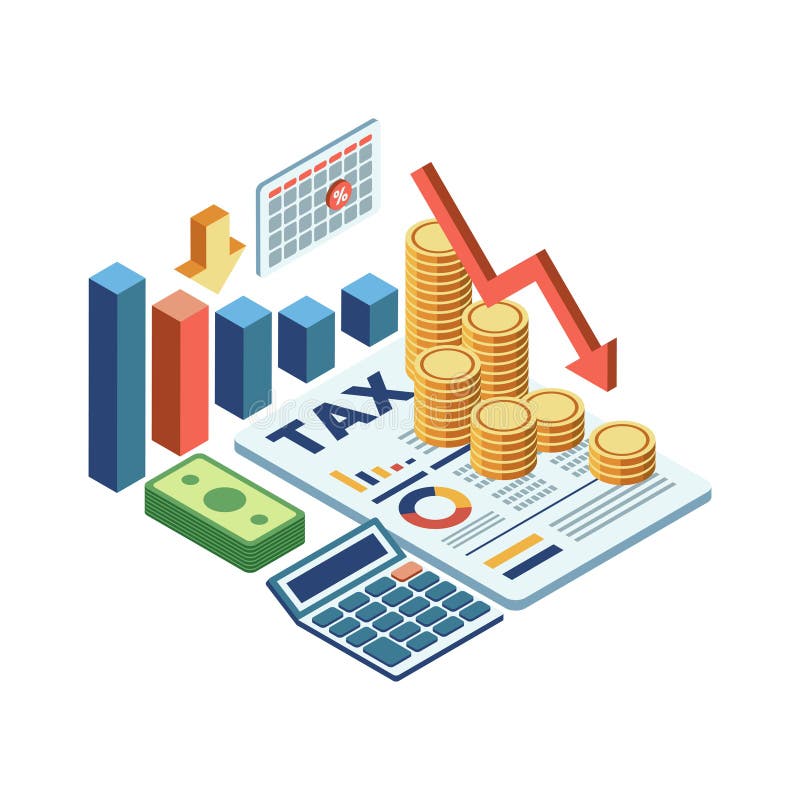
Free with trial Isometric Tax Deduction Concept with Financial Elements. Tax Deduction and Financial Management Concept. Decrease dollar vectors Isometric Tax Deduction Concept with Financial Elements
Free with trial An abstract 3D illustration shows intertwined upward and downward arrows with stacks of coins, symbolizing financial fluctuations and market trends. Decrease dollar illustrations Abstract 3D visualization of upward and downward arrows intertwined with stacks of coins. An abstract 3D illustration shows intertwined upward and downward arrows with stacks of coins, symbolizing financial fluctuations and market trends
Free with trial A comprehensive set of line icons illustrating various e-commerce, retail, and shopping concepts, including payment, discounts, returns, and logistics. Rendered by Ai, this collection provides essential visual tools for web and app interfaces related to buying and selling. Decrease dollar illustrations E-commerce and Shopping Cart Icon Set. A comprehensive set of line icons illustrating various e-commerce, retail, and shopping concepts, including payment, discounts, returns, and logistics. Rendered by Ai, this collection provides essential visual tools for web and app interfaces related to buying and selling
Free with trial Money growth and fall on chart graph with arrow up and down, financial business invest. Vector flat illustration. Decrease dollar vectors Money growth and fall on chart graph with arrow up and down, financial business invest. Vector illustration
Free with trial Money loan interest rate hand drawn doodle icons set collection in flat style. Payment benefit vector illustration on isolated background. Discount sign business concept. Decrease dollar vectors Money loan interest rate hand drawn doodle icons set collection in flat style. Payment benefit vector illustration on isolated
Free with trial Money loan interest rate hand drawn doodle icons set collection in flat style. Payment benefit vector illustration on isolated background. Discount sign business concept. Decrease dollar vectors Money loan interest rate hand drawn doodle icons set collection in flat style. Payment benefit vector illustration on isolated
Free with trial This image showcases a collection of finance and government icons, generated by AI, perfect for use in presentations, reports, or websites related to business, economics, or politics. The stylized monochrome design provides a professional and consistent aesthetic. Decrease dollar illustrations Finance and Government Icons
Free with trial Dramatic red arrow shows oil price drop due to an embargo effect on charts and oil barrels Perfect for financial news and global trade articles. Decrease dollar illustrations Illustration of an oil embargo against a backdrop of declining market graphs. Dramatic red arrow shows oil price drop due to an embargo effect on charts and oil barrels Perfect for financial news and global trade articles
Free with trial This illustration features a collection of five distinct icons representing various financial concepts. From left to right, it shows a Bitcoin symbol with an upward trending graph, an envelope overflowing with cash, a hand holding a gold coin, a calculator with a downward arrow and stacked coins labeled 'Cost Management', and a magnifying glass over a market analysis graph. The icons are stylized with a clean, flat design and vibrant colors, making them ideal for presentations, infographics, and financial content. Decrease dollar vectors Financial Concepts Icons: Bitcoin Growth, Cash Envelope, Investment, Cost Management, Market Analysis. This illustration features a collection of five distinct icons representing various financial concepts. From left to right, it shows a Bitcoin symbol with an upward trending graph, an envelope overflowing with cash, a hand holding a gold coin, a calculator with a downward arrow and stacked coins labeled 'Cost Management', and a magnifying glass over a market analysis graph. The icons are stylized with a clean, flat design and vibrant colors, making them ideal for presentations, infographics, and financial content.
Free with trial Red arrow pointing down and crashing stock market chart representing financial crisis, recession and economic downturn. Decrease dollar illustrations Market crash showing economic downturn with falling chart and percentage symbol. Red arrow pointing down and crashing stock market chart representing financial crisis, recession and economic downturn
Free with trial Cost reduction icon price lower arrow. Vector low cost money crisis line icon. Decrease dollar vectors Cost reduction icon price lower arrow. Vector low cost money crisis line icon
Free with trial Rate showing extensive set of dark gray illustrating financial graphs charts and data analysis symbols keywords: financial, graphs, charts, data. Decrease dollar illustrations Extensive Set of Dark Gray Illustrating Financial Graphs Charts and Data Analysis Symbols Keywords: financial
Free with trial Set Bank building Mobile stock trading Money bag Credit card Contract money and pen Global economic crisis and Employee dismissal icon. Vector. Decrease dollar vectors Set Bank building, Mobile stock trading, Money bag, Credit card, Contract money and pen, Global economic crisis and. Set Bank building Mobile stock trading Money bag Credit card Contract money and pen Global economic crisis and Employee dismissal icon. Vector.
Free with trial Illustration of a hand holding a magnifying glass over a financial chart showing business growth and success. The image represents data analysis, investment strategy, and market trends in a visually appealing way. Decrease dollar illustrations Business Growth Analysis Magnifying Glass on Financial Chart. Illustration of a hand holding a magnifying glass over a financial chart showing business growth and success. The image represents data analysis, investment strategy, and market trends in a visually appealing way.
Free with trial Conceptual image representing financial growth and investment. The scene features a golden percentage coin, stacks of coins, and a money bag against a backdrop of financial charts and graphs. The composition suggests themes of investment opportunities, interest rates, and economic prosperity. Suitable for illustrating financial articles, investment strategies, and economic forecasts. Decrease dollar illustrations Financial Growth and Investment Concept. Conceptual image representing financial growth and investment. The scene features a golden percentage coin, stacks of coins, and a money bag against a backdrop of financial charts and graphs. The composition suggests themes of investment opportunities, interest rates, and economic prosperity. Suitable for illustrating financial articles, investment strategies, and economic forecasts.
Free with trial White isometric icons representing various financial concepts, including money, transactions, and data management, are depicted against a black background. These clean, modern icons are ideal for financial applications, websites, or presentations. Decrease dollar illustrations Isometric Finance Icons. White isometric icons representing various financial concepts, including money, transactions, and data management, are depicted against a black background. These clean, modern icons are ideal for financial applications, websites, or presentations.
Free with trial A red $10 price tag sticker displays a promotional offer. This image is perfect for retail sales and discounted product pricing, indicating a special deal for consumers CREATED AI. Decrease dollar illustrations Red $10 Price Tag Sticker Displaying Promotional Offer for Retail Sales and Discounted Product Pricing. A red $10 price tag sticker displays a promotional offer. This image is perfect for retail sales and discounted product pricing, indicating a special deal for consumers CREATED AI
Free with trial A collection of black and white icons representing financial concepts such as growth charts, decline arrows, and money symbols, all presented clearly on a plain white background for easy integration i. Decrease dollar vectors Financial growth and decline icons isolated on transparent background. A collection of black and white icons representing financial concepts such as growth charts, decline arrows, and money symbols, all presented clearly on a plain white background for easy integration i
Free with trial A vibrant illustration depicting financial challenges, including a broken piggy bank, money stacks, a declining graph, and a safe, symbolizing financial literacy and banking. Decrease dollar vectors Financial Challenges and Solutions Illustration. A vibrant illustration depicting financial challenges, including a broken piggy bank, money stacks, a declining graph, and a safe, symbolizing financial literacy and banking.
Free with trial Illustration of a depressed stickman holding a financial report, with a downward currency sign in a thought bubble. Symbolizes economic downturn or financial loss. Perfect for illustrating business. Decrease dollar illustrations Depressed Stickman Character Holds a Financial Report with Downward Dollar Sign Thought Bubble Illustration. Illustration of a depressed stickman holding a financial report, with a downward currency sign in a thought bubble. Symbolizes economic downturn or financial loss. Perfect for illustrating business