Free with trial Hand drawn bar chart set featuring growth and decline arrows for business analytics. AI generated. Decrease finance vectors Hand drawn bar chart set featuring growth and decline arrows for business analytics. AI generated
Free with trial The image displays a bold, three-dimensional percentage symbol in a gradient of colors transitioning from pink to purple on the left diagonal bar and from blue to green on the right zero. The symbol is set against a plain white background, giving it a modern and eye-catching appearance. Decrease finance illustrations A vibrant 3d percentage symbol with gradient colors against a plain background. The image displays a bold, three-dimensional percentage symbol in a gradient of. The image displays a bold, three-dimensional percentage symbol in a gradient of colors transitioning from pink to purple on the left diagonal bar and from blue to green on the right zero. The symbol is set against a plain white background, giving it a modern and eye-catching appearance
Free with trial The image shows a descending stack of three gold-colored coins, each smaller than the one below it, with a red downward-pointing arrow cutting through them. This visual metaphor suggests a decline in value, savings, or financial loss over time. Decrease finance vectors Decreasing stack of gold coins with downward arrow indicating financial loss. The image shows a descending stack of three gold-colored coins, each smaller than. The image shows a descending stack of three gold-colored coins, each smaller than the one below it, with a red downward-pointing arrow cutting through them. This visual metaphor suggests a decline in value, savings, or financial loss over time
Free with trial The image shows a collection of silver coins scattered on a surface, with a graph of fluctuating values in the background. The graph lines are in blue and red, indicating possible trends in the value of the coins over time. Decrease finance illustrations A collection of silver coins with a graph of fluctuating values in the background. The image shows a collection of silver coins scattered on a surface, with a. The image shows a collection of silver coins scattered on a surface, with a graph of fluctuating values in the background. The graph lines are in blue and red, indicating possible trends in the value of the coins over time
Free with trial Vector cartoon 3d percent up and down icon set. Cute realistic growth, downward percentage red, green sign with arrow. Minimal 3d render rate symbol collection for loyalty, discount, banking app. Decrease finance vectors Vector cartoon 3d percent up and down icon set. Cute realistic growth, downward percentage red, green sign with arrow. Minimal 3d render rate symbol collection
Free with trial Featuring four vibrant business charts illustrating increasing, decreasing, fluctuating, and peaking trends, perfect for enhancing presentations and reports with clear visual data analysis. Decrease finance vectors Featuring four vibrant business charts illustrating increasing, decreasing, fluctuating, and peaking trends, perfect for. Enhancing presentations and reports. Featuring four vibrant business charts illustrating increasing, decreasing, fluctuating, and peaking trends, perfect for enhancing presentations and reports with clear visual data analysis
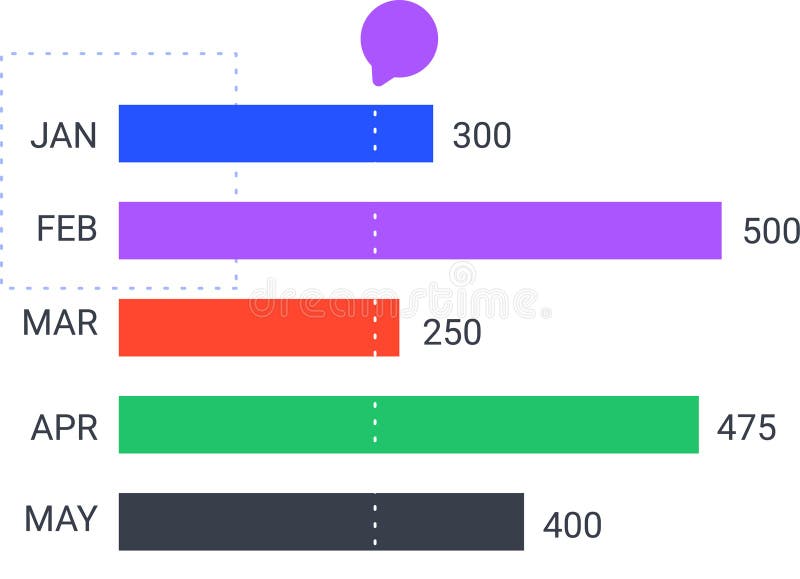
Free with trial Colorful horizontal bar chart is displaying monthly statistics from january to may, indicating trends and performance. With a speech bubble above. Decrease finance vectors Colorful horizontal bar chart is displaying monthly statistics from january to may, indicating trends and performance. With a speech bubble above
Free with trial Colorful horizontal bar chart is displaying monthly statistics from january to may, indicating trends and performance. With a speech bubble above. Decrease finance vectors Colorful horizontal bar chart is displaying monthly statistics from january to may, indicating trends and performance. With a speech bubble above
Free with trial Featuring four vibrant business charts illustrating increasing, decreasing, fluctuating, and peaking trends, perfect for enhancing presentations and reports with clear visual data analysis. Decrease finance illustrations Featuring four vibrant business charts illustrating increasing, decreasing, fluctuating, and peaking trends, perfect for. Enhancing presentations and reports. Featuring four vibrant business charts illustrating increasing, decreasing, fluctuating, and peaking trends, perfect for enhancing presentations and reports with clear visual data analysis
Free with trial Hands Typing on Laptop with Financial Graph and Target Icon Representing Business Cost Analysis and Strategy Development for Managerial Decision-Making. Glyphic. Decrease finance illustrations Hands Typing on Laptop with Financial Graph and Target Icon Representing Business Cost Analysis and Strategy Development. For Managerial Decision-Making
Free with trial A logo for a data visualization service, a simple chart bar forming a sharp, singular peak, vector graphic design on a white background, simple minimalistic style, flat color, sunflower yellow color palette, vector graphics, vector illustration, logo, professional logo, logo design, high-quality graphic designer work, logo icon --chaos 30 --ar 16:9 --v 7 Job ID: a54fbe77-4416-47fc-b767-. Decrease finance illustrations Yellow Waveform Graph on White Background, Representing Data, Analytics, or Sound. A logo for a data visualization service, a simple chart bar forming a sharp. a logo for a data visualization service, a simple chart bar forming a sharp, singular peak, vector graphic design on a white background, simple minimalistic style, flat color, sunflower yellow color palette, vector graphics, vector illustration, logo, professional logo, logo design, high-quality graphic designer work, logo icon --chaos 30 --ar 16:9 --v 7 Job ID: a54fbe77-4416-47fc-b767-
Free with trial The image depicts a 3D bar chart with blue steps increasing in height, representing growth or progress. A red arrow curves upward on the left side, symbolizing an upward trend or improvement, while a red arrow curves downward on the right side, indicating a decline or negative trend. This visual contrast highlights the duality of progress and setbacks. Decrease finance illustrations Graphic showing contrasting upward and downward trends in a step-based chart. The image depicts a 3D bar chart with blue steps increasing in height, representing. The image depicts a 3D bar chart with blue steps increasing in height, representing growth or progress. A red arrow curves upward on the left side, symbolizing an upward trend or improvement, while a red arrow curves downward on the right side, indicating a decline or negative trend. This visual contrast highlights the duality of progress and setbacks
Free with trial Negative red down arrows illustration turn loss, drop slump, dip uction negative red down arrows. Decrease finance illustrations Negative red down arrows. Illustration turn loss, drop slump, dip uction AI generated. negative red down arrows illustration turn loss, drop slump, dip uction negative red down arrows
Free with trial Graphic bar chart illustrating business data analysis, financial statistics, and market trends with both positive growth and negative decline on a clean white background. Decrease finance vectors Business financial graph showing increase and decrease. Graphic bar chart illustrating business data analysis, financial statistics, and market trends with both. Graphic bar chart illustrating business data analysis, financial statistics, and market trends with both positive growth and negative decline on a clean white background
Free with trial A bold red arrow curves downwards, indicating a trend or direction. This clean graphic is isolated on a bright surface, perfect for illustrating decline or movement. Decrease finance illustrations Red arrow pointing down on. A bold red arrow curves downwards, indicating a trend or direction. This clean graphic is isolated on a bright surface, perfect for. A bold red arrow curves downwards, indicating a trend or direction. This clean graphic is isolated on a bright surface, perfect for illustrating decline or movement
Free with trial A black and white illustration features a thermometer, a warning triangle with an exclamation mark, a percentage symbol, and a downward trending arrow. Decrease finance vectors Warning Sign with Thermometer, Percentage Symbol, and Downward Arrow danger alert. A black and white illustration features a thermometer, a warning triangle with. A black and white illustration features a thermometer, a warning triangle with an exclamation mark, a percentage symbol, and a downward trending arrow
Free with trial 3d bar chart illustrating percentage growth and decline. A 3D bar chart with two red bars and one taller green bar, topped by a percentage symbol in a circle. Decrease finance illustrations 3d bar chart illustrating percentage growth and decline. A 3D bar chart with two red bars and one taller green bar, topped by a percentage symbol in a circle
Free with trial A visual creation that highlights a balanced composition with interesting details and style, presenting a harmonious and aesthetic blend of elements, suitable for various creative purposes. Decrease finance vectors Colorful vector icons depicting growth, flow, and transition. A visual creation that highlights a balanced composition with interesting details and style. A visual creation that highlights a balanced composition with interesting details and style, presenting a harmonious and aesthetic blend of elements, suitable for various creative purposes.
Free with trial Market crash shopping cart coins falling red downward graph financial crisis concept colorful background website banner. Vector illustration. Decrease finance illustrations Market crash shopping cart coins falling red downward graph financial crisis concept colorful background website banner. Vector illustration
Free with trial A stark red jagged arrow descends diagonally against a solid black background, symbolizing a sharp decline or negative trend. Decrease finance illustrations Red jagged arrow pointing downward on black background. A stark red jagged arrow descends diagonally against a solid black background, symbolizing a sharp. A stark red jagged arrow descends diagonally against a solid black background, symbolizing a sharp decline or negative trend
Free with trial Illustration depicting a financial downturn with a gold coin, dollar signs, and red arrows on a black background using a flat style. Decrease finance vectors Financial Decline Concept Depicted by Red Arrows and Gold Coin with Dollar Sign. Illustration depicting a financial downturn with a gold coin, dollar signs, and. Illustration depicting a financial downturn with a gold coin, dollar signs, and red arrows on a black background using a flat style.
Free with trial Abstract Black Bar Chart with Data Points and Trend Line Icon. Decrease finance vectors A minimalist black and white icon representing a bar chart with data points and a connected line indicating a trend, suitable for. Abstract Black Bar Chart with. Abstract Black Bar Chart with Data Points and Trend Line Icon
Free with trial 3D bar chart with red arrows pointing upwards, reflecting off a shiny, blue surface. The clean, minimalist design symbolizes financial growth, business success, and positive market trends. Ideal for use in presentations, financial reports, and marketing materials related to investment, stock market, and economic progress. Decrease finance illustrations Financial Growth 3D Bar Chart with Red Arrows. 3D bar chart with red arrows pointing upwards, reflecting off a shiny, blue surface. The clean, minimalist design. 3D bar chart with red arrows pointing upwards, reflecting off a shiny, blue surface. The clean, minimalist design symbolizes financial growth, business success, and positive market trends. Ideal for use in presentations, financial reports, and marketing materials related to investment, stock market, and economic progress
Free with trial 3D bar chart with red arrows pointing upwards, reflecting off a shiny, blue surface. The clean, minimalist design symbolizes financial growth, business success, and positive market trends. Ideal for use in presentations, financial reports, and marketing materials related to investment, stock market, and economic progress. Decrease finance illustrations Financial Growth 3D Bar Chart with Red Arrows. 3D bar chart with red arrows pointing upwards, reflecting off a shiny, blue surface. The clean, minimalist design. 3D bar chart with red arrows pointing upwards, reflecting off a shiny, blue surface. The clean, minimalist design symbolizes financial growth, business success, and positive market trends. Ideal for use in presentations, financial reports, and marketing materials related to investment, stock market, and economic progress
Free with trial 3D bar chart with red arrows pointing upwards, reflecting off a shiny, blue surface. The clean, minimalist design symbolizes financial growth, business success, and positive market trends. Ideal for use in presentations, financial reports, and marketing materials related to investment, stock market, and economic progress. Decrease finance illustrations Financial Growth 3D Bar Chart with Red Arrows. 3D bar chart with red arrows pointing upwards, reflecting off a shiny, blue surface. The clean, minimalist design. 3D bar chart with red arrows pointing upwards, reflecting off a shiny, blue surface. The clean, minimalist design symbolizes financial growth, business success, and positive market trends. Ideal for use in presentations, financial reports, and marketing materials related to investment, stock market, and economic progress
Free with trial A minimalist line icon depicting strategic analysis. Decrease finance illustrations Strategic Analysis Knight, Graph, Magnifying Glass Icon. A minimalist line icon depicting strategic analysis. A minimalist line icon depicting strategic analysis.
Free with trial A bold red zigzag arrow points downwards, symbolizing a sharp decline or loss, isolated on a clean white background. Decrease finance illustrations Red downward zigzag arrow isolated on white background. A bold red zigzag arrow points downwards, symbolizing a sharp decline or loss, isolated on a clean white. A bold red zigzag arrow points downwards, symbolizing a sharp decline or loss, isolated on a clean white background
Free with trial Market Decline And Bearish Trend Concept. Golden Bear Statue Symbolizing Financial Crisis Isolated On White Background. 3d Rendering. Decrease finance illustrations Market Decline And Bearish Trend Concept. Golden Bear Statue Symbolizing Financial Crisis On White Background. 3d Rendering. Market Decline And Bearish Trend. Market Decline And Bearish Trend Concept. Golden Bear Statue Symbolizing Financial Crisis Isolated On White Background. 3d Rendering
Free with trial Market Decline And Bearish Trend Concept. Golden Bear Statue Symbolizing Financial Crisis Isolated On White Background. 3d Rendering. Decrease finance illustrations Market Decline And Bearish Trend Concept. Golden Bear Statue Symbolizing Financial Crisis On White Background. 3d Rendering. Market Decline And Bearish Trend. Market Decline And Bearish Trend Concept. Golden Bear Statue Symbolizing Financial Crisis Isolated On White Background. 3d Rendering
Free with trial A black arrow points downwards towards two horizontal steps on a white background. Decrease finance illustrations Black Arrow Pointing Down Towards Steps Icon on White Background stairs decline. A black arrow points downwards towards two horizontal steps on a white. A black arrow points downwards towards two horizontal steps on a white background
Free with trial A jagged black line graph shows a steep downward trend ending with an arrow. Clear details and vibrant colors. Decrease finance illustrations Jagged black line graph trending downwards with arrow on white background line chart. A jagged black line graph shows a steep downward trend ending with an arrow. A jagged black line graph shows a steep downward trend ending with an arrow. Clear details and vibrant colors
Free with trial Red paper with green arrow up. A close-up of paper cutouts, showing a red background and a declining green arrow. Decrease finance illustrations Red paper with green arrow up. A close-up of paper cutouts, showing a red background and a declining green arrow
Free with trial Outline Line Art Minimalist Decreasing Graph Trend Arrow Chart Business Decline Icon Symbol. Decrease finance illustrations A minimalist outline icon depicting a decreasing graph line with an arrow, symbolizing business decline, financial loss, or a. Outline Line Art Minimalist. Outline Line Art Minimalist Decreasing Graph Trend Arrow Chart Business Decline Icon Symbol
Free with trial A simple blue line graph with circular data points is displayed against a clean white background with subtle horizontal grid lines. The graph shows fluctuations and trends, making it suitable for representing data, analytics, or financial performance. Generated by AI. Decrease finance vectors Blue Line Graph with Data Points on White Background. A simple blue line graph with circular data points is displayed against a clean white background with. A simple blue line graph with circular data points is displayed against a clean white background with subtle horizontal grid lines. The graph shows fluctuations and trends, making it suitable for representing data, analytics, or financial performance. Generated by AI
Free with trial Robotic Hand Pointing at Cost Reduction Concept with Flowchart Elements for Business Strategy and Planning in Modern Digital Environment Quark. Decrease finance illustrations Robotic Hand Pointing at Cost Reduction Concept with Flowchart Elements for Business Strategy and Planning in Modern. Digital Environment Quark
Free with trial Concept of economic crash. With connected icons. Decrease finance illustrations Concept of economic crash. With connected icons
Free with trial Outline Broken Money Bag With Falling Coins And Cash Financial Icon. Decrease finance vectors A minimalist linear icon illustration depicting a broken bag losing money with falling coins and banknote and a downward arrow. Outline Broken Money Bag With. Outline Broken Money Bag With Falling Coins And Cash Financial Icon
Free with trial A bar graph showing a downward trend with blue bars and a red arrow pointing downwards, indicating a decline in value over different categories or time periods. Decrease finance illustrations Declining trend in sales and revenue over time periods indicated by bar graph. A bar graph showing a downward trend with blue bars and a red arrow pointing. A bar graph showing a downward trend with blue bars and a red arrow pointing downwards, indicating a decline in value over different categories or time periods
Free with trial This image depicts a blue sack with a white percentage symbol printed on it, symbolizing financial concepts such as interest rates, profit margins, or percentage-based calculations. The sack is tied at the top, giving it a full appearance. Decrease finance illustrations Blue sack with percentage symbol representing financial gain or interest rate. This image depicts a blue sack with a white percentage symbol printed on it. This image depicts a blue sack with a white percentage symbol printed on it, symbolizing financial concepts such as interest rates, profit margins, or percentage-based calculations. The sack is tied at the top, giving it a full appearance
Free with trial A collection of eight black and white, hand-drawn or doodle style icons. Each square icon features a different line graph, representing data, analytics, statistics, or financial trends. Decrease finance illustrations Set of hand drawn financial chart line graph icons isolated on white. A collection of eight black and white, hand-drawn or doodle style icons. Each square icon. A collection of eight black and white, hand-drawn or doodle style icons. Each square icon features a different line graph, representing data, analytics, statistics, or financial trends
Free with trial Golden Key on Stock Market Candlestick Chart Background, Trading Success Concept. Metallic key floating before digital stock chart with red blue bars. Decrease finance illustrations Golden Key on Stock Market Candlestick Chart Background, Trading Success Concept. Metallic key floating before digital stock chart with red blue bars
Free with trial Concept of inflation. With connected icons. Decrease finance illustrations Concept of inflation. With connected icons
Free with trial Two colorful lines are representing data points over time, creating a visual representation of trends and fluctuations, with a highlighted period marked in red. Decrease finance vectors Two colorful lines are representing data points over time, creating a visual representation of trends and fluctuations. With a highlighted period marked in red
Free with trial Two colorful lines are representing data points over time, creating a visual representation of trends and fluctuations, with a highlighted period marked in red. Decrease finance illustrations Two colorful lines are representing data points over time, creating a visual representation of trends and fluctuations. With a highlighted period marked in red
Free with trial Two businessmen and brokers looking at falling market chart or stock quotes. Financial crisis or depression. Money analysis infographic. Frightened people looking at failure diagram. Vector concept. Decrease finance vectors Two businessmen and brokers looking at falling market chart or stock quotes. Financial depression. analysis infographic. Two businessmen and brokers looking at. Two businessmen and brokers looking at falling market chart or stock quotes. Financial crisis or depression. Money analysis infographic. Frightened people looking at failure diagram. Vector concept
Free with trial Set Global economic crisis, news, and Storm. Business infographic template. Vector. Decrease finance illustrations Set Global economic crisis, news, and Storm. Business infographic template. Vector.
Free with trial The image depicts a set of turquoise bars progressively decreasing in height from left to right, accompanied by a large red downward-pointing arrow, symbolizing a downward trend or decline in data. Decrease finance illustrations Declining trend represented by a series of descending bars and a downward arrow. The image depicts a set of turquoise bars progressively decreasing in height. The image depicts a set of turquoise bars progressively decreasing in height from left to right, accompanied by a large red downward-pointing arrow, symbolizing a downward trend or decline in data
Free with trial A bright red arrow curves downwards against a light background, symbolizing a downward movement. Decrease finance illustrations A vibrant red curved arrow points downwards indicating a decline or negative trend. A bright red arrow curves downwards against a light background, symbolizing a. A bright red arrow curves downwards against a light background, symbolizing a downward movement
Free with trial A striking visual of a bright red neon down arrow graph illustrating a declining trend, surrounded by glowing percentage and dollar symbols against a dark, moody background. Perfect for financial, economic, or business-related concepts. Decrease finance illustrations Red neon down arrow graph with percentage and dollar signs in dark background. A striking visual of a bright red neon down arrow graph illustrating a declining. A striking visual of a bright red neon down arrow graph illustrating a declining trend, surrounded by glowing percentage and dollar symbols against a dark, moody background. Perfect for financial, economic, or business-related concepts
Free with trial The image shows a large green dollar sign with an overlaid red diagonal line indicating a downward trend. Beside it is a bar graph with bars decreasing in height, symbolizing a drop in financial value or economic decline. Decrease finance illustrations Graphic illustrating a decline in financial value with a dollar sign and downward trend line. The image shows a large green dollar sign with an overlaid red. The image shows a large green dollar sign with an overlaid red diagonal line indicating a downward trend. Beside it is a bar graph with bars decreasing in height, symbolizing a drop in financial value or economic decline
Free with trial Reduce costs concept, business and company to keep cost low, cut spending or expense deduction in budget plan, businessman breaking the graph cost. Decrease finance vectors Reduce costs concept. Business and company to keep cost low, cut spending or expense deduction in budget plan, businessman breaking the graph cost
Free with trial 3D Orange Percentage Symbol with Subtle Gradient and Shadow. AI generated. Decrease finance vectors 3D Orange Percentage Symbol with Subtle Gradient and Shadow. AI generated
Free with trial The image depicts two sets of bar graphs with upward and downward arrows, illustrating contrasting financial trends. The left side shows a positive growth trend with increasing green bars and upward arrows, while the right side displays a mix of declining and rising red bars with both downward and upward arrows, indicating volatility or mixed performance in financial metrics. Decrease finance illustrations Contrasting trends in financial growth and decline through bar and arrow graphics. The image depicts two sets of bar graphs with upward and downward arrows. The image depicts two sets of bar graphs with upward and downward arrows, illustrating contrasting financial trends. The left side shows a positive growth trend with increasing green bars and upward arrows, while the right side displays a mix of declining and rising red bars with both downward and upward arrows, indicating volatility or mixed performance in financial metrics
Free with trial A three-dimensional green arrow with a jagged zigzag shape pointing downwards against a white backdrop. Decrease finance vectors Green 3D zigzag arrow pointing down, declining trend symbol, falling growth icon. A three-dimensional green arrow with a jagged zigzag shape pointing downwards. A three-dimensional green arrow with a jagged zigzag shape pointing downwards against a white backdrop
Free with trial Rising coin wealth solid icons. A collection of solid icons depicting coin stacks and growth charts, presented isolated on a clean white background. Decrease finance vectors Rising coin wealth solid icons. A collection of solid icons depicting coin stacks and growth charts, presented isolated on a clean white background
Free with trial Two wooden blocks with green up arrow and red down arrow, symbolizing growth and decline, held by hands. Business concept. Decrease finance illustrations Wooden blocks with up and down arrows, business concept with copy space. Two wooden blocks with green up arrow and red down arrow, symbolizing growth and decline. Two wooden blocks with green up arrow and red down arrow, symbolizing growth and decline, held by hands. Business concept
Free with trial Two wooden blocks held by hands, one with a green up arrow and the other with a red down arrow, symbolizing growth and decline. Decrease finance illustrations Wooden Blocks with Up and Down Arrows, Business Concept with Copy Space. Two wooden blocks held by hands, one with a green up arrow and the other with a red down. Two wooden blocks held by hands, one with a green up arrow and the other with a red down arrow, symbolizing growth and decline
Free with trial Green Circle with White Minus Sign Illustrating Subtraction and Removal Operations. AI generated. Decrease finance illustrations Green Circle with White Minus Sign Illustrating Subtraction and Removal Operations. AI generated
Free with trial A vibrant pink graph line ascends diagonally against a dark background, representing upward growth. The image evokes a sense of dynamic increase. The style is reminiscent of a modern, technological aesthetic. The subtle grid pattern in the background adds depth, created to simulate a data visualizat. Decrease finance illustrations Uptrend. A vibrant pink graph line ascends diagonally against a dark background, representing upward growth. The image evokes a sense of dynamic increase. The. A vibrant pink graph line ascends diagonally against a dark background, representing upward growth. The image evokes a sense of dynamic increase. The style is reminiscent of a modern, technological aesthetic. The subtle grid pattern in the background adds depth, created to simulate a data visualizat
Free with trial Minimalist 3D bar chart with colorful pastel blocks representing data on a clean white background. Decrease finance illustrations Minimalist 3D bar chart with colorful pastel blocks representing data on a clean white background.
Free with trial Digital Transformation in Real Estate: Abstract Concept of Automation with Hands, House Icon, and Declining Percentages Representing Market Changes Sigmoid. Decrease finance illustrations This image illustrates the intersection of technology and real estate, showcasing robotic hands typing on a keyboard. Digital Transformation in Real Estate. Digital Transformation in Real Estate: Abstract Concept of Automation with Hands, House Icon, and Declining Percentages Representing Market Changes Sigmoid
Free with trial A striking 3D percentage symbol rendered in an intricate wireframe or mesh design, showcasing a vibrant rainbow gradient. The colors transition smoothly from cool blues and greens to warm reds and purples, creating a dynamic and modern visual. Set against a clean, pure white background, the symbol casts a subtle shadow, adding depth. This eye-catching graphic is ideal for conveying concepts of discounts, sales, growth, statistics, data analysis, financial progress, or any topic requiring a modern, dynamic, and colorful representation of percentages. Perfect for business, marketing, technology, or educational designs. Decrease finance illustrations Vibrant Rainbow Wireframe Percentage Symbol on White. A striking 3D percentage symbol rendered in an intricate wireframe or mesh design, showcasing a vibrant. A striking 3D percentage symbol rendered in an intricate wireframe or mesh design, showcasing a vibrant rainbow gradient. The colors transition smoothly from cool blues and greens to warm reds and purples, creating a dynamic and modern visual. Set against a clean, pure white background, the symbol casts a subtle shadow, adding depth. This eye-catching graphic is ideal for conveying concepts of discounts, sales, growth, statistics, data analysis, financial progress, or any topic requiring a modern, dynamic, and colorful representation of percentages. Perfect for business, marketing, technology, or educational designs.
Free with trial Solid Black Pie Chart Diagram Representation Icon. Decrease finance vectors A simple, solid black icon representing a pie chart or graph, divided into three distinct segments to visualize proportions or. Solid Black Pie Chart Diagram. Solid Black Pie Chart Diagram Representation Icon
Free with trial Black Simple Bar Chart Graphic Element with Rounded Tops Indicating Growth Trend. Decrease finance vectors A simple black graphic element depicting a bar chart with rounded tops. This visual represents data progression and growth,. Black Simple Bar Chart Graphic. Black Simple Bar Chart Graphic Element with Rounded Tops Indicating Growth Trend
Free with trial Stylized Black Globe With Downward Trend Graph Icon. Decrease finance vectors A simplified black graphic symbol depicting a globe alongside a descending bar chart and an arrow indicating a downward trend. Stylized Black Globe With Downward. Stylized Black Globe With Downward Trend Graph Icon
Free with trial This 3D render visually represents a financial crisis or economic recession. Four stacks of gold coins, decreasing in height from left to right, are depicted. A prominent red arrow, symbolizing a downward trend, points towards the smallest coin stack, emphasizing a significant decline. The clean, minimalist background with a reflective surface enhances the focus on the financial concept. This image is ideal for illustrating concepts like market crash, investment loss, bankruptcy, or economic instability. Decrease finance vectors Financial Downturn: Declining Coin Stacks and Red Arrow. This 3D render visually represents a financial crisis or economic recession. Four stacks of gold coins. This 3D render visually represents a financial crisis or economic recession. Four stacks of gold coins, decreasing in height from left to right, are depicted. A prominent red arrow, symbolizing a downward trend, points towards the smallest coin stack, emphasizing a significant decline. The clean, minimalist background with a reflective surface enhances the focus on the financial concept. This image is ideal for illustrating concepts like market crash, investment loss, bankruptcy, or economic instability.
Free with trial A stylized image depicts a magnifying glass focusing on a declining bar graph being passed from one hand to another. Decrease finance illustrations Declining Market Analysis Magnifying Glass, Graph, Hands. A stylized image depicts a magnifying glass focusing on a declining bar graph being passed from one. A stylized image depicts a magnifying glass focusing on a declining bar graph being passed from one hand to another.
Free with trial A line art icon depicting business performance analysis. Decrease finance illustrations Gear, Chart, Envelope Business Performance Analysis Icon. A line art icon depicting business performance analysis. A line art icon depicting business performance analysis.
Free with trial A professional 3D conceptual visualization of a financial market crash or economic recession, featuring a stack of solid gold bullion bars contrasted by a sharp, descending golden arrow pointing downwards on a clean neutral background. Decrease finance illustrations Financial Market Downturn Concept with Stacked Gold Bullion and Descending Arrow. A professional 3D conceptual visualization of a financial market crash or. A professional 3D conceptual visualization of a financial market crash or economic recession, featuring a stack of solid gold bullion bars contrasted by a sharp, descending golden arrow pointing downwards on a clean neutral background
Free with trial An image showcasing four different graphical representations of financial trends using arrows and lines on grid backgrounds. Decrease finance illustrations Graphical representation of financial trends isolated on transparent background. An image showcasing four different graphical representations of financial trends. An image showcasing four different graphical representations of financial trends using arrows and lines on grid backgrounds
Free with trial Solid Black Glyph Banknote Money Bill with Arrow Down Cash Withdrawal Icon Sign. Decrease finance vectors A solid black glyph icon depicting a paper banknote with a downward arrow representing cash withdrawal, financial payment, or. Solid Black Glyph Banknote Money. Solid Black Glyph Banknote Money Bill with Arrow Down Cash Withdrawal Icon Sign
Free with trial This image features a large golden dollar sign symbol in the center, surrounded by two curved arrows. One arrow is red and points downward, representing financial decline or loss, while the other arrow is green and points upward, symbolizing financial growth or gain. The contrasting colors emphasize the duality of economic trends and investment outcomes. Decrease finance vectors Financial growth and decline represented by colorful arrows and a dollar sign icon. This image features a large golden dollar sign symbol in the center. This image features a large golden dollar sign symbol in the center, surrounded by two curved arrows. One arrow is red and points downward, representing financial decline or loss, while the other arrow is green and points upward, symbolizing financial growth or gain. The contrasting colors emphasize the duality of economic trends and investment outcomes
Free with trial Wallet card and minus sign. Remove payment method. Pixel perfect, editable stroke vector icon. Decrease finance vectors Wallet card and minus sign. Remove payment method. Pixel perfect, editable vector icon. Wallet card and minus sign. Remove payment method. Pixel perfect. Wallet card and minus sign. Remove payment method. Pixel perfect, editable stroke vector icon
Free with trial Outline Document Sheet with Dollar Sign and Down Arrow Financial Cost Reduction Icon. Decrease finance vectors A black outline icon representing a financial document or bill showing a cost reduction with a dollar sign and downward arrow. Outline Document Sheet with Dollar. Outline Document Sheet with Dollar Sign and Down Arrow Financial Cost Reduction Icon
Free with trial A clean and modern vector illustration of a line graph, isolated on a white background. This flat design icon features two distinct lines, one blue and one brown, plotting various data points to show trends and comparisons over time. It's a versatile graphic representing concepts like data analysis, business analytics, financial statistics, market research, and performance tracking. Ideal for use in presentations, infographics, websites, business reports, and marketing materials to visualize progress, growth, or economic fluctuations. Decrease finance vectors Data Analysis Line Graph Icon. A clean and modern vector illustration of a line graph, isolated on a white background. This flat design icon features two. A clean and modern vector illustration of a line graph, isolated on a white background. This flat design icon features two distinct lines, one blue and one brown, plotting various data points to show trends and comparisons over time. It's a versatile graphic representing concepts like data analysis, business analytics, financial statistics, market research, and performance tracking. Ideal for use in presentations, infographics, websites, business reports, and marketing materials to visualize progress, growth, or economic fluctuations.
Free with trial A 3D rendered bar graph composed of six vertical bars arranged in a descending sequence. The bars transition in color from a deep blue at the tallest end to a bright orange at the shortest end, showcasing a gradient of blues, purples, and reds. The graph is set against a clean white background with subtle shading, emphasizing the visual representation of a declining trend. Decrease finance illustrations Decreasing Bar Graph with Gradient Colors on White Background chart statistics. A 3D rendered bar graph composed of six vertical bars arranged in a descending. A 3D rendered bar graph composed of six vertical bars arranged in a descending sequence. The bars transition in color from a deep blue at the tallest end to a bright orange at the shortest end, showcasing a gradient of blues, purples, and reds. The graph is set against a clean white background with subtle shading, emphasizing the visual representation of a declining trend
Free with trial Black bars decreasing in height diagonally on a white background, representing a downward trend or decline. Decrease finance illustrations Black bars decreasing in height diagonally on a white background bar chart graph. Black bars decreasing in height diagonally on a white background, representing. Black bars decreasing in height diagonally on a white background, representing a downward trend or decline
Free with trial Black and white illustration of a market cooling graph with a fan and dollar sign. Decrease finance illustrations Market cooling graph with fan, dollar sign and downward trend on white background. Black and white illustration of a market cooling graph with a fan and dollar. Black and white illustration of a market cooling graph with a fan and dollar sign
Free with trial A man's open palm displays a blue upward arrow labeled "Quality" and a red downward arrow labeled "Cost" against a dark background. Decrease finance illustrations Man\'s hand holding upward quality arrow and downward cost arrow business. A man's open palm displays a blue upward arrow labeled 'Quality' and a red downward. A man's open palm displays a blue upward arrow labeled "Quality" and a red downward arrow labeled "Cost" against a dark background
Free with trial A red 3D percentage symbol is positioned next to a white 3D arrow pointing downwards. Isolated on a transparent background. Decrease finance vectors Red percentage symbol with white down arrow isolated on a transparent background. A red 3D percentage symbol is positioned next to a white 3D arrow pointing. A red 3D percentage symbol is positioned next to a white 3D arrow pointing downwards. Isolated on a transparent background
 Sign in