Free with trial A minimalist line graph depicts a significant downward trend with a sharp, jagged line indicating a decline. Decrease finance illustrations Simple line graph illustrating a sharp downward trend and decline. A minimalist line graph depicts a significant downward trend with a sharp, jagged line. A minimalist line graph depicts a significant downward trend with a sharp, jagged line indicating a decline
Free with trial A hand holds a glowing blue bar graph with a downward trending arrow and the word COST above. Decrease finance illustrations Man holding glowing cost reduction graph with downward arrow chart financial. A hand holds a glowing blue bar graph with a downward trending arrow and the word. A hand holds a glowing blue bar graph with a downward trending arrow and the word COST above
Free with trial A businessman in a suit is interacting with a digital interface, highlighting the balance between increasing quality and decreasing costs. The interface shows 'Quality' with an upward arrow and 'Cost' with a downward arrow, both marked with checkmarks, symbolizing successful optimization. This image represents business strategy, efficiency, and the importance of finding the right balance for success. Decrease finance illustrations Quality vs. Cost Optimization. A businessman in a suit is interacting with a digital interface, highlighting the balance between increasing quality and. A businessman in a suit is interacting with a digital interface, highlighting the balance between increasing quality and decreasing costs. The interface shows 'Quality' with an upward arrow and 'Cost' with a downward arrow, both marked with checkmarks, symbolizing successful optimization. This image represents business strategy, efficiency, and the importance of finding the right balance for success.
Free with trial Euro currency down and up icon. Rise and fall European economy sign symbol. Vector. Decrease finance vectors Euro currency down and up icon. Rise and fall European economy sign symbol. Vector
Free with trial A modern, clean isometric illustration showcasing various data visualizations. Multiple charts and graphs, including bar charts, line graphs, and pie charts, are displayed on floating screens, representing data analysis, business intelligence, or financial reporting. Ideal for presentations, reports, or website banners related to data-driven concepts. Decrease finance illustrations Isometric 3D Data Visualization: Charts and Graphs on Floating Screens. A modern, clean isometric illustration showcasing various data visualizations. Multiple. A modern, clean isometric illustration showcasing various data visualizations. Multiple charts and graphs, including bar charts, line graphs, and pie charts, are displayed on floating screens, representing data analysis, business intelligence, or financial reporting. Ideal for presentations, reports, or website banners related to data-driven concepts.
Free with trial A 3D rendered golden bar chart displays a clear downward trend. The bars are arranged from tallest on the left to shortest on the right, creating a visual representation of a decreasing value or performance. The metallic gold finish gives the chart a sense of importance and financial significance. The object is isolated on a clean white background. Decrease finance illustrations Golden Bar Chart Showing a Downward Trend on a White Background graph metallic. A 3D rendered golden bar chart displays a clear downward trend. The bars are. A 3D rendered golden bar chart displays a clear downward trend. The bars are arranged from tallest on the left to shortest on the right, creating a visual representation of a decreasing value or performance. The metallic gold finish gives the chart a sense of importance and financial significance. The object is isolated on a clean white background
Free with trial Two glossy red arrows point upwards and downwards. This image represents concepts of change, direction, choice, and decision-making in various contexts. Useful for financial charts or conceptual graphics. Decrease finance illustrations Red up and down arrows symbolizing progress growth decline choice direction and decision making. Two glossy red arrows point upwards and downwards. This image. Two glossy red arrows point upwards and downwards. This image represents concepts of change, direction, choice, and decision-making in various contexts. Useful for financial charts or conceptual graphics
Free with trial Illustration of stock market losses. Bankrupt financial information concept with arrows pointing down. Stock market correction concept. Descending trading graph. Decrease finance vectors Illustration of stock market losses. Bankrupt financial information concept with arrows pointing down. Stock market correction. Concept. Descending trading
Free with trial A simple line icon illustration of an arrow pointing down to a coin with a dollar sign on it. Represents money deposit, investment, or savings. Decrease finance vectors Simple Line Arrow Coin Dollar Currency Icon. A simple line icon illustration of an arrow pointing down to a coin with a dollar sign on it. Represents money. A simple line icon illustration of an arrow pointing down to a coin with a dollar sign on it. Represents money deposit, investment, or savings.
Free with trial A hand removes coins from stacks, mirroring a downward trending graph generated by AI. The image visually represents economic decline, financial loss, or decreasing market value. The stacks of coins symbolize assets, dwindling in line with the graph's trajectory. Decrease finance illustrations Declining Investments: AI-Generated Visualization. A hand removes coins from stacks, mirroring a downward trending graph generated by AI. The image visually. A hand removes coins from stacks, mirroring a downward trending graph generated by AI. The image visually represents economic decline, financial loss, or decreasing market value. The stacks of coins symbolize assets, dwindling in line with the graph's trajectory.
Free with trial Graph up and down icon vector in circular line. Outline bar chart with arrow symbol. Analytics concept. Decrease finance vectors Graph up and down icon in circular line. Outline bar chart with arrow symbol. Analytics concept. Graph up and down icon vector in circular line. Outline bar. Graph up and down icon vector in circular line. Outline bar chart with arrow symbol. Analytics concept
Free with trial Red percent symbol on wooden floor representing sales, discounts, interest rates, and financial savings concept. Decrease finance illustrations Red 3D percent symbol standing on a light wooden surface with a blurred bright room background, showing monetary concepts. Red percent symbol on wooden floor. Red percent symbol on wooden floor representing sales, discounts, interest rates, and financial savings concept
Free with trial Five stacks of shiny gold coins are arranged in a descending order of height on a white background. Each coin is depicted with a ribbed edge and a smooth, reflective surface. The arrangement visually represents a financial trend, such as a decrease in value or a decline in savings. Decrease finance illustrations Stacks of Gold Coins Decreasing in Height on a White Background. Five stacks of shiny gold coins are arranged in a descending order of height on a white. Five stacks of shiny gold coins are arranged in a descending order of height on a white background. Each coin is depicted with a ribbed edge and a smooth, reflective surface. The arrangement visually represents a financial trend, such as a decrease in value or a decline in savings
Free with trial Financial chart shows falling market data with red and green candlesticks against a dark background, creating a dramatic effect suitable for investment and economic themed visuals. Decrease finance illustrations Dramatic Financial Chart with Green and Red Candlesticks on Black Background. Financial chart shows falling market data with red and green candlesticks against a. Financial chart shows falling market data with red and green candlesticks against a dark background, creating a dramatic effect suitable for investment and economic themed visuals
Free with trial A 3D render of a percentage symbol made of transparent glass with two clear water droplets positioned as the two circles of the symbol. The symbol is set against a clean white background with subtle lighting. Decrease finance illustrations Transparent Glass Percentage Symbol With Water Droplets On White Background sign discount. A 3D render of a percentage symbol made of transparent glass with two. A 3D render of a percentage symbol made of transparent glass with two clear water droplets positioned as the two circles of the symbol. The symbol is set against a clean white background with subtle lighting
Free with trial A hand presents a glowing graph illustrating cost reduction. the downward arrow and shrinking bars emphasize decreasing expenses. a visual representation of financial efficiency and savings, ideal for business. Decrease finance illustrations Representation of cost reduction shown above a hand with a downward trending bar graph and arrow. A hand presents a glowing graph illustrating cost reduction. a hand presents a glowing graph illustrating cost reduction. the downward arrow and shrinking bars emphasize decreasing expenses. a visual representation of financial efficiency and savings, ideal for business.
Free with trial Business Meeting on Real Estate Market Analysis with Charts, Graphs, and Digital House Icon Showing Trends in Property Value Changes Sigmoid. Decrease finance illustrations Professionals discuss real estate market trends using data and analytics. A digital house icon symbolizes value changes. Business Meeting on Real Estate Market. Business Meeting on Real Estate Market Analysis with Charts, Graphs, and Digital House Icon Showing Trends in Property Value Changes Sigmoid
Free with trial The image features a red rubber stamp with the word 'INFLATION' prominently displayed. The stamp appears to have been used, as evidenced by the ink smudges and splatters around it. The background is a light beige color, providing a stark contrast to the bold red of the stamp. The overall impression is one of urgency or importance regarding the concept of inflation. Decrease finance illustrations Red stamp marking inflation. The image features a red rubber stamp with the word 'INFLATION' prominently displayed. The stamp appears to have been used, as. The image features a red rubber stamp with the word 'INFLATION' prominently displayed. The stamp appears to have been used, as evidenced by the ink smudges and splatters around it. The background is a light beige color, providing a stark contrast to the bold red of the stamp. The overall impression is one of urgency or importance regarding the concept of inflation
Free with trial Orange percentage symbol icon. A clean, bold orange percentage symbol icon with a modern and minimalist design, perfect for business and financial presentations. Decrease finance illustrations Orange percentage symbol icon. A clean, bold orange percentage symbol icon with a modern and minimalist design, perfect for business and financial presentations
Free with trial A simple black and white showing a downward trend with three bars and a sharp arrow pointing downwards, representing decline or reduction. Decrease finance illustrations Declining bar and arrow chart. A simple black and white showing a downward trend with three bars and a sharp arrow pointing downwards, representing decline or. A simple black and white showing a downward trend with three bars and a sharp arrow pointing downwards, representing decline or reduction
Free with trial Black and white line drawing showing a decline in sales data inside an email envelope being examined with a magnifying. Decrease finance illustrations Email Marketing Analysis Declining Sales Under Magnifying Glass. Black and white line drawing showing a decline in sales data inside an email envelope being. Black and white line drawing showing a decline in sales data inside an email envelope being examined with a magnifying.
Free with trial A digital screen displays a stark red line graph showing a significant downward trend. The graph is set against a grid background, emphasizing the sharp decline. The image conveys a sense of financial loss, economic downturn, or negative performance. Generated by AI. Decrease finance illustrations Digital screen displaying a sharp downward trending red line graph. A digital screen displays a stark red line graph showing a significant downward trend. The. A digital screen displays a stark red line graph showing a significant downward trend. The graph is set against a grid background, emphasizing the sharp decline. The image conveys a sense of financial loss, economic downturn, or negative performance. Generated by AI.
Free with trial Professional business man holding pie chart showing negative trend with loss. Economic crisis, recession, market crash, financial planning. Decrease finance illustrations Business man holding pie chart showing negative trend with loss. Professional business man holding pie chart showing negative trend with loss. Economic crisis. Professional business man holding pie chart showing negative trend with loss. Economic crisis, recession, market crash, financial planning
Free with trial A minimalist bar chart graphic showcasing fluctuating data points. This visual element is perfect for representing financial growth, performance metrics, or statistical analysis in various applications. Decrease finance illustrations Simple bar chart icon representing data growth and analysis trends. A minimalist bar chart graphic showcasing fluctuating data points. This visual element is. A minimalist bar chart graphic showcasing fluctuating data points. This visual element is perfect for representing financial growth, performance metrics, or statistical analysis in various applications
Free with trial Stacks of coins diminish, mirroring a falling stock market chart against a world map backdrop, symbolizing global economic decline and financial loss. Decrease finance illustrations Global Economic Downturn: Coin Stacks Decline with Bearish Stock Chart. Stacks of coins diminish, mirroring a falling stock market chart against a world map. Stacks of coins diminish, mirroring a falling stock market chart against a world map backdrop, symbolizing global economic decline and financial loss
Free with trial A visual representation of financial decline. Stacks of coins are overlaid with a red downtrend graph, suggesting economic downturn. The world map background adds a global context. The composition uses a shallow depth of field. Decrease finance illustrations Stacks of Coins with Downtrend Graph Overlay, Financial Crisis Concept. A visual representation of financial decline. Stacks of coins are overlaid with a red. A visual representation of financial decline. Stacks of coins are overlaid with a red downtrend graph, suggesting economic downturn. The world map background adds a global context. The composition uses a shallow depth of field
Free with trial Reduce inflation by increase interest rate, Entrepreneur using needle to pop a balloon representing inflation with a price tag. Attached. Decrease finance vectors Reduce inflation by increase interest rate, Entrepreneur using needle to pop a balloon representing inflation with a price tag. Attached
Free with trial Red bar graph shows declining trend with down arrow. Financial chart with red bars and downward arrow indicating recession. Coin symbolizes loss. Decrease finance vectors Red bar graph shows declining trend with down arrow. Financial chart with red bars and downward arrow indicating recession. Coin symbolizes loss
Free with trial This striking image depicts a global oil market decline, featuring barrels and a red arrow, symbolizing economic downturn and financial crisis. Decrease finance illustrations Global oil market decline represented by black barrels and red downward arrow over a world map in dark background. This striking image depicts a global oil. This striking image depicts a global oil market decline, featuring barrels and a red arrow, symbolizing economic downturn and financial crisis
Free with trial A sharp red arrow with a jagged line points downwards, indicating a decline or loss, isolated on a white background. Decrease finance illustrations Red downward trend arrow isolated on white background. A sharp red arrow with a jagged line points downwards, indicating a decline or loss, isolated on a white. A sharp red arrow with a jagged line points downwards, indicating a decline or loss, isolated on a white background
Free with trial A sharp red arrow pointing downwards in a zig-zag pattern, isolated on a clean white background. Represents decline or loss. Decrease finance illustrations Red downward trend arrow isolated on white background. A sharp red arrow pointing downwards in a zig-zag pattern, isolated on a clean white background. A sharp red arrow pointing downwards in a zig-zag pattern, isolated on a clean white background. Represents decline or loss
Free with trial Red downward trend arrow isolated on white background. A sharp red arrow indicating a downward trend or decline, isolated on a clean white background. Decrease finance illustrations Red downward trend arrow isolated on white background. A sharp red arrow indicating a downward trend or decline, isolated on a clean white background
Free with trial A shiny green metallic arrow with a percentage symbol pointing downwards, isolated on a clean white background. Decrease finance illustrations Green metallic percentage down arrow isolated on white background. A shiny green metallic arrow with a percentage symbol pointing downwards, isolated on a clean. A shiny green metallic arrow with a percentage symbol pointing downwards, isolated on a clean white background
Free with trial This image depicts a sharply declining stock market graph, generated by AI, highlighting the severity of the downturn. The red arrow emphasizes the dramatic fall in market values, representing a potential crisis for investors. Decrease finance illustrations Market Crash: Red Alert. This image depicts a sharply declining stock market graph, generated by AI, highlighting the severity of the downturn. The red arrow. This image depicts a sharply declining stock market graph, generated by AI, highlighting the severity of the downturn. The red arrow emphasizes the dramatic fall in market values, representing a potential crisis for investors.
Free with trial This image shows a rolled-up graph with a red line depicting a downturn, generated by AI. It visually represents a negative trend or decline in data, potentially illustrating economic recession, market loss, or other negative statistical trends. The clean design allows for easy visualization of the. Decrease finance illustrations Declining Graph Report. This image shows a rolled-up graph with a red line depicting a downturn, generated by AI. It visually represents a negative trend or. This image shows a rolled-up graph with a red line depicting a downturn, generated by AI. It visually represents a negative trend or decline in data, potentially illustrating economic recession, market loss, or other negative statistical trends. The clean design allows for easy visualization of the
Free with trial Blue arrow points down beside stack of gold coins with dollar sign. Conceptual graphic represents financial decline, market. Crash or economic recession. AI. Decrease finance illustrations Blue arrow points down beside stack of gold coins with dollar sign. Conceptual graphic represents financial decline, market. Crash or economic recession. AI
Free with trial Robotic Hand Reaching Towards Cost Reduction with Strategic Elements and Digital Analysis in Business Environment Quark. Decrease finance illustrations Robotic Hand Reaching Towards Cost Reduction with Strategic Elements and Digital Analysis in Business Environment Quark.
Free with trial Flat depicting global oil crisis and rising gasoline prices. Features a fuel pump with increasing price display, falling market chart, cracked leaking oil barrels with downward arrows, sad hand holding dollar coins, cars, trucks, gears, and shopping icons. Orange, black and red colors convey economic stress, inflation and energy shortage. Ideal for articles on economy, fuel costs, transportation, and financial crisis. Decrease finance vectors Rising Fuel Prices and Oil Market Crisis Illustration. Flat depicting global oil crisis and rising gasoline prices. Features a fuel pump with increasing price. Flat depicting global oil crisis and rising gasoline prices. Features a fuel pump with increasing price display, falling market chart, cracked leaking oil barrels with downward arrows, sad hand holding dollar coins, cars, trucks, gears, and shopping icons. Orange, black and red colors convey economic stress, inflation and energy shortage. Ideal for articles on economy, fuel costs, transportation, and financial crisis.
Free with trial Trend artwork banner sketch 3D photo collage of oil barrel arrow down energy resources renewable investment loss devaluation inflation. Decrease finance illustrations Trend artwork banner sketch 3D photo collage of oil barrel arrow down energy resources renewable investment loss. Devaluation inflation
Free with trial Hand drawing declining bar chart on blackboard. Hand drawing a decreasing bar graph with chalk on a dark chalkboard. Decrease finance illustrations Hand drawing declining bar chart on blackboard. Hand drawing a decreasing bar graph with chalk on a dark chalkboard
Free with trial A clean, minimalist illustration featuring a combined line graph and bar chart on a white background. The line graph, with circular data points, shows an upward trend with fluctuations. It is overlaid on a series of vertical bars, alternating in black and white, representing discrete data values. The grid lines behind the charts suggest a data analysis or financial context. This graphic is ideal for presentations, reports, and websites related to statistics, business growth, market trends, and data visualization. Decrease finance vectors Line and Bar Chart Combination. A clean, minimalist illustration featuring a combined line graph and bar chart on a white background. The line graph, with. A clean, minimalist illustration featuring a combined line graph and bar chart on a white background. The line graph, with circular data points, shows an upward trend with fluctuations. It is overlaid on a series of vertical bars, alternating in black and white, representing discrete data values. The grid lines behind the charts suggest a data analysis or financial context. This graphic is ideal for presentations, reports, and websites related to statistics, business growth, market trends, and data visualization.
Free with trial A golden, reflective euro coin symbol is depicted with a sharp, downward-trending golden arrow piercing through it, symbolizing financial decline and economic loss. The metallic objects are rendered in 3D and presented against a clean white background. Decrease finance illustrations Golden Euro Coin Symbol with Downward Trending Arrow Indicating Financial Decline currency. A golden, reflective euro coin symbol is depicted with a sharp. A golden, reflective euro coin symbol is depicted with a sharp, downward-trending golden arrow piercing through it, symbolizing financial decline and economic loss. The metallic objects are rendered in 3D and presented against a clean white background
Free with trial Flat vector illustration of a dollar sign in a blue circle between orange and blue arrows pointing up and down. Conceptual icon for currency exchange, stock market volatility, and financial profit. Decrease finance vectors Flat vector illustration of a dollar sign in a blue circle between orange and blue arrows pointing up and down. Conceptual icon. For currency exchange, stock. Flat vector illustration of a dollar sign in a blue circle between orange and blue arrows pointing up and down. Conceptual icon for currency exchange, stock market volatility, and financial profit
Free with trial Robotic Hand Interacting with Cost Reduction Concept on Digital Screen in a High-Tech Cityscape Background for Business Applications Quark. Decrease finance illustrations Robotic Hand Interacting with Cost Reduction Concept on Digital Screen in a High-Tech Cityscape Background for Business. Applications Quark
Free with trial A bright blue 3D zero percent symbol rests on a matching blue platform against a solid light blue background. Decrease finance illustrations Blue 3 D Zero Percent Symbol on Light Blue Platform percentage number. A bright blue 3D zero percent symbol rests on a matching blue platform against a solid. A bright blue 3D zero percent symbol rests on a matching blue platform against a solid light blue background
Free with trial Simple Tag Icon with Percentage Sign Symbol Discounts and Price Cut. AI generated. Decrease finance vectors Simple Tag Icon with Percentage Sign Symbol Discounts and Price Cut. AI generated
Free with trial A 3D illustration shows stacks of gold coins with dollar signs on a black base. A red arrow points downwards, indicating a decrease or decline. The objects are isolated on a white background with a subtle shadow. Decrease finance illustrations Golden coins and red arrow down money dollar. A 3D illustration shows stacks of gold coins with dollar signs on a black base. A red arrow points downwards. A 3D illustration shows stacks of gold coins with dollar signs on a black base. A red arrow points downwards, indicating a decrease or decline. The objects are isolated on a white background with a subtle shadow
Free with trial This image depicts stacks of coins diminishing in size as they approach a small house model, with a calculator nearby. It represents financial concepts like declining property value, investment risk, or housing affordability. high-quality professional detailed modern elegant stylish clean. Decrease finance illustrations Stacks of coins decreasing towards a miniature house symbolizing financial investment or declining property values. This image depicts stacks of coins. This image depicts stacks of coins diminishing in size as they approach a small house model, with a calculator nearby. It represents financial concepts like declining property value, investment risk, or housing affordability. high-quality professional detailed modern elegant stylish clean
Free with trial Close up shot of a businessman analyzing cost reduction strategies using a laptop and pen highlighting a declining graph representing reduced expenses he is focused on achieving business success through financial analysis and efficiency improvements the image highlights the use of modern digital tools in cost management and financial planning. Decrease finance illustrations Analyzing Cost Reduction Strategies with Digital Tools and Data Analysis for Business Success. Close up shot of a businessman analyzing cost reduction strategies. Close up shot of a businessman analyzing cost reduction strategies using a laptop and pen highlighting a declining graph representing reduced expenses he is focused on achieving business success through financial analysis and efficiency improvements the image highlights the use of modern digital tools in cost management and financial planning
Free with trial Cuts to employee compensation depicted by hand using scissors to reduce pay while a businessman stands with a briefcase in an office environment. Decrease finance vectors Cuts to employee compensation depicted by hand using scissors to reduce pay while a businessman stands with a briefcase in an. Office environment
Free with trial Bench vise clamp press coins for control cost reduction with white wall background on wooden table. Concept of cost reduction, cost cut in business or production, optimize continuous improvement. Decrease finance illustrations Bench vise clamp press coins for control cost reduction with white wall background on wooden table. Concept of cost reduction, cost cut in business or
Free with trial A minimalist 3D icon rendered in white is presented against a light gray background. The icon features a square frame with rounded corners, containing a prominent downward-pointing arrow. Below the arrow, two percentage symbols are visible. The overall design suggests concepts of reduction, discount, or a downward trend. Decrease finance illustrations White 3D icon with a downward arrow and percentage symbols inside a square frame image photo. A minimalist 3D icon rendered in white is presented against a light. A minimalist 3D icon rendered in white is presented against a light gray background. The icon features a square frame with rounded corners, containing a prominent downward-pointing arrow. Below the arrow, two percentage symbols are visible. The overall design suggests concepts of reduction, discount, or a downward trend
Free with trial Decreasing Coin Stacks with Red Arrow Showcasing Financial Loss or Negative Trend Illustration. AI generated. Decrease finance illustrations Decreasing Coin Stacks with Red Arrow Showcasing Financial Loss or Negative Trend Illustration. AI generated
Free with trial Green arrow on financial graph with terrified cartoon face reacting to a sharp downward trend. Concept of market crash or business loss. Decrease finance illustrations Green arrow on financial graph with terrified cartoon face reacting to a sharp downward trend. Concept of market crash or business loss
Free with trial Image features a worried man wearing a business suit with his hands on his head, positioned in front of a graph showing financial fluctuations, set against a light background. Decrease finance vectors Businessman with hands on head stares at the fluctuating financial graph displayed behind him. Image features a worried man wearing a business suit with his. Image features a worried man wearing a business suit with his hands on his head, positioned in front of a graph showing financial fluctuations, set against a light background
Free with trial Red bar graph shows downward trend with falling coin. Red bar chart illustrating financial decline with gray arrow and single golden coin on white. Decrease finance vectors Red bar graph shows downward trend with falling coin. Red bar chart illustrating financial decline with gray arrow and single golden coin on white
Free with trial Hand drawn bar chart illustrating a downward trend with a large arrow. AI generated. Decrease finance vectors Hand drawn bar chart illustrating a downward trend with a large arrow. AI generated
Free with trial A visual representation of declining house values, symbolized by a house icon with downward arrows and a dollar sign, indicating economic downturn and financial loss. Decrease finance vectors Vector art of house with downward arrows and dollar sign. A visual representation of declining house values, symbolized by a house icon with downward arrows and. A visual representation of declining house values, symbolized by a house icon with downward arrows and a dollar sign, indicating economic downturn and financial loss
Free with trial Blue Cost reduction icon isolated on blue background. Minimalism concept. 3D render illustration. Decrease finance illustrations Blue Cost reduction icon isolated on blue background. Minimalism concept. 3D render illustration.
Free with trial Stacks of coins diminish with a red arrow pointing down, overlaid with a world map and financial chart, illustrating economic decline and global market downturn. Decrease finance illustrations Declining Economy: Stacks of Coins with Red Arrow and World Map Overlay. Stacks of coins diminish with a red arrow pointing down, overlaid with a world map and. Stacks of coins diminish with a red arrow pointing down, overlaid with a world map and financial chart, illustrating economic decline and global market downturn
Free with trial City Economic Decline. New York City skyline transitioning from color to black and white with a falling graph line, symbolizing economic decline, recession, or urban downturn. Decrease finance illustrations City Skyline Fading with Falling Graph, generative ai. City Economic Decline. New York City skyline transitioning from color to black and white with a falling. City Economic Decline. New York City skyline transitioning from color to black and white with a falling graph line, symbolizing economic decline, recession, or urban downturn.
Free with trial Financial chart shows falling market data with red and green candlesticks against a dark background, creating a dramatic effect suitable for investment and economic themed visuals. Decrease finance illustrations Dramatic Financial Chart with Green and Red Candlesticks on Black Background. Financial chart shows falling market data with red and green candlesticks against a. Financial chart shows falling market data with red and green candlesticks against a dark background, creating a dramatic effect suitable for investment and economic themed visuals
Free with trial Hand Drawn Downward Trend Arrow On white Background. Decrease finance illustrations Hand-drawn black zigzag line ending with a downward arrow On white Background, symbolizing decline or negative trend. Hand Drawn Downward Trend Arrow On white. Hand Drawn Downward Trend Arrow On white Background
Free with trial A 3D render of a pink globe with yellow continents and a red downward arrow piercing it. Isolated on a transparent background. Decrease finance vectors Pink globe with yellow continents and red arrow isolated on a transparent background earth. A 3D render of a pink globe with yellow continents and a red downward. A 3D render of a pink globe with yellow continents and a red downward arrow piercing it. Isolated on a transparent background
Free with trial The image displays a financial trend chart superimposed on a modern office setting. the chart depicts a declining trend, indicated by a downward-sloping line with an arrow pointing downwards. the background features a blurred office environment with windows, a plant, and furniture, creating a sense of realism and context for the financial data. the overall composition suggests a reflection or projection of financial performance within a contemporary workspace. Decrease finance illustrations Financial decline chart in modern office space. The image displays a financial trend chart superimposed on a modern office setting. the chart depicts a declining. the image displays a financial trend chart superimposed on a modern office setting. the chart depicts a declining trend, indicated by a downward-sloping line with an arrow pointing downwards. the background features a blurred office environment with windows, a plant, and furniture, creating a sense of realism and context for the financial data. the overall composition suggests a reflection or projection of financial performance within a contemporary workspace.
Free with trial This hand-drawn bar chart, generated by AI, visually represents growth over time. The chart shows an initial decline followed by a significant upward trend, highlighting potential recovery or resurgence after a setback. The artistic style adds a unique touch. Decrease finance illustrations AI-Generated Growth Chart. This hand-drawn bar chart, generated by AI, visually represents growth over time. The chart shows an initial decline followed by a. This hand-drawn bar chart, generated by AI, visually represents growth over time. The chart shows an initial decline followed by a significant upward trend, highlighting potential recovery or resurgence after a setback. The artistic style adds a unique touch.
Free with trial Set line Automated teller machine and money Online sports betting Hand holding casino chips Lottery ticket Football Calendar Bottle of wine and Casino icon. Vector. Decrease finance vectors Set line Automated teller machine and money, Online sports betting, Hand holding casino chips, Lottery ticket, Football. Set line Automated teller machine and. Set line Automated teller machine and money Online sports betting Hand holding casino chips Lottery ticket Football Calendar Bottle of wine and Casino icon. Vector.
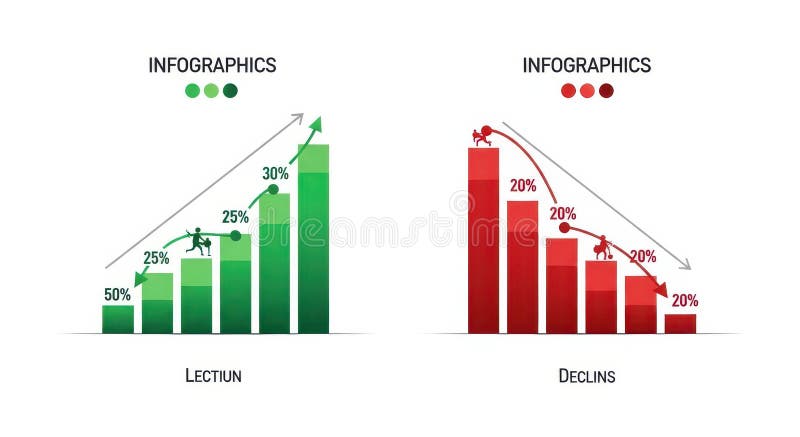
Free with trial The image displays two infographics side by side. the left infographic, titled "lection," depicts a green bar graph showing growth, starting at 50% and increasing to 30% with a figure climbing the bars. an upward-pointing arrow indicates positive growth. the right infographic, titled "declins," shows a red bar graph illustrating decline, starting at 20% and decreasing to 20% with a figure falling down the bars. a downward-pointing arrow indicates negative growth. Decrease finance illustrations Infographics showing growth and decline charts. The image displays two infographics side by side. the left infographic, titled 'lection,' depicts a green bar. the image displays two infographics side by side. the left infographic, titled "lection," depicts a green bar graph showing growth, starting at 50% and increasing to 30% with a figure climbing the bars. an upward-pointing arrow indicates positive growth. the right infographic, titled "declins," shows a red bar graph illustrating decline, starting at 20% and decreasing to 20% with a figure falling down the bars. a downward-pointing arrow indicates negative growth.
Free with trial Visual representation of financial loss and economic recession with a downward trending graph, stacked gold coins, and a pie chart symbolizing market share decrease. Decrease finance illustrations Financial downturn chart with falling red arrow and gold coins representing economic decline. Visual representation of financial loss and economic recession with. Visual representation of financial loss and economic recession with a downward trending graph, stacked gold coins, and a pie chart symbolizing market share decrease
Free with trial Flat showing two orange delivery trucks driving over a wavy road symbolizing economic volatility. At the top, rising gas pumps with dollar signs and upward arrow indicate fuel price increase. On the left, thriving shops with cash register, money and growth arrow, on the right, struggling business with falling sales and declining arrow. Ideal for articles on inflation, logistics costs, supply chain, transportation, and small business economics. Decrease finance vectors Rising Fuel Prices Impacting Delivery and Retail Sales. Flat showing two orange delivery trucks driving over a wavy road symbolizing economic volatility. At the. Flat showing two orange delivery trucks driving over a wavy road symbolizing economic volatility. At the top, rising gas pumps with dollar signs and upward arrow indicate fuel price increase. On the left, thriving shops with cash register, money and growth arrow, on the right, struggling business with falling sales and declining arrow. Ideal for articles on inflation, logistics costs, supply chain, transportation, and small business economics.
Free with trial Detailed flat infographic illustrating financial challenges facing cafe and restaurant businesses. Central building surrounded by rising arrows, charts and dollar symbols. Sections show increased operational costs, higher ingredient expenses, overall expense pressure, rising delivery fees, customer spending reduction and decreased profit margin. Modern blue, orange and red color scheme with icons of food, fuel, delivery. Ideal for business, economy, hospitality management and inflation articles. Decrease finance vectors Cafe Restaurant Rising Costs Profit Margin Infographic. Detailed flat infographic illustrating financial challenges facing cafe and restaurant businesses. Detailed flat infographic illustrating financial challenges facing cafe and restaurant businesses. Central building surrounded by rising arrows, charts and dollar symbols. Sections show increased operational costs, higher ingredient expenses, overall expense pressure, rising delivery fees, customer spending reduction and decreased profit margin. Modern blue, orange and red color scheme with icons of food, fuel, delivery. Ideal for business, economy, hospitality management and inflation articles.
Free with trial Economy growth arrow icons. On white. Decrease finance illustrations Economy growth arrow icons. On white
Free with trial A 3D bar chart displays a downward trend, with bars decreasing in height from left to right. A red arrow follows the trend, pointing downwards. The chart is placed on a reflective glass table, casting a clear reflection. Sunlight casts diagonal shadows on a plain white wall in the background. The overall composition suggests a financial or business decline. Decrease finance illustrations Downward Trend Bar Chart with Red Arrow on Glass Table graph data. A 3D bar chart displays a downward trend, with bars decreasing in height from left to right. A. A 3D bar chart displays a downward trend, with bars decreasing in height from left to right. A red arrow follows the trend, pointing downwards. The chart is placed on a reflective glass table, casting a clear reflection. Sunlight casts diagonal shadows on a plain white wall in the background. The overall composition suggests a financial or business decline
Free with trial A financial chart showing declining index lines in blue shades on a grid-style white background. Concept of market analysis and trends. 3D Rendering. Decrease finance illustrations Financial chart with declining index lines on grid background. 3D Rendering. A financial chart showing declining index lines in blue shades on a grid-style white. A financial chart showing declining index lines in blue shades on a grid-style white background. Concept of market analysis and trends. 3D Rendering
Free with trial This flat vector illustration depicts a rectangular screen displaying a red line graph with a downward pointing arrow. The design uses a clean, minimalist aesthetic with soft pastel background tones and bold outlines. It represents concepts of financial decline, market loss, or negative economic performance in a professional business context. Decrease finance vectors A digital icon showing a red downward trend arrow on a screen. This flat vector illustration depicts a rectangular screen displaying a red line graph with a. This flat vector illustration depicts a rectangular screen displaying a red line graph with a downward pointing arrow. The design uses a clean, minimalist aesthetic with soft pastel background tones and bold outlines. It represents concepts of financial decline, market loss, or negative economic performance in a professional business context
Free with trial An abstract image featuring four cylindrical shapes of varying heights, arranged in a descending order. The cylinders are dark, with the tops illuminated by a warm, golden light. The background gradients from a warm orange to a darker brown, creating a sense of depth and mystery. This image conveys concepts of decline, progress, or stages, and can be used to represent business trends, data visualization, or abstract concepts. Decrease finance illustrations Abstract Cylinders in Dim Light. An abstract image featuring four cylindrical shapes of varying heights, arranged in a descending order. The cylinders are dark. An abstract image featuring four cylindrical shapes of varying heights, arranged in a descending order. The cylinders are dark, with the tops illuminated by a warm, golden light. The background gradients from a warm orange to a darker brown, creating a sense of depth and mystery. This image conveys concepts of decline, progress, or stages, and can be used to represent business trends, data visualization, or abstract concepts.
Free with trial This minimalist vector illustration depicts a line chart indicating a negative performance or decline. The design features a clean blue line with circular data points connected by segments, ending in a sharp red arrow pointing downwards. The background is a soft, neutral shade, emphasizing the clear visual representation of financial loss or decreasing statistics. Decrease finance vectors A simple line graph showing a downward trend with a red arrow. This minimalist vector illustration depicts a line chart indicating a negative performance or. This minimalist vector illustration depicts a line chart indicating a negative performance or decline. The design features a clean blue line with circular data points connected by segments, ending in a sharp red arrow pointing downwards. The background is a soft, neutral shade, emphasizing the clear visual representation of financial loss or decreasing statistics
Free with trial Bold red percentage symbol icon. A striking, clean vector icon of a bold red percentage symbol, perfect for financial, statistical, or data-related designs. Decrease finance illustrations Bold red percentage symbol icon. A striking, clean vector icon of a bold red percentage symbol, perfect for financial, statistical, or data-related designs
Free with trial Laptop screen showing red downward stock chart and graph, on wooden desk with plant and notebook, concept of global financial crisis. 3D Rendering. Decrease finance illustrations Laptop displaying falling red stock market graph with downward arrow, indicating global financial crisis and economic recession. Laptop screen showing red. Laptop screen showing red downward stock chart and graph, on wooden desk with plant and notebook, concept of global financial crisis. 3D Rendering
Free with trial Downward Trend Chart. A blue line chart illustrates a downward trend, suggesting decline and loss and can be used to show financial or business performance. Decrease finance illustrations Downward Trend Chart. A blue line chart illustrates a downward trend, suggesting decline and loss and can be used to show financial or business performance
 Sign in