Free with trial Modern data decline visualization icons with colorful gradient. Set of icons representing data decline and financial loss business charts graphs arrows isolated. Decrease financial fall business vectors Modern data decline visualization icons with colorful gradient. Set of icons representing data decline and financial loss business charts graphs arrows isolated
Free with trial Financial crisis. Economic collapse. Bankruptcy, economic downturn. Stressed people analyze the financial downturn. Decrease financial fall business vectors Financial crisis. Economic collapse. Bankruptcy, economic downturn. Stressed people analyze the financial downturn
Free with trial Flat style illustration showing a downward trending financial chart with dollar coin and bars. Decrease financial fall business vectors Financial market decline showing loss with downward trend arrow. Flat style illustration showing a downward trending financial chart with dollar coin and bars.
Free with trial Salary reduction, vector flat illustration. Employer cutting dollar banknote with scissors, stressed and confused employees taking pay cut. Wage reduction, recession, business fall, economic collapse. Decrease financial fall business vectors Salary reduction, vector flat style design illustration. Salary reduction, vector flat illustration. Employer cutting dollar banknote with scissors, stressed and confused employees taking pay cut. Wage reduction, recession, business fall, economic collapse.
Free with trial 3D percent icons in white, grey, and black colors showing rate, discount, and price change. Modern percentage vector for sale, business, and financial concept, symbolizing growth and reduction. Decrease financial fall business vectors 3D percent icons in white, grey, and black colors showing rate, discount, and price change. Modern percentage vector for
Free with trial Decrease and increase chart icon with arrow. Negative and positive trend symbol illustration. Decrease financial fall business vectors Decrease and increase chart icon with arrow. Negative and positive trend symbol
Free with trial Investment Budget Business Costs Finance Concept. Decrease financial fall business illustrations Investment Budget Business Costs Finance Concept
Free with trial Vertical arrow pointing downward next to bar graph with decreasing metrics. Ideal for business analysis, data visualization, financial downturn, market decline, trend report, economics, simple flat. Decrease financial fall business illustrations Declining Bar Graph with Arrow Indicating Downward Trend in Performance or Statistics. Vertical arrow pointing downward next to bar graph with decreasing metrics. Ideal for business analysis, data visualization, financial downturn, market decline, trend report, economics, simple flat
Free with trial Stocks fall. Candle stick graph chart of stock market investment trading. Bullish point, down trend of graph. Futuristic red signal trend drop down arrow chart. Decrease financial fall business vectors Stocks fall. Candle stick graph chart of stock market investment trading. Bullish point, down trend of graph. Futuristic red. Stocks fall. Candle stick graph chart of stock market investment trading. Bullish point, down trend of graph. Futuristic red signal trend drop down arrow chart
Free with trial The money and business outline icon set. The stack of dollar coins, gold 24k, upward and downward graph, online banking, briefcase and banknote symbols. Thin linear vector icons with editable strokes. Decrease financial fall business vectors The money and business outline vector icon set. The money and business outline icon set. The stack of dollar coins, gold 24k, upward and downward graph, online banking, briefcase and banknote symbols. Thin linear vector icons with editable strokes
Free with trial Financial crisis impact concept with stressed individual and red stock market graph in urban setting. Generative AI. Decrease financial fall business illustrations Financial crisis impact concept with stressed individual and red stock market graph in urban setting
Free with trial Vector economic crisis icons. Editable stroke set line signs. Causes and consequences of financial crises. stock market crash economic bubble bank run inflation currency health unemployment recession. Decrease financial fall business vectors Vector economic crisis icons. Editable stroke set line signs. Causes and consequences of financial crises. stock market crash
Free with trial A light blue 3D zigzag arrow pointing downwards, illustrating market instability, declining trends, financial risks, and setbacks in a modern digital graphic style. Decrease financial fall business vectors Light Blue 3D Zigzag Downward Arrow for Financial Decline and Risk. A light blue 3D zigzag arrow pointing downwards, illustrating market instability, declining trends, financial risks, and setbacks in a modern digital graphic style.
Free with trial World financial crisis icon with depressed character sitting on falling arrow isometric vector illustration. Decrease financial fall business vectors World Financial Crisis Icon
Free with trial Business finance crisis concept. Bankruptcy vector illustration isolated on white background. Money fall down symbol. Decrease financial fall business vectors Business finance crisis concept. Gold coin. Business finance crisis concept. Bankruptcy vector illustration isolated on white background. Money fall down symbol.
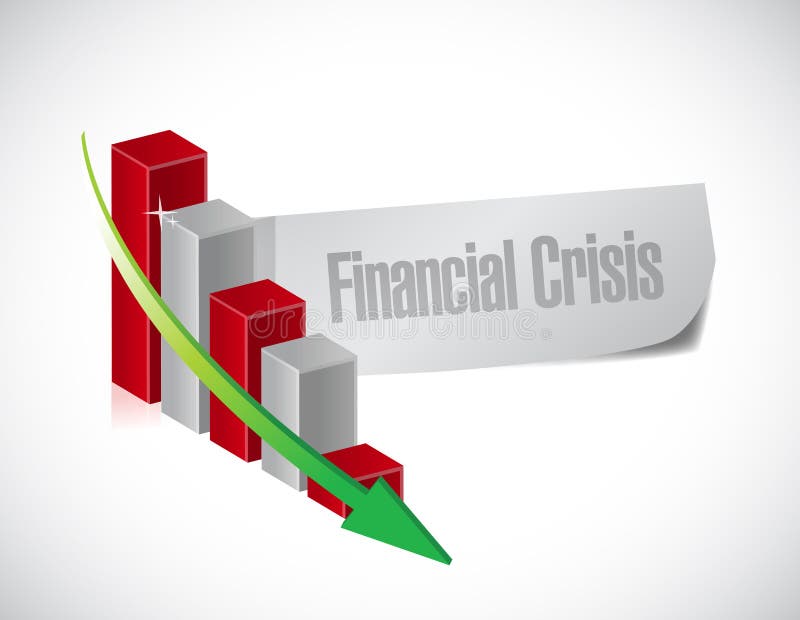
Free with trial Financial crisis graph illustration design over a white background. Decrease financial fall business illustrations Financial crisis graph illustration design
Free with trial A simple and clean line art icon of a graph, isolated on a white background. This vector illustration features a line chart with axes, showing a fluctuating trend with distinct data points. The minimalist design makes it perfect for various applications related to business, finance, and data analysis. Ideal for use in presentations, infographics, websites, mobile apps, and user interfaces to represent concepts like statistics, growth, market trends, performance reports, and financial analytics. A versatile symbol for progress and data visualization. Decrease financial fall business illustrations Analytics Line Graph Vector Icon. A simple and clean line art icon of a graph, isolated on a white background. This vector illustration features a line chart with axes, showing a fluctuating trend with distinct data points. The minimalist design makes it perfect for various applications related to business, finance, and data analysis. Ideal for use in presentations, infographics, websites, mobile apps, and user interfaces to represent concepts like statistics, growth, market trends, performance reports, and financial analytics. A versatile symbol for progress and data visualization.
Free with trial Economic crisis icon of stock market crash and global financial downturn, line vector. Stock exchange market index fall down with money inflation and devaluation in economic crisis and trade recession. Decrease financial fall business vectors Economic crisis line icon of stock market crash. Economic crisis icon of stock market crash and global financial downturn, line vector. Stock exchange market index fall down with money inflation and devaluation in economic crisis and trade recession
Free with trial Collapsing economy. recession business graph concept illustration design over white. Decrease financial fall business illustrations Collapsing economy. recession business graph
Free with trial Stock market crash graph line icon with color down arrow, vector economic crisis, finance and business recession. Outline laptop screen with financial chart of declining stock prices, bankruptcy. Decrease financial fall business vectors Stock market crash line icon, economic crisis. Stock market crash graph line icon with color down arrow, vector economic crisis, finance and business recession. Outline laptop screen with financial chart of declining stock prices, bankruptcy
Free with trial Financial crisis concept illustration design over a white background. Decrease financial fall business illustrations Financial crisis concept illustration design
Free with trial Stacks of gold coins are arranged in a triangular formation on a white background. Above them, a large, upward-pointing arrow signifies growth and financial prosperity. The coins and arrow are illustrated in a uniform golden hue, symbolizing wealth and economic advancement. Decrease financial fall business vectors Financial Growth Concept with Stacks of Gold Coins and Upward Arrow. Financial Growth Gold Coins. Growth Chart. Stacks of gold coins are arranged in a triangular formation on a white background. Above them, a large, upward-pointing arrow signifies growth and financial prosperity. The coins and arrow are illustrated in a uniform golden hue, symbolizing wealth and economic advancement.
Free with trial Financial crisis inflation isometric set with isolated icons of business workers holding heads losing money profit vector illustration. Decrease financial fall business vectors Financial Crisis Icons Collection. Financial crisis inflation isometric set with isolated icons of business workers holding heads losing money profit vector illustration
Free with trial Economic and financial crisis rising inflation and debt 3D render background. Decrease financial fall business illustrations Economic and financial global crisis rising inflation and debt on stock market. Economic and financial crisis rising inflation and debt 3D render background
Free with trial Financial decline decreasing bar chart simple vector symbol. EPS vector icon. Decrease financial fall business vectors Financial decline chart. Financial decline decreasing bar chart simple vector symbol. EPS vector icon
Free with trial Business and economy crisis minimal illustration. Symbol of negative outlook, future, depression. Editable eps10 vector concept. Decrease financial fall business vectors Business and economy crisis minimal illustration. Symbol of negative outlook, future, depression. Editable vector.
Free with trial Business and economy crisis minimal illustration. Symbol of negative outlook, future, depression. Editable eps10 vector concept. Decrease financial fall business vectors Business and economy crisis minimal illustration. Symbol of negative outlook, future, depression. Editable vector.
Free with trial Flat vector illustration of a businessman holding cash that is breaking apart, symbolizing financial loss, investment risk, economic instability, and money depreciation. Decrease financial fall business vectors Financial Loss Concept Illustration with Money Breaking and Investment Risk. Flat vector illustration of a businessman holding cash that is breaking apart, symbolizing financial loss, investment risk, economic instability, and money depreciation
Free with trial Bank bankruptcy, economic crisis outline icon. Financial downturn problem, company money loss risk or recession gander vector icon. Business crisis line symbol or sign with ruined bank building. Decrease financial fall business vectors Bank bankruptcy, economic crisis outline icon
Free with trial Concept of global financial crisis. Blurry planet hologram with double exposure of falling digital graphs. 3d rendering toned image. Decrease financial fall business illustrations Global financial crisis concept, stock market. Concept of global financial crisis. Blurry planet hologram with double exposure of falling digital graphs. 3d rendering toned image
Free with trial Monochrome Graphic Illustrating a Financial Decline or Discount. Decrease financial fall business vectors Percentage Rate Decrease Symbolized by a Downward Arrow Icon. Monochrome Graphic Illustrating a Financial Decline or Discount.
Free with trial Bankruptcy and inflation business, man in depression. Vector of crisis finance bankruptcy, business economy inflation illustration. Decrease financial fall business vectors Bankruptcy and inflation business, man in depression
Free with trial Realistic gold Bitcoin sign encapsulated in transparent soap bubble for business, financial, banking and web projects and designs. Symbol of burst or crash cryptocurrency blockchain concept. Vector illustration. Decrease financial fall business illustrations Realistic gold Bitcoin sign encapsulated in transparent soap bubble
Free with trial This abstract illustration depicts the dynamic nature of financial markets, showcasing both significant volatility and an overall upward growth trend. A prominent red line graph indicates positive development, while underlying grey jagged lines and vertical bars represent frequent fluctuations and market uncertainty. To the right, orange up and down arrows symbolize the opposing forces and constant changes within the market. This visual is ideal for conveying concepts related to stock market performance, economic indicators, investment risks, and business analysis. Decrease financial fall business vectors Financial Market Volatility and Growth Trend. This abstract illustration depicts the dynamic nature of financial markets, showcasing both significant volatility and an overall upward growth trend. A prominent red line graph indicates positive development, while underlying grey jagged lines and vertical bars represent frequent fluctuations and market uncertainty. To the right, orange up and down arrows symbolize the opposing forces and constant changes within the market. This visual is ideal for conveying concepts related to stock market performance, economic indicators, investment risks, and business analysis.
Free with trial Business concept illustration. Sad businessman is sitting. Falling chart on the blue background. Elements are layered separately in vector file. Decrease financial fall business vectors Business concept illustration.
Free with trial Growth and decline chart icon in flat design. Business trend arrow symbol illustration. Profit and loss concept. Decrease financial fall business vectors Growth and decline chart icon in flat design. Business trend arrow symbol. Profit and loss concept
Free with trial Economic crisis icon, analysis of global market economy downturn and bankruptcy, vector line symbol. Magnifier and arrow down icon of stock exchange and economical index decrease of financial crisis. Decrease financial fall business vectors Economic crisis icon, analysis of market downturn. Economic crisis icon, analysis of global market economy downturn and bankruptcy, vector line symbol. Magnifier and arrow down icon of stock exchange and economical index decrease of financial crisis
Free with trial Panic businesswoman watching red bar chart falling like domino effect, symbolizing financial crisis, economic downturn, business failure, risk, and market collapse concept illustration. Decrease financial fall business vectors Panic businesswoman watching falling red bar chart like domino effect. Panic businesswoman watching red bar chart falling like domino effect, symbolizing financial crisis, economic downturn, business failure, risk, and market collapse concept illustration
Free with trial Fall savings event on blue background. Decrease financial fall business illustrations Fall savings event on blue
Free with trial Concept of Bitcoin bubble and speculation. Risks and dangers of investing to Bitcoin. Financial bubble. Flat cartoon illustration. Decrease financial fall business illustrations Concept of Bitcoin bubble and speculation.Risks and dangers of investing to Bitcoin. Financial bubble
Free with trial Graph chart decline, fall market stock bar isometric flat icon. 3d vector colorful illustration. Pictogram isolated on white background. Decrease financial fall business vectors Graph chart decline, fall market stock bar isometric flat icon. 3d vector
Free with trial World financial crisis. Bankruptcy due to Corona crisis. Collapse of the economy caused by coronavirus COVID-19 outbreak. Market fall Concept flat vector illustration. Decrease financial fall business vectors World financial crisis. Bankruptcy due to Corona crisis. Collapse of the economy caused by coronavirus COVID-19 outbreak. Market
Free with trial A minimalist vector icon illustrating market volatility and financial trends. The graphic features two distinct line graphs on a coordinate system: a jagged, highly fluctuating upper line representing high volatility, and a smoother lower line with marked points indicating a general trend. Up-down arrows and separate up down indicators further emphasize market movement and unpredictable changes. Ideal for financial reports, business presentations, data visualization, and economic analysis. Decrease financial fall business vectors Market Volatility and Financial Trend Graph Icon. A minimalist vector icon illustrating market volatility and financial trends. The graphic features two distinct line graphs on a coordinate system: a jagged, highly fluctuating upper line representing high volatility, and a smoother lower line with marked points indicating a general trend. Up-down arrows and separate up down indicators further emphasize market movement and unpredictable changes. Ideal for financial reports, business presentations, data visualization, and economic analysis.
Free with trial Continuous one single line drawing Business chart loss schedule icon vector illustration concept. Decrease financial fall business vectors One line drawing Business chart loss concept. Continuous one single line drawing Business chart loss schedule icon vector illustration concept
Free with trial Red zigzag line graph with broken arrows pointing up and down. Business metaphor for market volatility and financial crisis. Handdrawn zig zag arrows. Decrease financial fall business vectors Red zigzag line graph with broken arrows pointing up and down. Market volatility and financial crisis. Zig zag arrows. Red zigzag line graph with broken arrows pointing up and down. Business metaphor for market volatility and financial crisis. Handdrawn zig zag arrows
Free with trial Red 3d arrow going down stock icon on white background. Bankruptcy, financial market crash icon for your web site design, logo, app, UI. graph chart downtrend symbol. chart going down sign. Decrease financial fall business vectors Red 3d arrow going down stock icon on white background. Bankruptcy, financial market crash icon for your web site design
Free with trial Glass piggy bank with decreasing piles of coins. Saving inflation, financial crisis and loosing money concept. 3d illustration. Decrease financial fall business illustrations Glass piggy bank with decreasing piles of coins. Saving inflation, financial crisis and loosing money concept
Free with trial A conceptual vector illustration depicting the currency exchange rate between the US Dollar (USD) and the Euro (EUR). The green dollar sign is shown with an upward-pointing arrow and a rising trend line, symbolizing an increase in its value. Conversely, the red Euro sign is accompanied by a downward-pointing arrow and a falling trend line, indicating a decrease in its value. A red checkmark sits between them, emphasizing the shift. This graphic effectively visualizes market fluctuations, forex trading, economic trends, and international finance, suitable for financial news, reports, and presentations. Decrease financial fall business vectors USD EUR Currency Exchange Rate Trend and Fluctuation. A conceptual vector illustration depicting the currency exchange rate between the US Dollar (USD) and the Euro (EUR). The green dollar sign is shown with an upward-pointing arrow and a rising trend line, symbolizing an increase in its value. Conversely, the red Euro sign is accompanied by a downward-pointing arrow and a falling trend line, indicating a decrease in its value. A red checkmark sits between them, emphasizing the shift. This graphic effectively visualizes market fluctuations, forex trading, economic trends, and international finance, suitable for financial news, reports, and presentations.
Free with trial Silver and Red 3D Profit Decrease Background. Decrease financial fall business illustrations 3D Profit Decrease Background
Free with trial Money increase and decrease icons. Low or high total cost icon. Price, sale, rate or profit going up or down symbol with arrow and dollar sign. Vector illustration. Decrease financial fall business vectors Money increase and decrease icons. Low or high total cost icon. Price, sale, rate or profit going up or down symbol
Free with trial Money increase and decrease icons. Low or high total cost icon. Price, sale, rate or profit going up or down symbol with arrow and dollar sign. Vector illustration. Decrease financial fall business vectors Money increase and decrease icons. Low or high total cost icon. Price, sale, rate or profit going up or down symbol
Free with trial Money increase and decrease icons. Low or high total cost icon. Price, sale, rate or profit going up or down symbol with arrow and dollar sign. Vector illustration. Decrease financial fall business vectors Money increase and decrease icons. Low or high total cost icon. Price, sale, rate or profit going up or down symbol
Free with trial Stressed businessman with falling down business chart background. Decrease financial fall business illustrations Stressed businessman with falling down business chart
Free with trial A bold red arrow pointing downward, symbolizing a decrease, loss, or negative trend. Decrease financial fall business vectors Red downward arrow showing decrease or loss. A bold red arrow pointing downward, symbolizing a decrease, loss, or negative trend.
Free with trial A 3D rendering of a bar chart featuring three colorful columns: blue, orange, and green, increasing in height from left to right. Two prominent red downward arrows are positioned above the tallest green bar, clearly indicating a decline, decrease, or negative trend. The minimalist design on a clean white background makes it ideal for illustrating business performance, financial reports, economic downturns, sales drops, or any data visualization requiring a clear representation of a negative change or warning. Perfect for presentations, infographics, and analytical content. Decrease financial fall business vectors 3D Bar Chart with Red Downward Arrows Showing Decline. A 3D rendering of a bar chart featuring three colorful columns: blue, orange, and green, increasing in height from left to right. Two prominent red downward arrows are positioned above the tallest green bar, clearly indicating a decline, decrease, or negative trend. The minimalist design on a clean white background makes it ideal for illustrating business performance, financial reports, economic downturns, sales drops, or any data visualization requiring a clear representation of a negative change or warning. Perfect for presentations, infographics, and analytical content.
Free with trial Dollar coin decline. Downward arrow concept. Financial loss symbol. Vector money illustration. EPS 10. Decrease financial fall business vectors Dollar coin decline. Downward arrow concept. Financial loss symbol. Vector money illustration.
Free with trial World financial crisis. Bankruptcy due to Corona crisis. Collapse of the economy caused by coronavirus COVID-19 outbreak. Market fall. Concept flat vector illustration. Decrease financial fall business vectors World financial crisis. Bankruptcy due to Corona crisis. Collapse of the economy caused by coronavirus COVID-19 outbreak
Free with trial Falling bar chart with downward arrow representing business decline and financial problems. Ideal for risk, loss, and economic downturn concepts. Decrease financial fall business vectors Business decline chart downward trend problem failure vector silhouette illustration design. Falling bar chart with downward arrow representing business decline and financial problems. Ideal for risk, loss, and economic downturn concepts
Free with trial A bright red 3d arrow pointing downwards, symbolizing a decrease or decline, often used in financial contexts. Decrease financial fall business vectors Red downward arrow indicates economic decline. A bright red 3d arrow pointing downwards, symbolizing a decrease or decline, often used in financial contexts.
Free with trial Economic and financial crisis rising inflation and debt 3D render background. Decrease financial fall business illustrations Economic and financial crisis rising inflation and debt as metaphor with arrow down. Economic and financial crisis rising inflation and debt 3D render background
Free with trial Global financial crisis drop. International economic loss and bankruptcy vector monocolor illustration. Decrease financial fall business vectors Global financial crisis drop
Free with trial Red 3d arrow going down stock icon on white background. Bankruptcy, financial market crash icon for your web site design, logo, app, UI. graph chart downtrend symbol. chart going down sign. Decrease financial fall business vectors Red 3d arrow going down stock icon on white background. Bankruptcy, financial market crash icon for your web site design, logo. Red 3d arrow going down stock icon on white background. Bankruptcy, financial market crash icon for your web site design, logo, app, UI. graph chart downtrend symbol.chart going down sign.
Free with trial Red 3d arrow going down stock icon on white background. Bankruptcy, financial market crash icon for your web site design, logo, app, UI. graph chart downtrend symbol. chart going down sign. Decrease financial fall business vectors Red 3d arrow going down stock icon on white background. Bankruptcy, financial market crash icon for your web site design
Free with trial Financial and stock investment market concept. The bear market which price of securities are falling down. Decrease financial fall business vectors Financial and stock investment market concept.
Free with trial Business concept illustration of a businessman descending on the decreasing chart, getting layoff, bankruptcy concept. Decrease financial fall business vectors Business concept illustration of a businessman descending on the decreasing chart
Free with trial Stock market plunge, business bankrupt or economic recession due to Coronavirus outbreak COVID-19 pandemic concept, depressed businessman riding down turn red arrow economics graph with virus pathogen. Decrease financial fall business illustrations Stock market plunge, business bankrupt or economic recession due to Coronavirus outbreak COVID-19 pandemic concept, depressed
Free with trial An abstract 3D rendering visually representing the concept of 'LOSS'. The prominent white text 'LOSS' is superimposed over a stack of dark, metallic, fluid-like shapes that appear to be collapsing or compressing under pressure. A powerful red, glowing energy beam erupts from beneath this structure, symbolizing impact, crisis, or a significant downturn. Small, dark, reflective cubes float in the dark grey background, adding to the abstract, digital aesthetic. This image effectively conveys themes of financial decline, business failure, data loss, or any form of significant reduction and negative consequence. Decrease financial fall business illustrations Loss Concept with Abstract Energy and Collapsing Structure. An abstract 3D rendering visually representing the concept of 'LOSS'. The prominent white text 'LOSS' is superimposed over a stack of dark, metallic, fluid-like shapes that appear to be collapsing or compressing under pressure. A powerful red, glowing energy beam erupts from beneath this structure, symbolizing impact, crisis, or a significant downturn. Small, dark, reflective cubes float in the dark grey background, adding to the abstract, digital aesthetic. This image effectively conveys themes of financial decline, business failure, data loss, or any form of significant reduction and negative consequence.
Free with trial Negative interest rates in investment financial recession. Crisis monetary policy number below zero growth vector. Decrease financial fall business vectors Negative interest rates in investment financial recession. Crisis monetary policy number below zero growth
Free with trial Coffee bean price commodity market low going down production decrease global trade vector. Decrease financial fall business vectors Coffee bean price commodity market low going down production decrease global trade
Free with trial 3d renderer illustration. White Business people with red arrow falling. Decrease concept. white background. Decrease financial fall business illustrations 3d White people with red arrow falling. Decrease concept. 3d renderer illustration. White Business people with red arrow falling. Decrease concept. white background
Free with trial 3d renderer illustration. White Business people with red arrow falling. Decrease concept. white background. Decrease financial fall business illustrations 3d White people with red arrow falling. Decrease concept. 3d renderer illustration. White Business people with red arrow falling. Decrease concept. white background
Free with trial Financial crisis icon with falling chart and man in panic isometric vector illustration. Decrease financial fall business vectors Financial Crisis Icon
Free with trial Decrease and Growing graph Icon. Chart with bars declining vector icon. Finance graph symbol. Vector on white background. Decrease financial fall business vectors Decrease and Growing graph Icon. Chart with bars declining vector icon. Finance graph symbol.
Free with trial A glowing neon red bar chart shows a significant downward trend, symbolizing financial loss or negative growth on a black backdrop. Decrease financial fall business illustrations Neon red bar chart illustrating a steep decline in financial performance against a dark background. A glowing neon red bar chart shows a significant downward trend, symbolizing financial loss or negative growth on a black backdrop
Free with trial Concept of financial crisis or economic impact, graphic of colourful dominos as business infographics. Decrease financial fall business vectors DominosBusiness. concept of financial crisis or economic impact, graphic of colourful dominos as business infographics
Free with trial Interest rate going down decrease cost of fund and inflation money market percentage vector. Decrease financial fall business illustrations Interest rate going down decrease cost of fund and inflation money market percentage
Free with trial Coronavirus impact on global economy and stock markets, financial crisis concept. vector. Decrease financial fall business vectors Coronavirus impact on global economy and stock markets, financial crisis concept
Free with trial Golden bar chart with downward arrow and dollar coin. Symbolizes economic decline, financial loss, market crash, recession, currency depreciation, business challenges. Decrease financial fall business illustrations Economic downturn represented by golden bar chart and dollar. Golden bar chart with downward arrow and dollar coin. Symbolizes economic decline, financial loss, market crash, recession, currency depreciation, business challenges
Free with trial 3D yellow arrow graph descending sharply on a teal blue background, representing financial loss or negative trend. Decrease financial fall business illustrations 3D yellow arrow graph descending sharply on a teal blue background, representing financial loss or negative trend