Free with trial Stock market investment trading technical analysis candlestick, bar, line and area chart set on white background. Business candle stick graph exchange trends. Trader financial investment index. Vector. Decrease financial market rate vectors Stock market investment trading technical analysis candlestick, bar, line and area chart set on white background
Free with trial Set Fire in burning house, Debt ball chained to coin, Dollar rate decrease and Mobile stock trading icon. Vector. Decrease financial market rate vectors Set Fire in burning house, Debt ball chained to coin, Dollar rate decrease and Mobile stock trading icon. Vector
Free with trial Percent decrease vector design. Consist of down arrow and percent sign, icon or symbol. Concept for percentage of interest rate, loss profit, stock price or discount. Editable line stroke 48x48 px. n. Decrease financial market rate vectors Percent decrease vector design, 48x48 pixel perfect and editable stroke. Percent decrease vector design. Consist of down arrow and percent sign, icon or symbol. Concept for percentage of interest rate, loss profit, stock price or discount. Editable line stroke 48x48 px.n
Free with trial Set Isometric Contract money and pen, Pie chart infographic, Mobile stock trading and Dollar rate decrease icon. Vector. Decrease financial market rate illustrations Set Isometric Contract money and pen, Pie chart infographic, Mobile stock trading and Dollar rate decrease icon. Vector
Free with trial Market fluctuation in British Pound or Sterling currency. Devaluation and decrease in exchange rate value of Sterling. Recession, inflation, depression and falling economy. 3D render. Decrease financial market rate illustrations Market fluctuation in British Pound or Sterling currency
Free with trial Financial difficulties, decrease in value of business or company shares, stock market crash, economic crisis, business failure and loss of cash, lose investments, a man falls off the chart. Decrease financial market rate vectors Man falls off the chart
Free with trial Dollar decrease line icon. linear style sign for mobile concept and web design. Financial crisis outline vector icon. Symbol, logo illustration. Vector graphics. Decrease financial market rate vectors Dollar decrease line icon
Free with trial Money loss vector illustration, flat cartoon cash with down arrow stocks graph, concept of financial crisis, market fall, bankruptcy, budget recession. Business crisis and teamwork concept. Decrease financial market rate vectors World financial crisis. Money loss vector illustration, flat cartoon cash with down arrow stocks graph, concept of financial crisis, market fall, bankruptcy, budget recession. Business crisis and teamwork concept.
Free with trial Money loss vector illustration in flat cartoon cash with down arrow stocks graph, concept of financial crisis, market fall bankruptcy or budget recession. Financial chart. Vector illustration. Decrease financial market rate vectors World financial crisis. Money loss vector illustration in flat cartoon cash with down arrow stocks graph, concept of financial crisis, market fall bankruptcy or budget recession. Financial chart. Vector illustration.
Free with trial Decrease of euro rate. 3D rendering. 3D background design. Decrease financial market rate illustrations Decrease of euro rate. 3D rendering
Free with trial A close-up of a stock market chart showing a sharp downturn. The orange line graph against a dark background with gridlines illustrates the volatility and potential risks in financial markets. The image captures the urgency and anxiety associated with market fluctuations. The "MA 1000" text is visib. Decrease financial market rate illustrations Stock Market Downturn. A close-up of a stock market chart showing a sharp downturn. The orange line graph against a dark background with gridlines illustrates the volatility and potential risks in financial markets. The image captures the urgency and anxiety associated with market fluctuations. The "MA 1000" text is visib
Free with trial Financial difficulties, decrease in value of business or company shares, stock market crash, economic crisis, business failure, loss of cash, lose investments, man points a magnifier to broken arrow. Decrease financial market rate vectors Man points to broken arrow. Financial difficulties, decrease in value of business or company shares, stock market crash, economic crisis, business failure, loss of cash, lose investments, man points a magnifier to broken arrow
Free with trial Dollar decrease vector icon. filled flat sign for mobile concept and web design. Dollar money down arrow glyph icon. Financial crisis symbol, logo illustration. Vector graphics. Decrease financial market rate vectors Dollar decrease vector icon
Free with trial Stock market crash concept. Broken chart arrow. Stock market growth and sudden drawdown. Financial chart that presents stock crisis. Business bankruptcy. Investment risks. Vector illustration. Decrease financial market rate vectors Stock market growth and sudden drawdown illustration. Stock market crash concept. Broken chart arrow. Stock market growth and sudden drawdown. Financial chart that presents stock crisis. Business bankruptcy. Investment risks. Vector illustration
Free with trial Loss of money, profit from investments and deposits, decrease in business value, financial or economic collapse, defeat or failure in the foreign exchange market, man falls from a broken dollar. Decrease financial market rate vectors Man falls from a broken dollar
Free with trial Financial difficulties, decrease in value of business or company shares, stock market crash, economic crisis, business failure and loss of cash, lose investments, a man falls off the broken arrow. Decrease financial market rate vectors Man falls off the broken arrow
Free with trial Financial and economic crisis illustration, vector. Coronavirus crisis. Economy stock market crash down. Market fall, Bankruptcy, Budget recession, Investment expenses, Bad economy reduction. Decrease financial market rate vectors World financial crisis. Financial and economic crisis illustration, vector. Coronavirus crisis. Economy stock market crash down. Market fall, Bankruptcy, Budget recession, Investment expenses, Bad economy reduction
Free with trial Financial crisis and bankrupt, recession and decrease chart of finance. Vector, illustration. descending graph, loss of savings, business bankruptcy, decline of the dollar currency. Decrease financial market rate vectors Financial crisis and bankrupt, recession and decrease chart of finance
Free with trial Cost or Price Reduction Icon Set with Simple Line Style. Business and Financial Illustration. Reduced Finance. Decrease Symbol. Decrease financial market rate vectors Cost or Price Reduction Icon Set with Simple Line Style. Business and Financial Illustration. Reduced Finance
Free with trial Percent decrease vector design. Consist of down arrow and percent sign, icon or symbol. Concept for percentage of interest rate, loss profit, stock price or discount. Editable line stroke 48x48 px. n. Decrease financial market rate vectors Percent decrease vector design, 48x48 pixel perfect and editable stroke. Percent decrease vector design. Consist of down arrow and percent sign, icon or symbol. Concept for percentage of interest rate, loss profit, stock price or discount. Editable line stroke 48x48 px.n
Free with trial Outline neon decrease arrow icon. Glowing neon decline chart sign, downward arrow pictogram in vivid color. Financial forecast, drop in shares, lesion and falling trend. Vector icon set, symbol for UI. Decrease financial market rate vectors Outline neon decrease arrow icon. Glowing neon decline chart sign, downward arrow pictogram in vivid colors. Outline neon decrease arrow icon. Glowing neon decline chart sign, downward arrow pictogram in vivid color. Financial forecast, drop in shares, lesion and falling trend. Vector icon set, symbol for UI
Free with trial Percent decrease vector design. Consist of down arrow and percent sign, icon or symbol. Concept for percentage of interest rate, loss profit, stock price or discount. Editable line stroke 48x48 px. n. Decrease financial market rate vectors Percent decrease vector design, 48x48 pixel perfect and editable stroke. Percent decrease vector design. Consist of down arrow and percent sign, icon or symbol. Concept for percentage of interest rate, loss profit, stock price or discount. Editable line stroke 48x48 px.n
Free with trial Percent decrease vector design. Consist of down arrow and percent sign, icon or symbol. Concept for percentage of interest rate, loss profit, stock price or discount. Editable line stroke 48x48 px. n. Decrease financial market rate vectors Percent decrease vector design, 48x48 pixel perfect and editable stroke. Percent decrease vector design. Consist of down arrow and percent sign, icon or symbol. Concept for percentage of interest rate, loss profit, stock price or discount. Editable line stroke 48x48 px.n
Free with trial Percent decrease vector design. Consist of down arrow and percent sign, icon or symbol. Concept for percentage of interest rate, loss profit, stock price or discount. Editable line stroke 48x48 px. n. Decrease financial market rate vectors Percent decrease vector design, 48x48 pixel perfect and editable stroke. Percent decrease vector design. Consist of down arrow and percent sign, icon or symbol. Concept for percentage of interest rate, loss profit, stock price or discount. Editable line stroke 48x48 px.n
Free with trial Percent decrease vector design. Consist of down arrow and percent sign, icon or symbol. Concept for percentage of interest rate, loss profit, stock price or discount. Editable line stroke 48x48 px. n. Decrease financial market rate vectors Percent decrease vector design, 48x48 pixel perfect and editable stroke. Percent decrease vector design. Consist of down arrow and percent sign, icon or symbol. Concept for percentage of interest rate, loss profit, stock price or discount. Editable line stroke 48x48 px.n
Free with trial A visual representation of a financial downturn or a reduction in rates. A golden coin with a percentage sign is shown with a downward arrow, symbolizing a decrease, recession, or a sale promotion. Decrease financial market rate vectors Financial Percentage Drop Symbol. A visual representation of a financial downturn or a reduction in rates. A golden coin with a percentage sign is shown with a. A visual representation of a financial downturn or a reduction in rates. A golden coin with a percentage sign is shown with a downward arrow, symbolizing a decrease, recession, or a sale promotion
Free with trial Percent decrease vector design. Consist of down arrow and percent sign, icon or symbol. Concept for percentage of interest rate, loss profit, stock price or discount. Editable line stroke 48x48 px. n. Decrease financial market rate vectors Percent decrease vector design, 48x48 pixel perfect and editable stroke. Percent decrease vector design. Consist of down arrow and percent sign, icon or symbol. Concept for percentage of interest rate, loss profit, stock price or discount. Editable line stroke 48x48 px.n
Free with trial Percent decrease vector design. Consist of down arrow and percent sign, icon or symbol. Concept for percentage of interest rate, loss profit, stock price or discount. Editable line stroke 48x48 px. n. Decrease financial market rate vectors Percent decrease vector design, 48x48 pixel perfect and editable stroke. Percent decrease vector design. Consist of down arrow and percent sign, icon or symbol. Concept for percentage of interest rate, loss profit, stock price or discount. Editable line stroke 48x48 px.n
Free with trial Percent decrease vector design. Consist of down arrow and percent sign, icon or symbol. Concept for percentage of interest rate, loss profit, stock price or discount. Editable line stroke 48x48 px. n. Decrease financial market rate vectors Percent decrease vector design, 48x48 pixel perfect and editable stroke. Percent decrease vector design. Consist of down arrow and percent sign, icon or symbol. Concept for percentage of interest rate, loss profit, stock price or discount. Editable line stroke 48x48 px.n
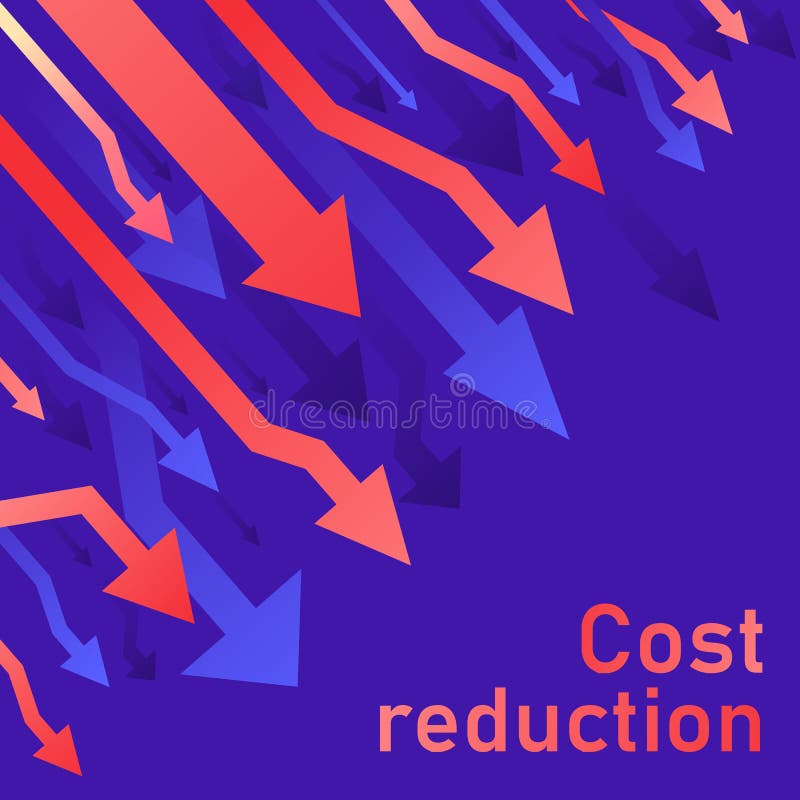
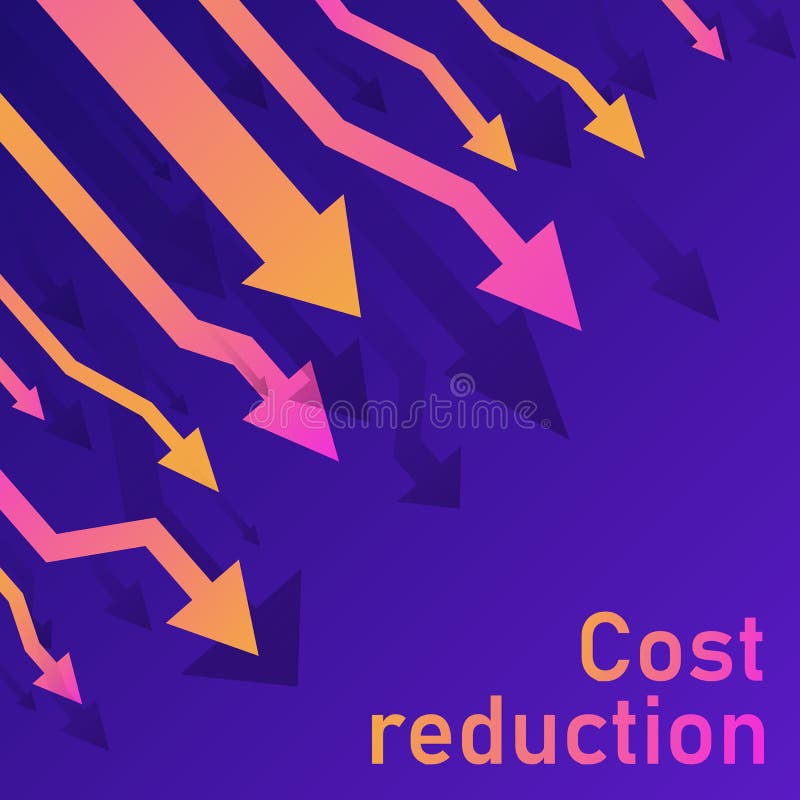
Free with trial Cost reduction concept. Business lost crisis decrease. Stock financial trade market diagram. Sales conversion idea thin line illustration. Blue purple background. Vector. Decrease financial market rate vectors Cost reduction crisis. Cost reduction concept. Business lost crisis decrease. Stock financial trade market diagram. Sales conversion idea thin line illustration. Blue purple background. Vector
Free with trial Cost reduction concept. Business lost crisis decrease. Stock financial trade market diagram. Sales conversion idea thin line illustration. Blue purple background. Vector. Decrease financial market rate vectors Cost reduction crisis. Cost reduction concept. Business lost crisis decrease. Stock financial trade market diagram. Sales conversion idea thin line illustration. Blue purple background. Vector
Free with trial Cost reduction concept. Business lost crisis decrease. Stock financial trade market diagram. Sales conversion idea thin line illustration. Blue purple background. Vector. Decrease financial market rate vectors Cost reduction crisis. Cost reduction concept. Business lost crisis decrease. Stock financial trade market diagram. Sales conversion idea thin line illustration. Blue purple background. Vector
Free with trial Graph of money loss. Low cost dollars. Crisis of economy with decrease sales and revenue. Icon of reduction of market and economic down. Financial bankruptcy. Infographic of inflation. Vector. Decrease financial market rate vectors Graph of money loss. Low cost dollars.
Free with trial Set Dollar rate decrease, Tearing money banknote, Global economic crisis and Safe icon. Vector. Decrease financial market rate illustrations Set Dollar rate decrease, Tearing money banknote, Global economic crisis and Safe icon. Vector
Free with trial Euro rate falling glyph icon. Statistics diagram with european currency sign. Silhouette symbol. Financial collapse. Negative space. Vector isolated illustration. Decrease financial market rate vectors Yen rate falling glyph icon. Euro rate falling glyph icon. Statistics diagram with european currency sign. Silhouette symbol. Financial collapse. Negative space. Vector isolated illustration
Free with trial Overheating of the stock market and falling concept. Financial arrow chart, line graph. Stock market crisis, drawdown or correction. Vector illustration. Decrease financial market rate vectors Overheating of the stock market and falling concept.
Free with trial Stock market crash concept. Broken chart arrow. Stock market growth and sudden drawdown. Financial chart that presents stock crisis. Business bankruptcy. Investment risks. Vector illustration. Decrease financial market rate vectors Stock market growth and sudden drawdown illustration. Stock market crash concept. Broken chart arrow. Stock market growth and sudden drawdown. Financial chart that presents stock crisis. Business bankruptcy. Investment risks. Vector illustration
Free with trial Fall, depreciation of the Bitcoin, decrease of the value of the cryptocurrency, rate in the form of arrows of different heights and colors. For financial companies, banks, currency exchange. Decrease financial market rate vectors Fall, depreciation of the Bitcoin, decrease of the value of cryptocurrency. Vector. Fall, depreciation of the Bitcoin, decrease of the value of the cryptocurrency, rate in the form of arrows of different heights and colors. For financial companies, banks, currency exchange
Free with trial Visualize financial concepts with this dynamic illustration showcasing currency exchange rates and market trends. Perfect for business presentations, financial reports, and investment strategies. Showcasing global market volatility and opportunities. Decrease financial market rate vectors Dollar and Euro currency exchange rate with upward and downward trends. Visualize financial concepts with this dynamic illustration showcasing currency exchange rates and market trends. Perfect for business presentations, financial reports, and investment strategies. Showcasing global market volatility and opportunities
Free with trial A dynamic image of a digital stock market ticker screen displaying financial data. The background is filled with red, downward-pointing arrows and negative numbers, symbolizing a bearish market, recession, or economic downturn. In stark contrast, a single, large, bright green arrow points upwards, representing growth, success, profit, and recovery. This powerful visual metaphor illustrates a single stock's success or a broader economic turnaround amidst widespread losses. It's perfect for concepts related to investment strategy, financial analysis, market volatility, and economic hope. Decrease financial market rate illustrations Stock Market Recovery and Growth Concept. A dynamic image of a digital stock market ticker screen displaying financial data. The background is filled with red, downward-pointing arrows and negative numbers, symbolizing a bearish market, recession, or economic downturn. In stark contrast, a single, large, bright green arrow points upwards, representing growth, success, profit, and recovery. This powerful visual metaphor illustrates a single stock's success or a broader economic turnaround amidst widespread losses. It's perfect for concepts related to investment strategy, financial analysis, market volatility, and economic hope.
Free with trial Set Isometric Bank building, Mobile stock trading, Dollar rate decrease and icon. Vector. Decrease financial market rate illustrations Set Isometric Bank building, Mobile stock trading, Dollar rate decrease and icon. Vector
Free with trial Business analysis icon. symbol with magnifying glass. dollar increase revenue. Money with arrow. finance cost. decrease rate economy stretching. lost crisis. reduction bankrupt. vector illustration. Decrease financial market rate vectors Business analysis icon. symbol with magnifying glass. dollar increase revenue. Money with arrow. finance cost. decrease rate econo
Free with trial Currency rate. Lira symbol and red arrow on buttons. Money appreciation concept. Default and bankruptcy. Decrease in foreign exchange reserves. Falling prices. 3d render. Decrease financial market rate illustrations Currency rate. Lira symbol and red arrow on buttons
Free with trial Currency rate. Euro symbol and red arrow on buttons. Money appreciation concept. Default and bankruptcy. Decrease in foreign exchange reserves. Falling prices. 3d render. Decrease financial market rate illustrations Currency rate. Euro symbol and red arrow on buttons
Free with trial Currency rate. Lari symbol and red arrow on buttons. Money appreciation concept. Default and bankruptcy. Decrease in foreign exchange reserves. Falling prices. 3d render. Decrease financial market rate illustrations Currency rate. Lari symbol and red arrow on buttons
Free with trial Currency rate. Baht symbol and red arrow on buttons. Money appreciation concept. Default and bankruptcy. Decrease in foreign exchange reserves. Falling prices. 3d render. Decrease financial market rate illustrations Currency rate. Baht symbol and red arrow on buttons
Free with trial Cost reduction concept. Business lost crisis decrease. Stock financial trade market diagram. Sales conversion idea thin line illustration. Blue purple background. Vector. Decrease financial market rate vectors Cost reduction crisis. Cost reduction concept. Business lost crisis decrease. Stock financial trade market diagram. Sales conversion idea thin line illustration. Blue purple background. Vector
Free with trial Cost reduction concept. Business lost crisis decrease. Stock financial trade market diagram. Sales conversion idea thin line illustration. Blue purple background. Vector. Decrease financial market rate vectors Cost reduction crisis. Cost reduction concept. Business lost crisis decrease. Stock financial trade market diagram. Sales conversion idea thin line illustration. Blue purple background. Vector
Free with trial Cost reduction concept. Business lost crisis decrease. Stock financial trade market diagram. Sales conversion idea thin line illustration. Blue purple background. Vector. Decrease financial market rate vectors Cost reduction crisis. Cost reduction concept. Business lost crisis decrease. Stock financial trade market diagram. Sales conversion idea thin line illustration. Blue purple background. Vector
Free with trial Abstract financial graph with a candlestick chart and a large downward arrow on a dark background with a world map. This image represents a stock market crash, bearish trend, and global economic crisis. The red and blue candles illustrate market volatility and a significant price drop. It's a powerful visual concept for topics like financial recession, investment risk, economic downturn, and business failure. Ideal for financial news, reports, presentations, and web design related to finance, trading, and the global economy. Decrease financial market rate illustrations Global Stock Market Crash and Bearish Trend. Abstract financial graph with a candlestick chart and a large downward arrow on a dark background with a world map. This image represents a stock market crash, bearish trend, and global economic crisis. The red and blue candles illustrate market volatility and a significant price drop. It's a powerful visual concept for topics like financial recession, investment risk, economic downturn, and business failure. Ideal for financial news, reports, presentations, and web design related to finance, trading, and the global economy.
Free with trial Set line Dollar rate decrease, Drop in crude oil price, Global economic crisis and icon. Vector. Decrease financial market rate vectors Set line Dollar rate decrease, Drop in crude oil price, Global economic crisis and icon. Vector
Free with trial Currency rate. Shekel symbol and red arrow on buttons. Money appreciation concept. Default and bankruptcy. Decrease in foreign exchange reserves. Falling prices. 3d render. Decrease financial market rate illustrations Currency rate. Shekel symbol and red arrow on buttons
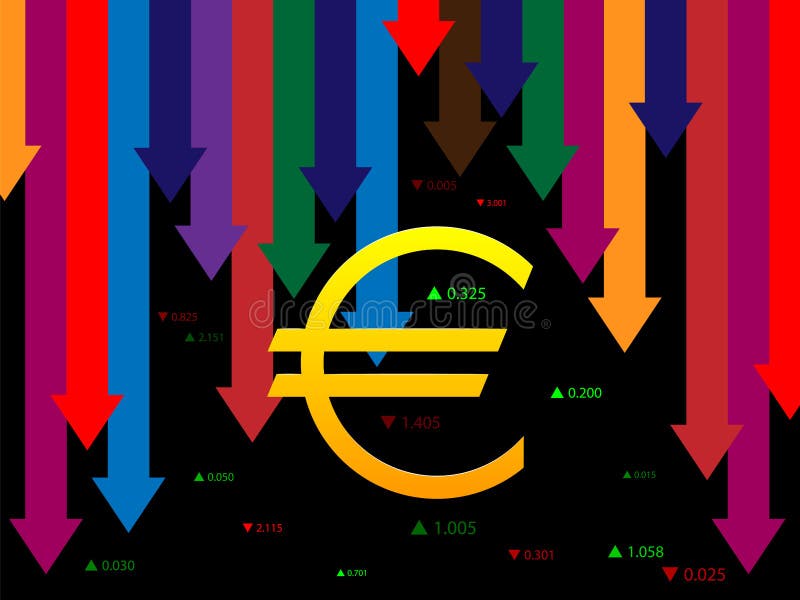
Free with trial Illustration - Fall, depreciation of the Euro, decrease of the value of the monetary unit, rate in the form of arrows of different heights and colors. For financial companies, banks, currency exchange. Decrease financial market rate vectors Fall, depreciation of the Euro, decrease of the value of the monetary unit. Vector. Illustration - Fall, depreciation of the Euro, decrease of the value of the monetary unit, rate in the form of arrows of different heights and colors. For financial companies, banks, currency exchange
Free with trial Currency rate. Hryvnia symbol and red arrow on buttons. Money appreciation concept. Default and bankruptcy. Decrease in foreign exchange reserves. Falling prices. 3d render. Decrease financial market rate illustrations Currency rate. Hryvnia symbol and red arrow on buttons
Free with trial Fall, depreciation of the Ruble, decrease of the value of the monetary unit, rate in the form of arrows of different heights and colors. For financial company, bank, currency exchange. Decrease financial market rate vectors Fall, depreciation of the Ruble, decrease of the value of the monetary unit. Vector. Fall, depreciation of the Ruble, decrease of the value of the monetary unit, rate in the form of arrows of different heights and colors. For financial company, bank, currency exchange
Free with trial Money loss sign in hands. Cash with down arrow stocks graph, concept of financial crisis, market fall, bankruptcy. Vector stock illustration. Decrease financial market rate vectors Money loss sign in hands. Cash with down arrow stocks graph, concept of financial crisis, market fall, bankruptcy
Free with trial Currency rate. Yuan, yen symbol and red arrow on buttons. Money appreciation concept. Default and bankruptcy. Decrease in foreign exchange reserves. Falling prices. 3d render. Decrease financial market rate illustrations Currency rate. Yuan, yen symbol and red arrow on buttons
Free with trial Illustration - Fall, depreciation of the Dollar, decrease of the value of the monetary unit, rate in the form of arrows of different heights and colors. For financial company, bank, currency exchange. Decrease financial market rate vectors Fall, depreciation of the Dollar, decrease of the value of the monetary unit. Vector. Illustration - Fall, depreciation of the Dollar, decrease of the value of the monetary unit, rate in the form of arrows of different heights and colors. For financial company, bank, currency exchange
Free with trial Set Employee dismissal, Mobile stock trading, Dollar rate decrease and on seamless pattern. Vector. Decrease financial market rate vectors Set Employee dismissal, Mobile stock trading, Dollar rate decrease and on seamless pattern. Vector
Free with trial Red arrow pointing down and coins showing stock market crash, investment loss, and financial crisis. Decrease financial market rate illustrations Stock market crash showing a red downward arrow and gold coins. Red arrow pointing down and coins showing stock market crash, investment loss, and financial crisis
Free with trial Set Dollar rate decrease, Briefcase, Glass money jar with coin and Global economic crisis icon. Vector. Decrease financial market rate illustrations Set Dollar rate decrease, Briefcase, Glass money jar with coin and Global economic crisis icon. Vector
Free with trial Currency rate. Pound sterling symbol and red arrow on buttons. Money appreciation concept. Default and bankruptcy. Decrease in foreign exchange reserves. Falling prices. 3d render. Decrease financial market rate illustrations Currency rate. Pound sterling symbol and red arrow on buttons
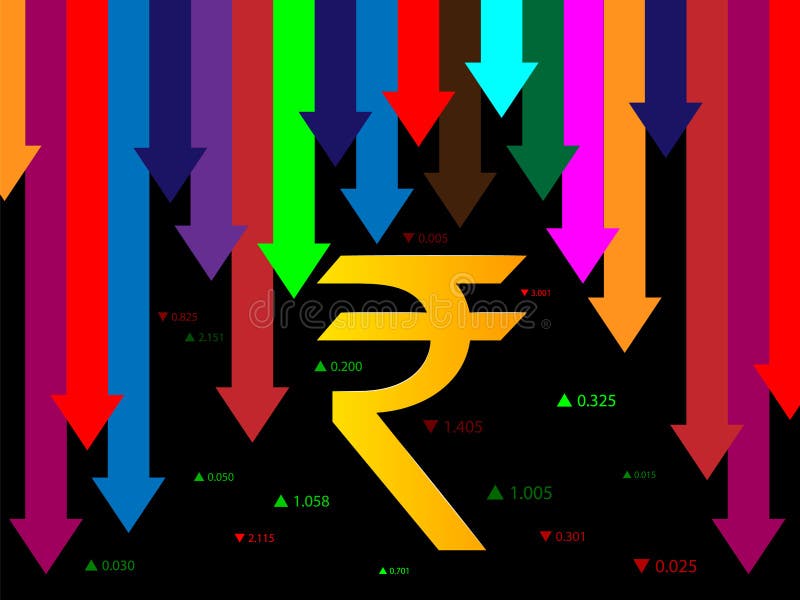
Free with trial Fall, depreciation of the Indian Rupee, decrease of the value of the monetary unit, rate in the form of arrows of different heights and colors. For financial companies, banks, currency exchange. Decrease financial market rate vectors Fall, depreciation of the Indian Rupee, decrease of the value of the monetary unit. Vector. Fall, depreciation of the Indian Rupee, decrease of the value of the monetary unit, rate in the form of arrows of different heights and colors. For financial companies, banks, currency exchange
Free with trial Set line Dollar rate decrease, Pie chart infographic and Global economic crisis news. Business infographic template. Vector. Decrease financial market rate illustrations Set line Dollar rate decrease, Pie chart infographic and Global economic crisis news. Business infographic template
Free with trial Set line Dollar rate decrease, Global economic crisis, Drop in crude oil price and icon. Vector. Decrease financial market rate vectors Set line Dollar rate decrease, Global economic crisis, Drop in crude oil price and icon. Vector
Free with trial Set line Mobile stock trading Dollar rate decrease and Storm icon. Vector. Decrease financial market rate illustrations Set line Mobile stock trading, Dollar rate decrease and Storm icon. Vector
Free with trial Set line Global economic crisis, Dollar rate decrease and Broken piggy bank on seamless pattern. Vector. Decrease financial market rate illustrations Set line Global economic crisis, Dollar rate decrease and Broken piggy bank on seamless pattern. Vector
Free with trial Business analysis icon. symbol with magnifying glass. dollar increase revenue. Money with arrow. finance cost. decrease rate economy stretching. lost crisis. reduction bankrupt. vector illustration. Decrease financial market rate vectors Business analysis icon. symbol with magnifying glass. dollar increase revenue. Money with arrow. finance cost. decrease rate econo
Free with trial Set of Finance icons, such as Debit card, Column chart, Loan percent icons. UI phone app screens with people. Growth chart line symbols. Wallet with credit card, Financial graph, Decrease rate. Vector. Decrease financial market rate vectors Set of Finance icons, such as Debit card, Column chart, Loan percent. Vector. Set of Finance icons, such as Debit card, Column chart, Loan percent icons. UI phone app screens with people. Growth chart line symbols. Wallet with credit card, Financial graph, Decrease rate. Vector
Free with trial Set line Contract money and pen, Global economic crisis, Dollar rate decrease and Briefcase. Glowing neon icon. Vector. Decrease financial market rate vectors Set line Contract money and pen, Global economic crisis, Dollar rate decrease and Briefcase. Glowing neon icon. Vector
Free with trial Digital business economy for financial stock market crash,with background candle stick. Decrease financial market rate vectors Illustration to stop financial crisis business strategy economy. Digital business economy for financial stock market crash,with background candle stick
Free with trial Smartphone with a falling financial graph in the palm of your hand. The concept of a crisis in the market and cheaper assets. Low income business illustration. Cryptocurrency fall monitoring. Decrease financial market rate vectors Smartphone with a falling financial graph in the palm of your hand.
Free with trial Set Dollar rate decrease, Global economic crisis, Mobile stock trading and Storm icon. Vector. Decrease financial market rate vectors Set Dollar rate decrease, Global economic crisis, Mobile stock trading and Storm icon. Vector
Free with trial A minimalist line icon illustration depicting a dollar coin with a downward arrow, representing financial decrease or loss. Decrease financial market rate vectors Simple Line Dollar Decrease Downward Arrow Business Finance Icon. A minimalist line icon illustration depicting a dollar coin with a downward arrow, representing financial decrease or loss.
Free with trial Set line Dollar rate decrease, Global economic crisis, Mobile stock trading and Bank building icon. Vector. Decrease financial market rate illustrations Set line Dollar rate decrease, Global economic crisis, Mobile stock trading and Bank building icon. Vector
Free with trial A red, dotted world globe is overlaid with a declining stock market chart, symbolizing a global economic downturn. The image conveys financial crisis and market volatility. Decrease financial market rate illustrations Global Market Downturn: Red World Globe with Declining Stock Chart. A red, dotted world globe is overlaid with a declining stock market chart, symbolizing a global economic downturn. The image conveys financial crisis and market volatility
Free with trial Set Gold bars, Employee dismissal, Global economic crisis and Dollar rate decrease icon. Vector. Decrease financial market rate vectors Set Gold bars, Employee dismissal, Global economic crisis and Dollar rate decrease icon. Vector
Free with trial Yen Rate Decrease Graphic icon. Mobile app, printing, web site icon. Simple element sing. Monochrome Yen Rate Decrease Graphic icon illustration. Decrease financial market rate illustrations Yen Rate Decrease Graphic icon. Mobile app, printing, web site icon. Simple element sing. Monochrome Yen Rate Decrease Graphic ico
Free with trial Green percentage symbol with a down arrow shows rate decline on clean white background Representing financial and economic concepts. Decrease financial market rate illustrations Green Percentage Sign with Down Arrow Indicating Decrease on White. Green percentage symbol with a down arrow shows rate decline on clean white background Representing financial and economic concepts
Free with trial Set line Gold bars Dollar rate decrease Global economic crisis Drop in crude oil price Money bomb dollar and Pie chart infographic icon. Vector. Decrease financial market rate illustrations Set line Gold bars, Dollar rate decrease, Global economic crisis, Drop in crude oil price, Money bomb dollar, and Pie. Set line Gold bars Dollar rate decrease Global economic crisis Drop in crude oil price Money bomb dollar and Pie chart infographic icon. Vector.