Free with trial GDP word, rising and falling arrows and coins. Gross domestic product concept. 3D illustration. Decrease financial market rate illustrations GDP word, rising and falling arrows and coins. Gross domestic product concept. 3D illustration
Free with trial Economic Loss icon logo sign vector outline in black and white color. Decrease financial market rate vectors Economic Loss logo sign vector outline. Economic Loss icon logo sign vector outline in black and white color
Free with trial Crisis icon isolated on white background. Vector illustration. Eps 10. Decrease financial market rate vectors Crisis icon isolated on white background. Vector illustration
Free with trial Lower cost icon Vector symbol or sign set collection in black and white outline. Decrease financial market rate vectors Lower cost icon mark in filled style. Lower cost icon Vector symbol or sign set collection in black and white outline
Free with trial Sale Lure Concept. Red Cube with Percent Symbol Cutched by Fishing Hook on a white background. 3d Rendering. Decrease financial market rate illustrations Sale Lure Concept. Red Cube with Percent Symbol Cutched by Fishing Hook. 3d Rendering. Sale Lure Concept. Red Cube with Percent Symbol Cutched by Fishing Hook on a white background. 3d Rendering
Free with trial A human hand places a wooden block featuring a percentage symbol with a downward arrow above a row of blocks spelling the word cost on a surface. Decrease financial market rate illustrations Hand placing wooden block with percentage down arrow over cost text aspect ratio 9 16. A human hand places a wooden block featuring a percentage symbol with a downward arrow above a row of blocks spelling the word cost on a surface.
Free with trial A green dollar bill with a green arrow pointing to the right. The dollar bill is being used to pay for something. Decrease financial market rate vectors A green dollar bill with a green arrow pointing to the right
Free with trial Percent growth and decline outline icon. Percentage arrow up and down sign symbol vector. Decrease financial market rate vectors Percent growth and decline outline icon. Percentage arrow up and down sign symbol
Free with trial Dollar arrow up and down icon isolated on white background. USD growth and decline sign symbol vector. Decrease financial market rate vectors Dollar arrow up and down icon isolated on white background. USD growth and decline sign symbol
Free with trial A red 3D percentage symbol next to a white 3D downward pointing arrow. Isolated on a transparent background. Decrease financial market rate vectors Red percentage sign and white down arrow isolated on a transparent background image. A red 3D percentage symbol next to a white 3D downward pointing arrow. Isolated on a transparent background
Free with trial Percent up and down outline icon. Percentage arrow growth and decline sign symbol vector. Decrease financial market rate vectors Percent up and down outline icon. Percentage arrow growth and decline sign symbol
Free with trial Three green arrows pointing downwards, each featuring a white percentage sign. This imagery signifies financial decline, price reduction, or decreasing interest rates, often associated with sales or economic trends. Decrease financial market rate illustrations Green downward arrows with percentage signs symbolizing falling prices or interest rates. Three green arrows pointing downwards, each featuring a white percentage sign. This imagery signifies financial decline, price reduction, or decreasing interest rates, often associated with sales or economic trends
Free with trial A glossy green downward-pointing arrow featuring a white percentage symbol signifies a decline in rates, prices, or values, ideal for financial or economic contexts. Decrease financial market rate illustrations Green downward arrow with percentage symbol signaling decreasing prices or interest rates. A glossy green downward-pointing arrow featuring a white percentage symbol signifies a decline in rates, prices, or values, ideal for financial or economic contexts
Free with trial Percent arrow up and down icon on black circle. Percentage growth and decline outline sign symbol vector. Decrease financial market rate vectors Percent arrow up and down icon on black circle. Percentage growth and decline outline sign symbol
Free with trial Cost reduction icon set. Vector image isolated on white background. Decrease financial market rate illustrations Cost reduction icon set. Vector image isolated on white background
Free with trial Percentage sign from uneven stripes isolated on white background. Decrease financial market rate vectors Percentage sign from uneven stripes isolated
Free with trial Crisis Bankrupt Crash Building Outline Style Icon, Logo, and illustration Vector. Decrease financial market rate vectors Crisis Bankrupt Crash Building Outline Style Icon, Logo, Vector. Crisis Bankrupt Crash Building Outline Style Icon, Logo, and illustration Vector
Free with trial Cost reduction icon, vector flat dollar and money reduce symbol. Decrease financial market rate vectors Cost reduction icon, vector flat dollar reduce symbol. Cost reduction icon, vector flat dollar and money reduce symbol
Free with trial Stacked cubes with red arrow down symbols showing step by step decreasing trend and negative growth. Generative AI. Decrease financial market rate illustrations Stacked cubes with red arrow down symbols showing step by step decreasing trend and negative growth
Free with trial Flat hand showing phone with bitcoin graph going down. Decrease financial market rate vectors Hand showing phone with bitcoin graph going down
Free with trial A red 3D percentage symbol is positioned next to a white 3D arrow pointing downwards. Isolated on a transparent background. Decrease financial market rate vectors Red percentage symbol with white down arrow isolated on a transparent background. A red 3D percentage symbol is positioned next to a white 3D arrow pointing downwards. Isolated on a transparent background
Free with trial Percent growth and decline arrow icon on black circle. Percentage up and down arrows vector concept. Decrease financial market rate vectors Percent growth and decline arrow icon on black circle. Percentage up and down arrows concept
Free with trial World economic crisis concept , 3d rendering. Decrease financial market rate illustrations World economic crisis concept
Free with trial Loss business concept isolated on white background. Vector illustration. Eps 10. Decrease financial market rate vectors Loss business concept isolated on white background. Vector illustration
Free with trial Economic Loss icon outline collection or set in black and white. Decrease financial market rate vectors Economic Loss icon outline collection in black. Economic Loss icon outline collection or set in black and white
Free with trial Us dollar down icon set. vector. Decrease financial market rate vectors Us dollar down icon set. vector
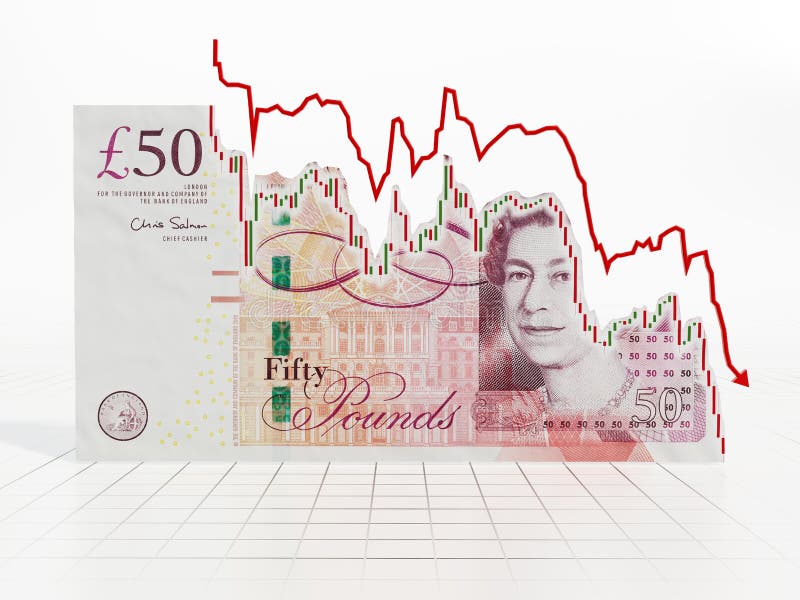
Free with trial Falling Pound or Sterling value. 3D illustration. Decrease financial market rate illustrations Falling Pound or Sterling value. 3D illustration
Free with trial Falling Pound or Sterling value. 3D illustration. Decrease financial market rate illustrations Falling Pound or Sterling value. 3D illustration
Free with trial A red arrow pointing downwards with a white percentage symbol on its surface. Isolated on a transparent background. Decrease financial market rate vectors Red Arrow with Percentage Symbol Pointing Down isolated on a transparent background. A red arrow pointing downwards with a white percentage symbol on its surface. Isolated on a transparent background
Free with trial Red arrow going down isolated, 3D rendering. Decrease financial market rate illustrations Red arrow going down isolated
Free with trial Percentage arrow up and down icon on black circle. Percent growth and decline sign symbol vector. Decrease financial market rate vectors Percentage arrow up and down icon on black circle. Percent growth and decline sign symbol
Free with trial Three green arrows pointing downwards, each displaying a white percentage symbol. Isolated on a transparent background. Decrease financial market rate vectors Three Green Downward Arrows with Percent Symbol isolated on a transparent background. Three green arrows pointing downwards, each displaying a white percentage symbol. Isolated on a transparent background
Free with trial Empty office spaces are a stark visual representation of the current economic downturn. The impact is widespread, affecting corporate growth and employment across various sectors. Reduced business activity, coupled with rising interest rates and inflation, has led to a significant decrease in demand for office space. Companies are scaling back operations, consolidating teams, and embracing. Decrease financial market rate illustrations Empty Office Buildings Signal Recession Economic Downturn Impacts Corporate Growth and Employment. Empty office spaces are a stark visual representation of the current economic downturn. The impact is widespread, affecting corporate growth and employment across various sectors. Reduced business activity, coupled with rising interest rates and inflation, has led to a significant decrease in demand for office space. Companies are scaling back operations, consolidating teams, and embracing
Free with trial Wooden house model with a percentage sign. Generative AI. Decrease financial market rate illustrations Wooden house model with a percentage sign
Free with trial Three red arrows with white percent symbols descend diagonally against a dark background. Isolated on a transparent background. Decrease financial market rate vectors Three red arrows with percent signs pointing down isolated on a transparent background. Three red arrows with white percent symbols descend diagonally against a dark background. Isolated on a transparent background
Free with trial Percent up and down icon isolated on white background. Percentage arrow growth and decline sign symbol vector. Decrease financial market rate vectors Percent up and down icon isolated on white background. Percentage arrow growth and decline sign symbol
Free with trial Black and White Vector Icons. Stack of Money and Up and Down Arrows. Business and Finance. Accounting Concept. Decrease financial market rate vectors Profit and Loss icons. Black and White Vector Icons. Stack of Money and Up and Down Arrows. Business and Finance. Accounting Concept
Free with trial Dollar fall icon design. Vector illustration, flat design. Isolated. Decrease financial market rate vectors Dollar fall icon design. Vector illustration, flat design.
Free with trial Progress or drop: golden coins stacks over white. Decrease financial market rate illustrations Progress or drop: golden coins stacks
Free with trial Real Estate Investment, Rising Interest Rates, Inflation, and Banking System Volatility, Generated by AI. Decrease financial market rate illustrations Real Estate Investment, Rising Interest Rates, Inflation, and Banking System Volatility
Free with trial Dollar arrow icons on white background. Money, finance banking vector illustration. Decrease financial market rate illustrations Dollar arrow icons on white background. Money, finance banking vector
Free with trial Economic Loss icon Black line art vector in black and white outline set collection sign. Decrease financial market rate vectors Economic Loss icon Black line art vector
Free with trial Large set of line drawn black and white Discount tags and labels for Sales and Bargain concepts, vector illustration. Decrease financial market rate vectors Large set of Discount tags and labels. Large set of line drawn black and white Discount tags and labels for Sales and Bargain concepts, vector illustration
Free with trial Stylized vector graphic featuring an upward arrow and percentage sign, connected by lines, demonstrating rising performance and decreasing rates against a dark background. Decrease financial market rate vectors Rising Performance and Decreasing Costs: Stylized Arrow and Percentage Icons Illustrating Financial Trends. Stylized vector graphic featuring an upward arrow and. Stylized vector graphic featuring an upward arrow and percentage sign, connected by lines, demonstrating rising performance and decreasing rates against a dark background.
Free with trial Progress or success: golden coins stacks over grey background. Decrease financial market rate illustrations Progress or success: golden coins stacks
Free with trial Growth or recession: golden coins stacks over white. Decrease financial market rate illustrations Growth or recession: golden coins stacks
Free with trial Economy fall icon design. Vector illustration, flat design. Isolated. Decrease financial market rate vectors Economy fall icon design. Vector illustration, flat design.
Free with trial Interest icon or logo design isolated sign symbol vector illustration - high quality line style vector icon suitable for designers, web developers, displays and websites. Decrease financial market rate vectors Interest Icon
Free with trial Thin line cost down like lower price. concept of prediction recession in global international statistics. flat outline trend simple currency logotype art design infographic element isolated on white. Decrease financial market rate vectors Thin line cost down like lower price
Free with trial Vector Icon of Stacks of Money and Up and Down Arrows. Business and Finance. Accounting Concept. Decrease financial market rate vectors Profit and Loss Colored Icon. Vector Icon of Stacks of Money and Up and Down Arrows. Business and Finance. Accounting Concept
Free with trial Cardboard box with percentage decreases cost graphic vector illustration. Decrease financial market rate vectors Cardboard box with percentage decreases cost graphic vector illustration
Free with trial Red arrow graph drop arrow down Money losing. Stock crisis finance icon neon glow vector illustration concept. Decrease financial market rate vectors Red arrow graph drop arrow down Money losing. Stock crisis finance icon neon glow concept. Red arrow graph drop arrow down Money losing. Stock crisis finance icon neon glow vector illustration concept
Free with trial Graph going Up and Down sign with green and red arrows vector. Flat design vector illustration concept of sales bar chart symbol icon with arrow moving down and sales bar chart with arrow moving up. Decrease financial market rate vectors Graph going Up and Down sign with green and red arrows vector. Flat design vector illustration concept of sales bar chart symbol. Graph going Up and Down sign with green and red arrows vector. Flat design vector illustration concept of sales bar chart symbol icon with arrow moving down and sales bar chart with arrow moving up.
Free with trial Broken trend line with arrow on the end is going down, 3d illustration on white background. Decrease financial market rate illustrations Broken trend line with arrow on the end is going down
Free with trial Global economic slowdown impacts finance and business markets with inflation and recession risks creating crisis in economy worldwide. Generative AI. Decrease financial market rate illustrations Global economic slowdown impacts finance and business markets with inflation and recession risks creating crisis in economy
Free with trial Loss business concept isolated on white background. Vector illustration. Eps 10. Decrease financial market rate vectors Loss business concept isolated on white background. Vector illustration
Free with trial Loss business concept isolated on white background. Vector illustration. Eps 10. Decrease financial market rate vectors Loss business concept isolated on white background. Vector illustration
Free with trial Illustration of a falling currency, and two men trying to stabilise it. The devaluation of US dollar sign during recession time. Decrease financial market rate vectors Two men holding the falling currency. Illustration of a falling currency, and two men trying to stabilise it. The devaluation of US dollar sign during recession time.
Free with trial Downward trending arrow is pointing to a credit card, representing the concept of economic recession. Decrease financial market rate illustrations Big arrow pointing down over credit card showing economic crisis. Downward trending arrow is pointing to a credit card, representing the concept of economic recession
Free with trial Inflation expectations cycle set. Economics crisis and value of money decline implications. High inflation drives up inflation expectations that driving up inflation. Flat vector illustration. Decrease financial market rate vectors Inflation expectations cycle set. Economics crisis and value of money
Free with trial Deflation line icon. Economic crisis sign. Vector illustration. Decrease financial market rate vectors Deflation line icon. Economic crisis sign
Free with trial Illustration of a falling currency, and two men trying to stabilise it. The devaluation of euro sign during recession time. Decrease financial market rate vectors Falling of euro during recession time. Illustration of a falling currency, and two men trying to stabilise it. The devaluation of euro sign during recession time.
Free with trial Cost reduction line icon set isolated on white background. Vector illustration. Decrease financial market rate vectors Cost reduction line icon set isolated on white background. Vector
Free with trial Illustration of a falling currency, and two men trying to stabilise it. Depreciation of yen during Recession crisis. Decrease financial market rate vectors Falling Japanese Yen during recession. Illustration of a falling currency, and two men trying to stabilise it. Depreciation of yen during Recession crisis.
Free with trial This captivating 3D image portrays the intriguing concept of food inflation in a surreal and thought-provoking manner. Instead of the typical visual representation of rising prices, this unique perspective depicts shrinking food items, suggesting a decrease in cost. The imagery is not literal, but rather a symbolic representation of the economic climate. The shrinking fruits and vegetables,. Decrease financial market rate illustrations Visualizing Economic Growth 3D Food Inflation Depicts Shrinking Prices and a Booming Economy Through Surreal Imagery. This captivating 3D image portrays the intriguing concept of food inflation in a surreal and thought-provoking manner. Instead of the typical visual representation of rising prices, this unique perspective depicts shrinking food items, suggesting a decrease in cost. The imagery is not literal, but rather a symbolic representation of the economic climate. The shrinking fruits and vegetables,
Free with trial Capital increase concept vector icon design, 48x48 pixel perfect and editable stroke. Decrease financial market rate vectors Capital increase icon. Capital increase concept vector icon design, 48x48 pixel perfect and editable stroke
Free with trial Black four arrows pointing downwards showing crisis in charts. Decrease financial market rate vectors Arrows pointing down as a symbol of crisis. Black four arrows pointing downwards showing crisis in charts
Free with trial Business sales and discount, vector linear icons set. Sale management. Coupon, percent ribbon, online buying, surprise present and more. Isolated collection of discounts for websites and shop. Decrease financial market rate vectors Business, sale, discount, vector, linear, icons, set, management, icon, percent, promotion, coupon, line, tag, cut. Business sales and discount, vector linear icons set. Sale management. Coupon, percent ribbon, online buying, surprise present and more. Isolated collection of discounts for websites and shop.
Free with trial Increase Icon. Enhancement Symbol, Applied for Info Graphics, Design Elements, Websites, Presentations, and Application - Vector. Decrease financial market rate illustrations Increase Icon. EnhancIncrease Icon. Increase Icon. Enhancement Symbol, Applied for Info Graphics, Design Elements, Websites, Presentations, and Application - Vector.
Free with trial Two adjacent panels display a line graph icon with dual zigzagging lines and circular data points. On the left, the icon is black on a white background. On the right, it's white on a dark background. Both icons feature the line graph at a 45-degree angle, suggesting an increase in data points, with round nodes indicating specific values along the line. The simplistic design focuses on contrast and clarity, ideal for visual representation in data analysis or presentation templates. Decrease financial market rate vectors Increase Icon. Solid glyph series icon. Two adjacent panels display a line graph icon with dual zigzagging lines and circular data points. On the left, the icon is black on a white background. On the right, it's white on a dark background. Both icons feature the line graph at a 45-degree angle, suggesting an increase in data points, with round nodes indicating specific values along the line. The simplistic design focuses on contrast and clarity, ideal for visual representation in data analysis or presentation templates.
Free with trial Coins and house. has an illustration of interest concept of calculating interest payments. planning savings money of coins to buy a home concept for property, mortgage, invest. Decrease financial market rate illustrations Coins and house. has an illustration of interest concept of calculating interest payments. planning savings money of coins to buy
Free with trial Rise icon sign vector,Symbol, logo illustration for web and mobile. Decrease financial market rate vectors Rise vector icon sign symbol. Rise icon sign vector,Symbol, logo illustration for web and mobile
Free with trial Economy crisis icon logo sign vector outline in black and white color. Decrease financial market rate vectors Economy crisis icon symbol set collection. Economy crisis simple vector sign bundle. Economy crisis icon logo sign vector outline in black and white color
Free with trial Linear hand with price or cost drop icon. concept of non effective expense or bankrupt sign. lineart simple trendy modern stats logotype graphic stroke art infographic design element isolated on white. Decrease financial market rate vectors Linear hand with price or cost drop icon
Free with trial Lower price. Text effect design with modern colors and 3D font look. Decrease financial market rate vectors Lower price. Text effect with modern colors and 3D font look
Free with trial Lower price. Text effect design with modern colors and 3D font look. Decrease financial market rate vectors Lower price. Text effect with modern colors and 3D font look
Free with trial Lower price. Text effect design with modern colors and 3D font look. Decrease financial market rate vectors Lower price. Text effect with modern colors and 3D font look
Free with trial The collapse of world stock markets. Vector illustration. Decrease financial market rate vectors Black Monday. The collapse of world stock markets. Vector illustration.
Free with trial Crisis Bankrupt Punch Bank Glyph Style Icon, Logo, and illustration Vector. Decrease financial market rate vectors Crisis Bankrupt Punch Bank Glyph Style Icon, Logo, Vector. Crisis Bankrupt Punch Bank Glyph Style Icon, Logo, and illustration Vector
Free with trial Cost reduction icon - vector illustration. Decrease financial market rate illustrations Cost reduction icon. Vector illustration