Free with trial Euro down and up icon. Europe currency decrease and increase sign symbol vector. Decrease graph icon vectors Euro down and up icon. Europe currency decrease and increase sign symbol
Free with trial Handdrawn outline style decrease chart with exclamation mark attention icon. Symbol for warning and risk of losing the income. Decrease graph icon vectors Handdrawn Outline Decrease Chart with Exclamation Mark Attention Icon. Handdrawn outline style decrease chart with exclamation mark attention icon. Symbol for warning and risk of losing the income.
Free with trial Decrease vector icon on the white background. EPS 10. Decrease graph icon vectors Decrease thin line vector icon set. Decrease vector icon on the white background. EPS 10
Free with trial Up and down percent icon. Increase and decrease percentage sign. Growth and decline symbol vector. Decrease graph icon vectors Up and down percent icon. Increase and decrease percentage sign. Growth and decline symbol
Free with trial Financial Graph Decline icon vector image. Suitable for mobile application web application and print media. Decrease graph icon vectors Financial Graph Decline icon vector image.
Free with trial A black outline vector icon of a light bulb with a downward trend graph, symbolizing idea decline, a failing concept, or innovation setback. Ideal for risk assessment, project analysis, or problem identification. Represents a decrease in viability or impact, a clear visual for negative trends in creative or business endeavors. vector design Generative AI. Decrease graph icon vectors Idea Decline Icon: Failing Concepts Innovation Setback, vector design Generative AI. A black outline vector icon of a light bulb with a downward trend graph, symbolizing idea decline, a failing concept, or innovation setback. Ideal for risk assessment, project analysis, or problem identification. Represents a decrease in viability or impact, a clear visual for negative trends in creative or business endeavors. vector design Generative AI
Free with trial Up and down arrow icon in rounded shape. Increase and decrease illustration concept. Decrease graph icon vectors Up and down arrow icon in rounded shape. Increase and decrease concept. Up and down arrow icon in rounded shape. Increase and decrease illustration concept
Free with trial Line art style icon of a smartphone displaying a decreasing graph, representing negative market trends. Decrease graph icon vectors Smartphone showing decreasing graph icon outline vector. Line art style icon of a smartphone displaying a decreasing graph, representing negative market trends
Free with trial Report line icon. Neumorphic, Green gradient, 3d pin buttons. Column graph, pie chart sign. Market analytics symbol. Line icons. Neumorphic buttons with outline signs. Vector. Decrease graph icon vectors Report line icon. Column graph, pie chart sign. Line icons. Vector. Report line icon. Neumorphic, Green gradient, 3d pin buttons. Column graph, pie chart sign. Market analytics symbol. Line icons. Neumorphic buttons with outline signs. Vector
Free with trial Statistics line icon. Neumorphic, Blue gradient, 3d pin buttons. Column chart sign. Growth graph diagram symbol. Line icons. Neumorphic buttons with outline signs. Vector. Decrease graph icon illustrations Statistics line icon. Column graph chart sign. Line icons. Vector. Statistics line icon. Neumorphic, Blue gradient, 3d pin buttons. Column chart sign. Growth graph diagram symbol. Line icons. Neumorphic buttons with outline signs. Vector
Free with trial Statistics line icon. Neumorphic, Blue gradient, 3d pin buttons. Column chart sign. Growth graph diagram symbol. Line icons. Neumorphic buttons with outline signs. Vector. Decrease graph icon vectors Statistics line icon. Column graph chart sign. Line icons. Vector. Statistics line icon. Neumorphic, Blue gradient, 3d pin buttons. Column chart sign. Growth graph diagram symbol. Line icons. Neumorphic buttons with outline signs. Vector
Free with trial Graph phone line icon. Halftone dotted pattern. Gradient icon with grain shadow. Column chart sign. Growth diagram symbol. Line graph phone icon. Various designs. Vector. Decrease graph icon vectors Graph phone line icon. Column chart sign. Halftone dotted pattern. Vector. Graph phone line icon. Halftone dotted pattern. Gradient icon with grain shadow. Column chart sign. Growth diagram symbol. Line graph phone icon. Various designs. Vector
Free with trial Report line icon. Neumorphic, Flat shadow, 3d buttons. Column graph, pie chart sign. Market analytics symbol. Line report icon. Social media icons. Vector. Decrease graph icon vectors Report line icon. Column graph, pie chart sign. Neumorphic buttons. Vector. Report line icon. Neumorphic, Flat shadow, 3d buttons. Column graph, pie chart sign. Market analytics symbol. Line report icon. Social media icons. Vector
Free with trial Diagram chart line icon. Neumorphic, Flat shadow, 3d buttons. Analytics graph sign. Market analytics symbol. Line analytics chart icon. Social media icons. Vector. Decrease graph icon vectors Diagram chart line icon. Analytics graph sign. Neumorphic buttons. Vector. Diagram chart line icon. Neumorphic, Flat shadow, 3d buttons. Analytics graph sign. Market analytics symbol. Line analytics chart icon. Social media icons. Vector
Free with trial Downward arrow outline icon set. Decrease direction symbol. Reduction indicator sign. Vector. Decrease graph icon vectors Downward arrow outline icon set. Decrease direction symbol. Reduction indicator sign. Vector
Free with trial Social media marketing graph showing decrease with thumbs up icons, isometric vector illustration. Decrease graph icon vectors Graph showing decrease in social media marketing with thumbs up icons. Social media marketing graph showing decrease with thumbs up icons, isometric vector illustration
Free with trial Report timer line icon. Halftone dotted pattern. Gradient icon with grain shadow. Column graph sign. Growth diagram chart symbol. Line report timer icon. Various designs. Vector. Decrease graph icon vectors Report timer line icon. Column graph sign. Halftone dotted pattern. Vector. Report timer line icon. Halftone dotted pattern. Gradient icon with grain shadow. Column graph sign. Growth diagram chart symbol. Line report timer icon. Various designs. Vector
Free with trial Arrow percent icon set on black circle. Increase and decrease percentage sign symbol vector. Decrease graph icon vectors Arrow percent icon set on black circle. Increase and decrease percentage sign symbol
Free with trial Report document line icon. Continuous line big heart. Column graph sign. Growth diagram, pie chart symbol. 3d hearts in heart shaped loop. Report document single line ribbon. Vector. Decrease graph icon vectors Report document line icon. Column graph sign. Continuous line big heart. Vector. Report document line icon. Continuous line big heart. Column graph sign. Growth diagram, pie chart symbol. 3d hearts in heart shaped loop. Report document single line ribbon. Vector
Free with trial Presentation board line icon. Neumorphic, Purple gradient, 3d pin buttons. Column graph sign. Growth diagram symbol. Line icons. Neumorphic buttons with outline signs. Vector. Decrease graph icon illustrations Presentation board line icon. Column graph sign. Line icons. Vector. Presentation board line icon. Neumorphic, Purple gradient, 3d pin buttons. Column graph sign. Growth diagram symbol. Line icons. Neumorphic buttons with outline signs. Vector
Free with trial Presentation board line icon. Neumorphic, Purple gradient, 3d pin buttons. Column graph sign. Growth diagram symbol. Line icons. Neumorphic buttons with outline signs. Vector. Decrease graph icon illustrations Presentation board line icon. Column graph sign. Line icons. Vector. Presentation board line icon. Neumorphic, Purple gradient, 3d pin buttons. Column graph sign. Growth diagram symbol. Line icons. Neumorphic buttons with outline signs. Vector
Free with trial Business bar graph with upward and downward arrow. Trend up and down icon vector in black circle. Decrease graph icon vectors Business bar graph with upward and downward arrow. Trend up and down icon in black circle
Free with trial Diagram chart line icon. Neumorphic, Orange gradient, 3d pin buttons. Presentation graph sign. Market analytics symbol. Line icons. Neumorphic buttons with outline signs. Vector. Decrease graph icon vectors Diagram chart line icon. Presentation graph sign. Line icons. Vector. Diagram chart line icon. Neumorphic, Orange gradient, 3d pin buttons. Presentation graph sign. Market analytics symbol. Line icons. Neumorphic buttons with outline signs. Vector
Free with trial Diagram chart line icon. Neumorphic, Orange gradient, 3d pin buttons. Presentation graph sign. Market analytics symbol. Line icons. Neumorphic buttons with outline signs. Vector. Decrease graph icon illustrations Diagram chart line icon. Presentation graph sign. Line icons. Vector. Diagram chart line icon. Neumorphic, Orange gradient, 3d pin buttons. Presentation graph sign. Market analytics symbol. Line icons. Neumorphic buttons with outline signs. Vector
Free with trial Curved down arrow icon set. Decrease, bankrupt, loss vector concept. Decrease graph icon vectors Curved down arrow icon set. Decrease, bankrupt, loss concept
Free with trial Down Downward Trend Chart Drop Line Bar Trending Data Statistic Graph Market Share Stock Line Outline Black White Vector Icon Sign Symbol Graphic Artwork. Decrease graph icon vectors Down Downward Trend Chart Drop Line Bar Trending Data Statistic Graph Market Share Stock Line Outline Black White Vector Icon
Free with trial Analytics graph line icon. Halftone dotted pattern. Gradient icon with grain shadow. Column chart sign. Growth diagram symbol. Line analytics graph icon. Various designs. Vector. Decrease graph icon vectors Analytics graph line icon. Column chart sign. Halftone dotted pattern. Vector. Analytics graph line icon. Halftone dotted pattern. Gradient icon with grain shadow. Column chart sign. Growth diagram symbol. Line analytics graph icon. Various designs. Vector
Free with trial Dot plot graph line icon. Neumorphic, Blue gradient, 3d pin buttons. Presentation chart sign. Market analytics symbol. Line icons. Neumorphic buttons with outline signs. Vector. Decrease graph icon vectors Dot plot graph line icon. Presentation chart sign. Line icons. Vector. Dot plot graph line icon. Neumorphic, Blue gradient, 3d pin buttons. Presentation chart sign. Market analytics symbol. Line icons. Neumorphic buttons with outline signs. Vector
Free with trial Dot plot graph line icon. Neumorphic, Flat shadow, 3d buttons. Presentation chart sign. Market analytics symbol. Line dot plot icon. Social media icons. Vector. Decrease graph icon illustrations Dot plot graph line icon. Presentation chart sign. Neumorphic buttons. Vector. Dot plot graph line icon. Neumorphic, Flat shadow, 3d buttons. Presentation chart sign. Market analytics symbol. Line dot plot icon. Social media icons. Vector
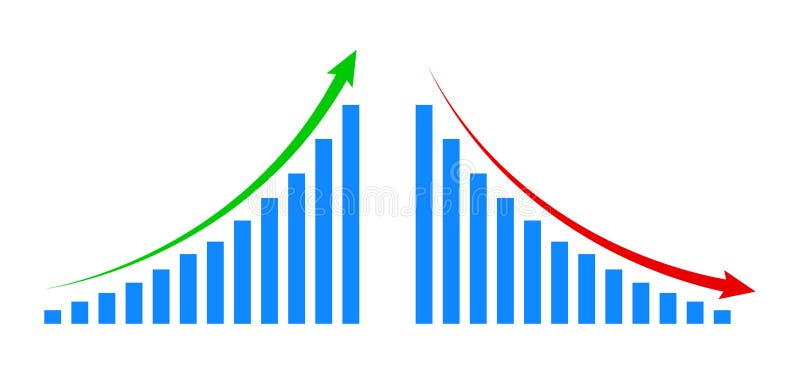
Free with trial Growth and declining graph bar icon with flat rounded cartoon style. Charts with bar growth and declining. Graph trending upwards arrow and downwards arrow. Eps 10 vector illustration. Decrease graph icon vectors Growth and declining graph bar icon with flat rounded cartoon style
Free with trial Curved down arrow icon set in flat style. Decrease, bankrupt, loss illustration concept. Decrease graph icon vectors Curved down arrow icon set in flat style. Decrease, bankrupt, loss concept. Curved down arrow icon set in flat style. Decrease, bankrupt, loss illustration concept
Free with trial Diagram chart line icon. Halftone dotted pattern. Gradient icon with grain shadow. Analytics graph sign. Market analytics symbol. Line analytics chart icon. Various designs. Vector. Decrease graph icon vectors Diagram chart line icon. Analytics graph sign. Halftone dotted pattern. Vector. Diagram chart line icon. Halftone dotted pattern. Gradient icon with grain shadow. Analytics graph sign. Market analytics symbol. Line analytics chart icon. Various designs. Vector
Free with trial Pyramid chart line icon. Continuous line with 3d star. Analytics graph sign. Market analytics symbol. 3d star in speech bubble. Pyramid chart single line ribbon. Loop curve pattern. Vector. Decrease graph icon vectors Pyramid chart line icon. Analytics graph sign. Continuous line with 3d star. Vector. Pyramid chart line icon. Continuous line with 3d star. Analytics graph sign. Market analytics symbol. 3d star in speech bubble. Pyramid chart single line ribbon. Loop curve pattern. Vector
Free with trial Presentation board line icon. Continuous line with share plane. Column graph sign. Growth diagram symbol. 3d star in speech bubble. Presentation board single line ribbon. Loop curve pattern. Vector. Decrease graph icon vectors Presentation board line icon. Column graph sign. Continuous line with plane. Vector. Presentation board line icon. Continuous line with share plane. Column graph sign. Growth diagram symbol. 3d star in speech bubble. Presentation board single line ribbon. Loop curve pattern. Vector
Free with trial Report statistics line icon. Halftone dotted pattern. Gradient icon with grain shadow. Column graph sign. Growth diagram symbol. Line report statistics icon. Various designs. Vector. Decrease graph icon vectors Report statistics line icon. Column graph sign. Halftone dotted pattern. Vector. Report statistics line icon. Halftone dotted pattern. Gradient icon with grain shadow. Column graph sign. Growth diagram symbol. Line report statistics icon. Various designs. Vector
Free with trial Growth and loss arrow icon on black circle. Increase and decrease sign symbol illustration. Decrease graph icon vectors Growth and loss arrow icon on black circle. Increase and decrease sign symbol
Free with trial Candlestick chart line icon. Continuous line with share plane. Analytics graph sign. Market analytics symbol. 3d heart in speech bubble. Candlestick chart single line ribbon. Vector. Decrease graph icon vectors Candlestick chart line icon. Analytics graph sign. Continuous line with plane. Vector. Candlestick chart line icon. Continuous line with share plane. Analytics graph sign. Market analytics symbol. 3d heart in speech bubble. Candlestick chart single line ribbon. Vector
Free with trial Up and down graph icon in line style. Outline bar chart with uptrend and downtrend arrow symbol vector. Decrease graph icon vectors Up and down graph icon in line style. Outline bar chart with uptrend and downtrend arrow symbol
Free with trial Hand holding a house icon with a rising graph and percentage symbols indicating interest rates. Decrease graph icon illustrations Hand holding house icon with rising percentage graph and interes. Hand holding a house icon with a rising graph and percentage symbols indicating interest rates
Free with trial Diagram chart line icon. Halftone dotted pattern. Gradient icon with grain shadow. Presentation graph sign. Market analytics symbol. Line diagram chart icon. Various designs. Vector. Decrease graph icon vectors Diagram chart line icon. Presentation graph sign. Halftone dotted pattern. Vector. Diagram chart line icon. Halftone dotted pattern. Gradient icon with grain shadow. Presentation graph sign. Market analytics symbol. Line diagram chart icon. Various designs. Vector
Free with trial Doodle style bar and line graph icon representing growth and analytics. Decrease graph icon vectors Doodle style bar and line graph icon representing growth and analytics
Free with trial Up and down arrow icon. Rising and falling sign symbol. Increase and decrease illustration concept. Decrease graph icon vectors Up and down arrow icon. Rising and falling sign symbol. Increase and decrease concept
Free with trial Beautiful designed Illustration Icon Set. Decrease graph icon vectors Upward graph, Downward graph, Growth chart, Decrease chart, Sales Analysis, Progress graph, icon. Beautiful designed Illustration Icon Set
Free with trial Candlestick chart line icon. Halftone dotted pattern. Gradient icon with grain shadow. Analytics graph sign. Market analytics symbol. Line candlestick chart icon. Various designs. Vector. Decrease graph icon vectors Candlestick chart line icon. Analytics graph sign. Halftone dotted pattern. Vector. Candlestick chart line icon. Halftone dotted pattern. Gradient icon with grain shadow. Analytics graph sign. Market analytics symbol. Line candlestick chart icon. Various designs. Vector
Free with trial Dot plot graph line icon. Halftone dotted pattern. Gradient icon with grain shadow. Presentation chart sign. Market analytics symbol. Line dot plot icon. Various designs. Vector. Decrease graph icon vectors Dot plot graph line icon. Presentation chart sign. Halftone dotted pattern. Vector. Dot plot graph line icon. Halftone dotted pattern. Gradient icon with grain shadow. Presentation chart sign. Market analytics symbol. Line dot plot icon. Various designs. Vector
Free with trial This image features a striking red neon-style line graph on a black background, symbolizing decline, decrease, or downward trend in data visualization. Ideal for business, finance, and analytics concepts, it visually represents performance drops or negative growth in a modern, eye-catching manner. Decrease graph icon illustrations Red Neon Declining Graph Line Icon for Business Data Visualization. This image features a striking red neon-style line graph on a black background, symbolizing decline, decrease, or downward trend in data visualization. Ideal for business, finance, and analytics concepts, it visually represents performance drops or negative growth in a modern, eye-catching manner.
Free with trial Growth vector icon. Graph or diagram with arrow going up and down. Vector illustration. Decrease graph icon vectors Growth vector icon. Graph or diagram with arrow going up and down. Vector
Free with trial Up and down graph icon vector in circular line. Outline bar chart with uptrend and downtrend arrow symbol. Decrease graph icon vectors Up and down graph icon in circular line. Outline bar chart with uptrend and downtrend arrow symbol
Free with trial Graph up and down icon vector in circular line. Outline bar chart with arrow symbol. Analytics concept. Decrease graph icon vectors Graph up and down icon in circular line. Outline bar chart with arrow symbol. Analytics concept
Free with trial A collection of icons Decrease report, progress report, Upward report, Downward report, Profit increase, Profit decrease, icon. Decrease graph icon vectors Decrease report, progress report, Upward report, Downward report, Profit increase, Profit decrease, icon
Free with trial Growth vector icon. Graph or diagram with arrow going up and down. Vector illustration. Decrease graph icon vectors Growth vector icon. Graph or diagram with arrow going up and down. Vector
Free with trial Growth and decline graph report icon. Financial chart arrow up and down sign symbol illustration. Decrease graph icon vectors Growth and decline graph report icon. Financial chart arrow up and down sign symbol
Free with trial Pie chart line icon. Neumorphic, Red gradient, 3d pin buttons. Presentation graph sign. Market analytics symbol. Line icons. Neumorphic buttons with outline signs. Vector. Decrease graph icon vectors Pie chart line icon. Presentation graph sign. Line icons. Vector. Pie chart line icon. Neumorphic, Red gradient, 3d pin buttons. Presentation graph sign. Market analytics symbol. Line icons. Neumorphic buttons with outline signs. Vector
Free with trial Report document line icon. Neumorphic, Purple gradient, 3d pin buttons. Column graph sign. Growth diagram, pie chart symbol. Line icons. Neumorphic buttons with outline signs. Vector. Decrease graph icon vectors Report document line icon. Column graph sign. Line icons. Vector. Report document line icon. Neumorphic, Purple gradient, 3d pin buttons. Column graph sign. Growth diagram, pie chart symbol. Line icons. Neumorphic buttons with outline signs. Vector
Free with trial Decrease vector icon on the white background. EPS 10. Decrease graph icon vectors Decrease thin line vector icon set. Decrease vector icon on the white background. EPS 10
Free with trial Decrease vector icon on the white background. EPS 10. Decrease graph icon vectors Decrease thin line vector icon set. Decrease vector icon on the white background. EPS 10
Free with trial Graph going Up and Down sign with green and red arrows. graph increase, decrease sign design. Decrease graph icon vectors Graph going Up and Down sign with green and red arrows. graph increase, decrease sign
Free with trial Decrease vector icon on the white background. EPS 10. Decrease graph icon vectors Decrease thin line vector icon set. Decrease vector icon on the white background. EPS 10
Free with trial Decrease vector icon on the white background. EPS 10. Decrease graph icon vectors Decrease thin line vector icon set. Decrease vector icon on the white background. EPS 10
Free with trial Decrease vector icon on the white background. EPS 10. Decrease graph icon vectors Decrease thin line vector icon set. Decrease vector icon on the white background. EPS 10
Free with trial Decrease vector icon on the white background. EPS 10. Decrease graph icon vectors Decrease thin line vector icon set. Decrease vector icon on the white background. EPS 10
Free with trial Decrease vector icon on the white background. EPS 10. Decrease graph icon vectors Decrease thin line vector icon set. Decrease vector icon on the white background. EPS 10
Free with trial Decrease vector icon on the white background. EPS 10. Decrease graph icon vectors Decrease thin line vector icon set. Decrease vector icon on the white background. EPS 10
Free with trial Decrease vector icon on the white background. EPS 10. Decrease graph icon vectors Decrease thin line vector icon set. Decrease vector icon on the white background. EPS 10
Free with trial Decrease vector icon on the white background. EPS 10. Decrease graph icon vectors Decrease thin line vector icon set. Decrease vector icon on the white background. EPS 10
Free with trial Decrease vector icon on the white background. EPS 10. Decrease graph icon vectors Decrease thin line vector icon set. Decrease vector icon on the white background. EPS 10
Free with trial A collection of icons Growth, loss, Upward report, Downward report, Sales decrease, Sales increase, icon. Decrease graph icon vectors Growth, loss, Upward report, Downward report, Sales decrease, Sales increase, icon
Free with trial Growth vector icon. Graph or diagram with arrow going up and down. Vector illustration. Decrease graph icon vectors Growth vector icon. Graph or diagram with arrow going up and down. Vector
Free with trial Growth vector icon. Graph or diagram with arrow going up and down. Vector illustration. Decrease graph icon vectors Growth vector icon. Graph or diagram with arrow going up and down. Vector
Free with trial Growth vector icon. Graph or diagram with arrow going up and down. Vector illustration. Decrease graph icon vectors Growth vector icon. Graph or diagram with arrow going up and down. Vector
Free with trial Growth vector icon. Graph or diagram with arrow going up and down. Vector illustration. Decrease graph icon vectors Growth vector icon. Graph or diagram with arrow going up and down. Vector
Free with trial Growth vector icon. Graph or diagram with arrow going up and down. Vector illustration. Decrease graph icon vectors Growth vector icon. Graph or diagram with arrow going up and down. Vector
Free with trial Growth vector icon. Graph or diagram with arrow going up and down. Vector illustration. Decrease graph icon vectors Growth vector icon. Graph or diagram with arrow going up and down. Vector
Free with trial Growth vector icon. Graph or diagram with arrow going up and down. Vector illustration. Decrease graph icon vectors Growth vector icon. Graph or diagram with arrow going up and down. Vector
Free with trial Growth vector icon. Graph or diagram with arrow going up and down. Vector illustration. Decrease graph icon vectors Growth vector icon. Graph or diagram with arrow going up and down. Vector
Free with trial Decline bar chart with downward trend arrow outline icon. Decrease, loss, and financial drop symbol vector. Decrease graph icon vectors Decline bar chart with downward trend arrow outline icon. Decrease, loss, and financial drop symbol
Free with trial Financial arrow up and down icon on circle line. Growth and decline graph sign symbol illustration. Decrease graph icon vectors Financial arrow up and down icon on circle line. Growth and decline graph sign symbol
Free with trial Report statistics line icon. Neumorphic, Flat shadow, 3d buttons. Column graph sign. Growth diagram symbol. Line report statistics icon. Social media icons. Vector. Decrease graph icon illustrations Report statistics line icon. Column graph sign. Neumorphic buttons. Vector. Report statistics line icon. Neumorphic, Flat shadow, 3d buttons. Column graph sign. Growth diagram symbol. Line report statistics icon. Social media icons. Vector
Free with trial Report statistics line icon. Neumorphic, Flat shadow, 3d buttons. Column graph sign. Growth diagram symbol. Line report statistics icon. Social media icons. Vector. Decrease graph icon illustrations Report statistics line icon. Column graph sign. Neumorphic buttons. Vector. Report statistics line icon. Neumorphic, Flat shadow, 3d buttons. Column graph sign. Growth diagram symbol. Line report statistics icon. Social media icons. Vector
Free with trial Graph laptop line icon. Halftone dotted pattern. Gradient icon with grain shadow. Column chart sign. Growth diagram symbol. Line graph laptop icon. Various designs. Vector. Decrease graph icon illustrations Graph laptop line icon. Column chart sign. Halftone dotted pattern. Vector. Graph laptop line icon. Halftone dotted pattern. Gradient icon with grain shadow. Column chart sign. Growth diagram symbol. Line graph laptop icon. Various designs. Vector