Free with trial 3d render icon Declining euro coins with descending red arrow symbolizing economic downturn, transparent financial graphic highlighting monetary instability. Decrease graph icon vectors 3d representing icon coins of declining euro render and descending Stacks arrow red financial crisis, with transparent background. 3d render icon Declining euro coins with descending red arrow symbolizing economic downturn, transparent financial graphic highlighting monetary instability
Free with trial Decreasing Bar Chart With Downward Arrow Line Icon. Financial Decline, Economic Downturn, And Business Loss Outline Symbol. Market Analysis. Editable Stroke. Isolated Vector Illustration. Decrease graph icon vectors Decreasing Bar Chart With Downward Arrow Line Icon. Financial Decline, Economic Downturn, And Business Loss Outline
Free with trial Blue Searching for food in trash can on streets outdoors icon isolated on white background. Homelessness and poverty concept. Vector. Decrease graph icon illustrations Blue Searching for food in trash can on streets outdoors icon isolated on white background. Homelessness and poverty
Free with trial A businessman's hands interact with a futuristic virtual interface displaying a declining bar chart, symbolizing cost reduction or performance decrease. This central icon is encircled by various business process icons, representing data analysis, management, and strategy. The concept illustrates managing a business downturn, financial crisis, or economic recession through technology and data-driven decisions. It's an ideal visual for topics like risk management, cost optimization, efficiency improvement, and corporate strategy in a challenging economic environment, set against a modern, dark background. Decrease graph icon illustrations Business Cost Reduction and Performance Decline Analysis Concept. A businessman's hands interact with a futuristic virtual interface displaying a declining bar chart, symbolizing cost reduction or performance decrease. This central icon is encircled by various business process icons, representing data analysis, management, and strategy. The concept illustrates managing a business downturn, financial crisis, or economic recession through technology and data-driven decisions. It's an ideal visual for topics like risk management, cost optimization, efficiency improvement, and corporate strategy in a challenging economic environment, set against a modern, dark background.
Free with trial 3d render icon Declining euro coins with descending red arrow symbolizing economic downturn, transparent financial graphic highlighting monetary instability. Decrease graph icon vectors 3d render icon Stacks of declining euro coins and descending red arrow representing financial crisis, with transparent background. 3d render icon Declining euro coins with descending red arrow symbolizing economic downturn, transparent financial graphic highlighting monetary instability
Free with trial A line drawing depicts a money bag, a downward trending graph, and a magnifying glass, symbolizing financial loss. Decrease graph icon illustrations Financial Loss Analysis Money Bag, Downward Graph, Magnifying Glass. A line drawing depicts a money bag, a downward trending graph, and a magnifying glass, symbolizing financial loss.
Free with trial 3d render icon Declining euro coins with descending red arrow symbolizing economic downturn, transparent financial graphic highlighting monetary instability. Decrease graph icon vectors 3d render icon Stacks of declining euro coins and descending red arrow representing financial crisis, with transparent background. 3d render icon Declining euro coins with descending red arrow symbolizing economic downturn, transparent financial graphic highlighting monetary instability
Free with trial A 3D business growth down sign UI icon, isolated on a white background. Symbolizing a decline in business, finance, or market performance. Decrease graph icon illustrations Business Growth Down Sign UI Icon 3D Isolated on White Background. A 3D business growth down sign UI icon, isolated on a white background. Symbolizing a decline in business, finance, or market performance.
Free with trial A hand holding a magnifying glass focuses on a downward-trending graph, symbolizing economic decline or financial loss. The image is set against a vibrant yellow background, creating a strong visual contrast. The magnifying glass highlights the concept of scrutiny and analysis, while the graph clearly illustrates a negative trend. This image is suitable for illustrating concepts related to business, finance, economics, market analysis, and economic forecasts. Decrease graph icon illustrations Analyzing Economic Downturn: Magnifying Glass Over Declining Graph. A hand holding a magnifying glass focuses on a downward-trending graph, symbolizing economic decline or financial loss. The image is set against a vibrant yellow background, creating a strong visual contrast. The magnifying glass highlights the concept of scrutiny and analysis, while the graph clearly illustrates a negative trend. This image is suitable for illustrating concepts related to business, finance, economics, market analysis, and economic forecasts.
Free with trial Unemployment line icon of unemployed man on labor market, vector symbol. Economic crisis, global financial downturn and bankruptcy icon of economy recession and unemployment problem. Decrease graph icon vectors Unemployment line icon, economic financial crisis. Unemployment line icon of unemployed man on labor market, vector symbol. Economic crisis, global financial downturn and bankruptcy icon of economy recession and unemployment problem
Free with trial A set of black line icons illustrating economic recession and market downturn concepts, including declining graphs, money loss, and GDP decrease, useful for business, finance, and marketing materials. Decrease graph icon vectors Economic Recession and Market Downturn outline icon set. economic recession market decline outline icons. A set of black line icons illustrating economic recession and market downturn concepts, including declining graphs, money loss, and GDP decrease, useful for business, finance, and marketing materials
Free with trial The image depicts a red arrow that points downward in a zigzag pattern. The arrow starts from the top left corner and moves diagonally down to the bottom right corner. The zigzag pattern gives the impression of a decline or a decrease. The arrow is 3D and has a shadow effect, giving it a sense of depth. The background of the image is plain white, which makes the red arrow stand out. Decrease graph icon illustrations A red arrow pointing downward in a zigzag pattern indicating a decrease. The image depicts a red arrow that points downward in a zigzag pattern. The arrow starts from the top left corner and moves diagonally down to the bottom right corner. The zigzag pattern gives the impression of a decline or a decrease. The arrow is 3D and has a shadow effect, giving it a sense of depth. The background of the image is plain white, which makes the red arrow stand out
Free with trial Icon financial loss analytics with declining bar chart, down arrow and dollar sign, gear with cross for failed settings, minimal outline symbol for business report. Decrease graph icon vectors Icon financial loss analytics with declining bar chart, down arrow and dollar sign, gear with cross for failed settings, minimal
Free with trial A grey downward curving arrow path icon, symbolizing decline, decrease, or a negative trend. Useful for financial charts, statistical graphs, and illustrating downward movements in data, vector design Generative AI. Decrease graph icon vectors Downward Curving Arrow Path for Decline, vector design Generative AI. A grey downward curving arrow path icon, symbolizing decline, decrease, or a negative trend. Useful for financial charts, statistical graphs, and illustrating downward movements in data, vector design Generative AI
Free with trial Reduction chart icon set in thin line outline style and linear vector sign. Decrease graph icon vectors Reduction chart icon Thin line art isolated. Reduction chart icon set in thin line outline style and linear vector sign
Free with trial Bankruptcy icon vector logo set collection for web app ui. Decrease graph icon vectors Bankruptcy icon Outline flat Icon. Bankruptcy icon vector logo set collection for web app ui
Free with trial House icon on wooden cube from stack block with percent and rise arrow, Real estate property investment concept. Asset management, Interest rates, inflation, loan mortgage, increase tax. 3d render. Decrease graph icon illustrations House icon on wooden cube from stack block with percent and rise arrow
Free with trial Blue pencil drawing a downward trending graph with yellow nodes on a dark gray background, illustrating financial decline or strategy planning. Decrease graph icon illustrations Blue pencil drawing a downward trending graph with yellow nodes on a dark gray background, illustrating financial decline or
Free with trial Simple and clean blue gradient line graph is going up and down showing growth and decline over a period of time. Decrease graph icon vectors Blue gradient line graph showing growth and decline over time. Simple and clean blue gradient line graph is going up and down showing growth and decline over a period of time
Free with trial Computer screen displaying a simple statistical business graph, perfect for illustrating concepts like data analysis. Decrease graph icon illustrations Computer showing statistical business graph on screen. Computer screen displaying a simple statistical business graph, perfect for illustrating concepts like data analysis
Free with trial Direction showing black downward trending arrow graph on white background keywords: downward, arrow, graph. Decrease graph icon illustrations Black downward trending arrow graph on white background Keywords: downward, arrow, graph, chart. Direction showing black downward trending arrow graph on white background keywords: downward, arrow, graph
Free with trial Two stick figures are discussing a downward trending graph against a clean white background. This minimalist illustration symbolizes business, finance, or economic downturn and can be perfect for. Decrease graph icon illustrations Stick Figures Discussing a Downward Trending Graph on White Background. Two stick figures are discussing a downward trending graph against a clean white background. This minimalist illustration symbolizes business, finance, or economic downturn and can be perfect for
Free with trial Graph chart going up and down sign arrows flat design vector illustration on white background. Decrease graph icon vectors Graph chart going up and down sign arrows flat design vector illustration
Free with trial The image features a downward-pointing green arrow with a dark blue circle containing a white dollar sign in the center. This icon is commonly used to represent a decrease in financial value or economic downturn. Decrease graph icon vectors A downward trending arrow with a dollar sign symbolizing economic decline. The image features a downward-pointing green arrow with a dark blue circle containing a white dollar sign in the center. This icon is commonly used to represent a decrease in financial value or economic downturn
Free with trial Comprehensive vector silhouette icon set featuring essential financial concepts and business analytics. This professional collection includes 3D growth charts, economic downfall trends, global trade networks, magnifying glass market research, currency balance scales, and intersecting risk analysis arrows. Perfect for corporate presentations, fintech applications, stock market reports, banking graphics, and economic data visualization. Clean, high-contrast, and isolated on a pure white background for versatile commercial use. Decrease graph icon vectors Financial Analytics and Global Market Trends Vector Silhouette Icon Set. Comprehensive vector silhouette icon set featuring essential financial concepts and. Comprehensive vector silhouette icon set featuring essential financial concepts and business analytics. This professional collection includes 3D growth charts, economic downfall trends, global trade networks, magnifying glass market research, currency balance scales, and intersecting risk analysis arrows. Perfect for corporate presentations, fintech applications, stock market reports, banking graphics, and economic data visualization. Clean, high-contrast, and isolated on a pure white background for versatile commercial use.
Free with trial The image features a prominent red downward arrow, which is a universal symbol for decline or reduction. Inside the arrow, there is a white percentage symbol, emphasizing a decrease in percentage terms. The arrow is outlined in white, making it stand out against the red background. Decrease graph icon illustrations A bold red downward arrow with a percentage symbol indicating a decrease. The image features a prominent red downward arrow, which is a universal symbol for decline or reduction. Inside the arrow, there is a white percentage symbol, emphasizing a decrease in percentage terms. The arrow is outlined in white, making it stand out against the red background
Free with trial Stylized graphic shows two graphs trending downwards against a yellow background. A line graph shows minor fluctuations while another heavier, bolder line with an arrow accentuates the downward trend. Image may illustrate loss, decline, or decrease in reports and presentations. Vector illustration. Decrease graph icon illustrations Declining trend graphic falling line chart with downward arrow indicator. Stylized graphic shows two graphs trending downwards against a yellow background. A line graph shows minor fluctuations while another heavier, bolder line with an arrow accentuates the downward trend. Image may illustrate loss, decline, or decrease in reports and presentations. Vector illustration
Free with trial A black jagged line graph with a downward arrow on a white background. Clear details and vibrant colors enhanc. Decrease graph icon illustrations Black jagged line graph with down arrow on white background chart zigzag. A black jagged line graph with a downward arrow on a white background. Clear details and vibrant colors enhanc
Free with trial A clean, minimalist smartphone app interface displays a spending tracker. A bar graph shows spending increase, highlighting financial growth. The design is black and white, emphasizing data clarity. Decrease graph icon illustrations Smartphone App UI: Minimalist Black & White Spending Tracker with Rising Graph. A clean, minimalist smartphone app interface displays a spending tracker. A bar graph shows spending increase, highlighting financial growth. The design is black and white, emphasizing data clarity
Free with trial Red bars drop steadily, showing sharp decrease in values.. Ends with money pouch symbol, hinting at spending cuts or loss.. Clean, bold design emphasizes downward financial trend. Decrease graph icon vectors Declining bar chart with money bag icon illustrating financial downturn or budget reduction concept. Red bars drop steadily, showing sharp decrease in values.. Ends with money pouch symbol, hinting at spending cuts or loss.. Clean, bold design emphasizes downward financial trend
Free with trial Online Crypto Trading vector Candlestick Chart concept outline icon or sign. Decrease graph icon illustrations Online Crypto Trading vector Candlestick Chart outline icon or sign
Free with trial Risk showing black arrow graph descending sharply on a white background keywords: graph, chart, arrow. Decrease graph icon illustrations Black arrow graph descending sharply on a white background Keywords: graph, chart, arrow
Free with trial 3D Falling Arrow with Percent Icon. Decline Representation on Elegant Background. Decrease graph icon illustrations 3D Falling Arrow with Percent Icon. Decline Representation on Elegant Background
Free with trial 3D Falling Arrow with Percent Icon. Decline Representation on Elegant Background. Decrease graph icon illustrations 3D Falling Arrow with Percent Icon. Decline Representation on Elegant Background
Free with trial 3D Falling Arrow with Percent Icon. Decline Representation on Elegant Background. Decrease graph icon illustrations 3D Falling Arrow with Percent Icon. Decline Representation on Elegant Background
Free with trial Reducing waste icon with a chart and trash bin, line vector, eps 10 file, easy to edit. Decrease graph icon vectors Reducing waste icon with a chart and trash bin
Free with trial A vibrant 3D rendered blue arrow points downwards, signifying a decrease or decline. Attached to the arrow is a pink circular emblem featuring a white percentage sign. This graphic is isolated on a white background, making it suitable for representing concepts like price drops, sales, economic downturns, or negative trends. Decrease graph icon illustrations 3D Blue Downward Arrow with a Pink Percentage Sign Emblem decrease decline. A vibrant 3D rendered blue arrow points downwards, signifying a decrease or decline. Attached to the arrow is a pink circular emblem featuring a white percentage sign. This graphic is isolated on a white background, making it suitable for representing concepts like price drops, sales, economic downturns, or negative trends
Free with trial Uptrend and downtrend arrow line icon illustration on black square. Decrease graph icon vectors Uptrend and downtrend arrow line icon on black square. Uptrend and downtrend arrow line icon illustration on black square
Free with trial Graph with a downward trend representing the falling value of bitcoin cryptocurrency. Decrease graph icon illustrations Bitcoin value downward trend with falling graph and coin. Graph with a downward trend representing the falling value of bitcoin cryptocurrency
Free with trial Up down arrow icon in line style. Upward downward arrows sign symbol vector. Decrease graph icon vectors Up down arrow icon in line style. Upward downward arrows sign symbol
Free with trial Black bar graph with decreasing heights indicating a downward trend on a white background. Decrease graph icon illustrations Black bar graph showing downward trend on white background chart statistics. Black bar graph with decreasing heights indicating a downward trend on a white background
Free with trial Cost reduction icon vector logo set collection or bundle pack group. Decrease graph icon vectors Cost reduction icon Isolated flat vector in outline. Cost reduction icon vector logo set collection or bundle pack group
Free with trial A high-quality conceptual image featuring a row of smooth wooden cubes spelling the word "PESSIMISM" on a wooden surface. The arrangement includes a stacked block showing a sad face emoticon and a downward-sloping line graph, symbolizing financial loss, recession, negative market sentiment, and psychological discouragement in a professional or personal context. Decrease graph icon illustrations Wooden Blocks Spelling Pessimism with Sad Face Icon and Downward Trend Graph. A high-quality conceptual image featuring a row of smooth wooden cubes spelling the word "PESSIMISM" on a wooden surface. The arrangement includes a stacked block showing a sad face emoticon and a downward-sloping line graph, symbolizing financial loss, recession, negative market sentiment, and psychological discouragement in a professional or personal context.
Free with trial Percent growth and decline icon. Percentage arrow up and down sign symbol vector. Decrease graph icon vectors Percent growth and decline icon. Percentage arrow up and down sign symbol
Free with trial Financial data analysis bar chart icon with upward trend showing business growth. Decrease graph icon vectors Financial data analysis bar chart icon with upward trend showing business growth
Free with trial Illustration of a line graph connecting points above bar graph on black. Flat design with blue outlines, orange points, and blue and green bars. Decrease graph icon vectors Line graph and bar graph showing growth and trends, isolated on black background. Illustration of a line graph connecting points above bar graph on black. Flat design with blue outlines, orange points, and blue and green bars.
Free with trial Hand-drawn graph showing a market downturn and decline, minimalist representation. Decrease graph icon vectors Hand-drawn graph showing a market downturn and decline, minimalist representation
Free with trial Uptrend and downtrend arrow line icon illustration on circle outline. Decrease graph icon vectors Uptrend and downtrend arrow line icon on circle outline. Uptrend and downtrend arrow line icon illustration on circle outline
Free with trial Percent arrow down and up icon. Percentage decline and growth sign symbol vector. Decrease graph icon vectors Percent arrow down and up icon. Percentage decline and growth sign symbol
Free with trial A black downward trending graph intersects a stack of coins with a dollar sign on a white background. Decrease graph icon illustrations Black downward trending graph with dollar sign on stacked coins money finance. A black downward trending graph intersects a stack of coins with a dollar sign on a white background
Free with trial Vector Candlestick Chart Pattern on Laptop Screen concept outline icon or sign. Decrease graph icon illustrations Vector Candlestick Chart Pattern on Laptop Screen outline icon or sign
Free with trial A 3D rendered graphic displays a colorful bar chart with bars in orange, green, yellow, and pink. A yellow line with white dots connects points above the bars, forming a trend graph. A blue rectangular background with a white strip containing green, orange, and blue dots sits at the top. The object is isolated on a white background. Decrease graph icon vectors 3 D colorful bar chart graph with line and dots on blue background statistics. A 3D rendered graphic displays a colorful bar chart with bars in orange, green, yellow, and pink. A yellow line with white dots connects points above the bars, forming a trend graph. A blue rectangular background with a white strip containing green, orange, and blue dots sits at the top. The object is isolated on a white background
Free with trial Modern icon set featuring financial growth and decline symbols for business analysis. Decrease graph icon vectors Modern icon set featuring financial growth and decline symbols for business analysis
Free with trial Diagram chart line icon. Neumorphic, Red gradient, 3d pin buttons. Statistics timer sign. Market analytics symbol. Line icons. Neumorphic buttons with outline signs. Vector. Decrease graph icon vectors Diagram chart line icon. Statistics timer sign. Line icons. Vector. Diagram chart line icon. Neumorphic, Red gradient, 3d pin buttons. Statistics timer sign. Market analytics symbol. Line icons. Neumorphic buttons with outline signs. Vector
Free with trial This is an detailed collection of minimalist line icons representing various business graphs and data trends. Decrease graph icon vectors Professional business graph and data visualization line icon set for reports. This is an detailed collection of minimalist line icons representing various business graphs and data trends
Free with trial A black line graph with a zigzag pattern trending downwards with an arrow. Clear details and vibrant colors en. Decrease graph icon illustrations Black downward trending line graph with arrow on white background chart decline. A black line graph with a zigzag pattern trending downwards with an arrow. Clear details and vibrant colors en
Free with trial Black icon showing a downward trend with a curved arrow connecting two bars Clear details and vibrant colors e. Decrease graph icon illustrations Black icon representing a downward trend with a curved arrow and two bars decline. Black icon showing a downward trend with a curved arrow connecting two bars Clear details and vibrant colors e
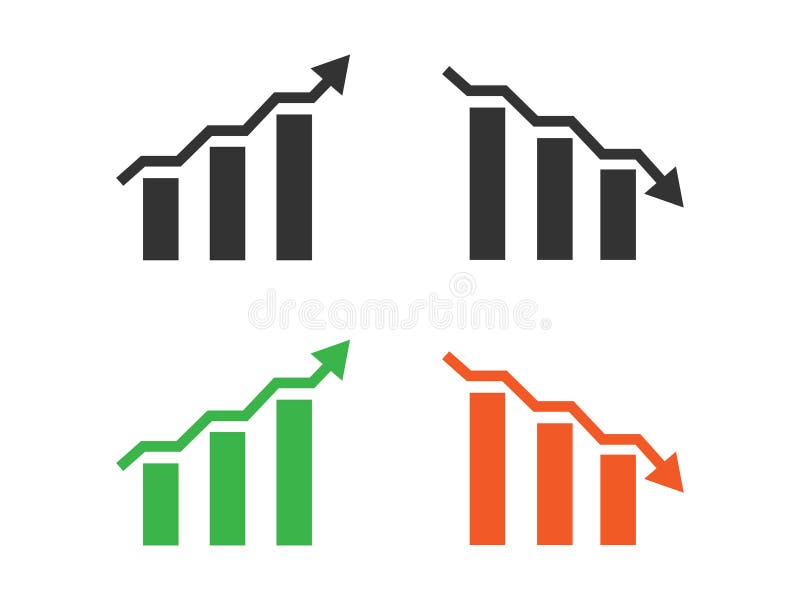
Free with trial Bar Chart With Arrows Line And Solid Icon Set. Financial Growth And Decline Trend Analysis Symbol Collection. Economic Performance Indicators. Isolated Vector Illustration. Decrease graph icon vectors Bar Chart With Arrows Line And Solid Icon Set. Financial Growth And Decline Trend Analysis Symbol Collection. Economic
Free with trial This colorful bar graph is representing market trends and data analysis. Decrease graph icon vectors Colorful bar graph showing market trends and data analysis. This colorful bar graph is representing market trends and data analysis
Free with trial Silhouette icon featuring a downward zigzag arrow symbolizing decline or loss. Above the arrow is a human figure with raised arms, possibly indicating surprise or concern. The design uses simple black shapes on a white background, typical for conveying concepts like financial decrease or graph trends in business contexts. Decrease graph icon vectors Silhouette icon featuring a downward zigzag arrow symbolizing decline or loss.
Free with trial Declining chart icon. Downward staircase trend. Economic crisis symbol. Vector illustration. EPS 10. Decrease graph icon vectors Declining chart icon. Downward staircase trend. Economic crisis symbol. Vector illustration.
Free with trial Line art illustration of a bar chart depicting financial decrease for business analysis. Decrease graph icon vectors Line art illustration of a bar chart depicting financial decrease for business analysis
Free with trial Circle with Crypto Candlestick Chart Pattern vector concept outline icon or sign. Decrease graph icon illustrations Circle with Crypto Candlestick Chart Pattern vector outline icon or sign
Free with trial A black downward trending arrow with a jagged line graph on a white background. Clear details and vibrant colo. Decrease graph icon illustrations Black downward trending arrow with jagged line graph on white background decline. A black downward trending arrow with a jagged line graph on a white background. Clear details and vibrant colo
Free with trial A black bar graph showing a downward trend with an arrow pointing down. Clear details and vibrant colors enhan. Decrease graph icon illustrations Black bar graph with a downward trending arrow on white background chart decline. A black bar graph showing a downward trend with an arrow pointing down. Clear details and vibrant colors enhan
Free with trial Up down arrow icon in rounded corner. Upward downward arrows sign symbol vector. Decrease graph icon vectors Up down arrow icon in rounded corner. Upward downward arrows sign symbol
Free with trial Simple black icon of a declining bar chart with a downward arrow showing financial loss. Decrease graph icon vectors Simple black icon of a declining bar chart with a downward arrow showing financial loss
Free with trial A black downward trending graph inside a warning triangle on a white background Clear details and vibrant colo. Decrease graph icon illustrations Black downward trending graph inside a warning triangle on white background chart. A black downward trending graph inside a warning triangle on a white background Clear details and vibrant colo
Free with trial Black line graph with downward trend arrow on white background vector illustration. Decrease graph icon vectors Black line graph with downward trend arrow on white background vector illustration
Free with trial A flat style illustration featuring a decreasing graph alongside a warning symbol, representing decline and potential business issues on a black background. Decrease graph icon vectors Declining Graph with Warning Icon: Illustration of Failure or Business Downturn. A flat style illustration featuring a decreasing graph alongside a warning symbol, representing decline and potential business issues on a black background.
Free with trial Up down arrow icon vector on black circle. Decrease graph icon vectors Up down arrow icon on black circle. Up down arrow icon vector on black circle
Free with trial A minimalist teal illustration shows a declining bar graph with a downward arrow against a stark black background. Indicating negative trend and recession. Decrease graph icon vectors Downward trend graph illustration indicating loss or decline in a minimalist style. A minimalist teal illustration shows a declining bar graph with a downward arrow against a stark black background. Indicating negative trend and recession.
Free with trial Up down arrow icon vector on black square. Decrease graph icon vectors Up down arrow icon on black square. Up down arrow icon vector on black square
Free with trial Lower cost icon Vector symbol or sign set collection in black and white outline. Decrease graph icon vectors Lower cost icon mark in filled style. Lower cost icon Vector symbol or sign set collection in black and white outline
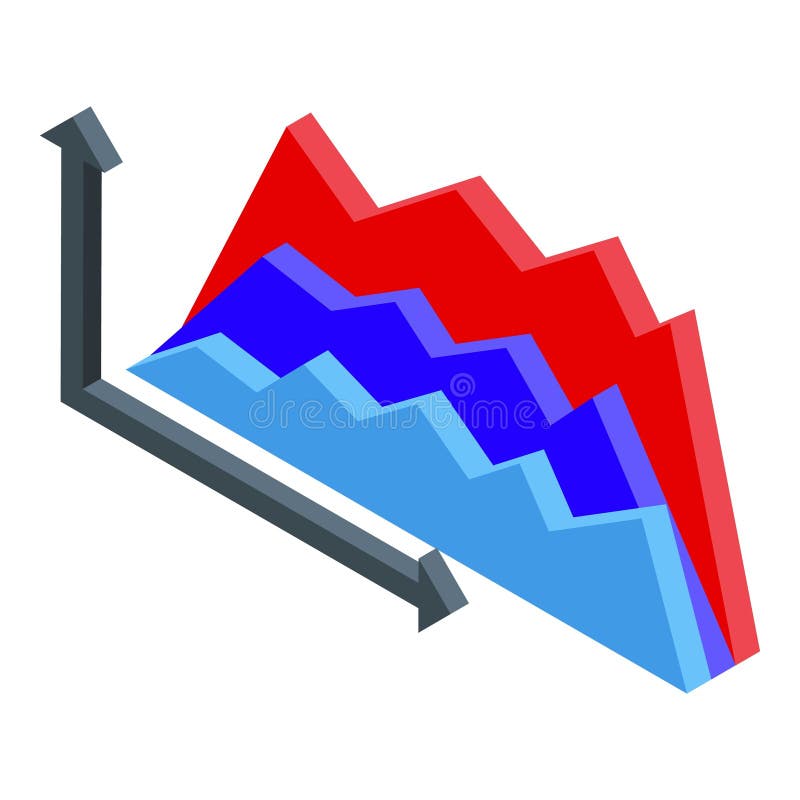
Free with trial Isometric graph showing different trends with ups and downs, concept of trading and business analysis. Decrease graph icon illustrations Isometric graph showing different trends with ups and downs
Free with trial Line art icon representing financial audit and data analysis of a declining business report. Decrease graph icon vectors Line art icon representing financial audit and data analysis of a declining business report
Free with trial Black silhouette graph depicting a downward trend with the text "Early Accumulation Zone" below. Decrease graph icon illustrations Black Silhouette Graph Showing Downward Trend with Text Early Accumulation Zone chart. Black silhouette graph depicting a downward trend with the text "Early Accumulation Zone" below
Free with trial Up down arrow line icon on black circle. Upward downward arrows sign symbol vector. Decrease graph icon vectors Up down arrow line icon on black circle. Upward downward arrows sign symbol
Free with trial Uptrend and downtrend arrow icon on black square. Rise and fall sign symbol. Decrease graph icon vectors Uptrend and downtrend arrow icon on black square
Free with trial A graph with a dollar sign. A growing trend. Financial Flat vector illustration isolated on white background. Decrease graph icon vectors A graph with a dollar sign