Free with trial Percent up and down icon on circle line. Percentage arrow growth and decline sign symbol vector. Decrease graph icon vectors Percent up and down icon on circle line. Percentage arrow growth and decline sign symbol
Free with trial Business graph with falling down arrow loss finance animation, city background. Decrease graph icon illustrations Business graph with falling down arrow loss finance animation, city background
Free with trial Set line Financial growth decrease Cloud computing lock and Pie chart infographic with long shadow. Red square button. Vector. Decrease graph icon vectors Set line Financial growth, decrease, Cloud computing lock and Pie chart infographic with long shadow. Red square button
Free with trial Three black, rounded, vertical bars of progressively increasing height are displayed against a clean white background. The bars are smooth and have a matte finish. This visual representation suggests concepts of growth, progress, data analysis, or a simple bar graph. Decrease graph icon illustrations Three black rounded bars of increasing height on a white background bar chart graph. Three black, rounded, vertical bars of progressively increasing height are displayed against a clean white background. The bars are smooth and have a matte finish. This visual representation suggests concepts of growth, progress, data analysis, or a simple bar graph
Free with trial Smartphone displaying a falling bar chart icon, economic recession or financial crisis illustration. Decrease graph icon vectors Smartphone displaying a falling bar chart icon, economic recession or financial crisis illustration
Free with trial Percent arrow down and up icon on black circle. Percentage decline and growth sign symbol vector. Decrease graph icon vectors Percent arrow down and up icon on black circle. Percentage decline and growth sign symbol
Free with trial Business bar graph with decreasing bars and a downward arrow representing economic loss and market fall. Decrease graph icon vectors Business bar graph with decreasing bars and a downward arrow representing economic loss and market fall
Free with trial Business Analytics And Data Visualization Line Icon Set. Financial Growth, Market Trends, And Performance Analysis Outline Symbol Collection. Editable Stroke. Isolated Vector Illustration. Decrease graph icon vectors Business Analytics And Data Visualization Line Icon Set. Financial Growth, Market Trends, And Performance Analysis
Free with trial Domino effect concept icon showing a declining bar chart representing financial crisis and recession. Decrease graph icon vectors Domino effect concept icon showing a declining bar chart representing financial crisis and recession
Free with trial Set Isometric line Global economic crisis, Mobile stock trading, and Briefcase icon. Vector. Decrease graph icon illustrations Set Isometric line Global economic crisis, Mobile stock trading, and Briefcase icon. Vector
Free with trial Bar Chart With Downward Arrow Solid Icon. Economic Decline, Financial Loss, And Market Downturn Silhouette Symbol. Business Analysis. Isolated Vector Illustration. Decrease graph icon vectors Bar Chart With Downward Arrow Solid Icon. Economic Decline, Financial Loss, And Market Downturn Silhouette Symbol
Free with trial Declining Bar Chart With Downward Arrow Icon. Economic Downturn, Financial Loss, And Market Decline Outline Symbol. Business Analysis And Risk Assessment. Editable Stroke. Isolated Vector Illustration. Decrease graph icon vectors Declining Bar Chart With Downward Arrow Icon. Economic Downturn, Financial Loss, And Market Decline Outline Symbol
Free with trial Set line Bank building, Global economic crisis, Pie chart infographic and Shutdown of factory icon. Vector. Decrease graph icon vectors Set line Bank building, Global economic crisis, Pie chart infographic and Shutdown of factory icon. Vector
Free with trial Bar Chart Growth And Decline Line And Solid Icon Set. Financial Performance, Economic Trends, Business Analysis Symbol Collection. Data Visualization And Market Trends. Isolated Vector Illustration. Decrease graph icon vectors Bar Chart Growth And Decline Line And Solid Icon Set. Financial Performance, Economic Trends, Business Analysis Symbol
Free with trial Set line Global economic crisis, Dollar rate decrease and Money bomb dollar. Business infographic template. Vector. Decrease graph icon illustrations Set line Global economic crisis, Dollar rate decrease and Money bomb dollar. Business infographic template. Vector.
Free with trial Set line Money bag, Dollar rate decrease and Drop in crude oil price. Business infographic template. Vector. Decrease graph icon vectors Set line Money bag, Dollar rate decrease and Drop in crude oil price. Business infographic template. Vector
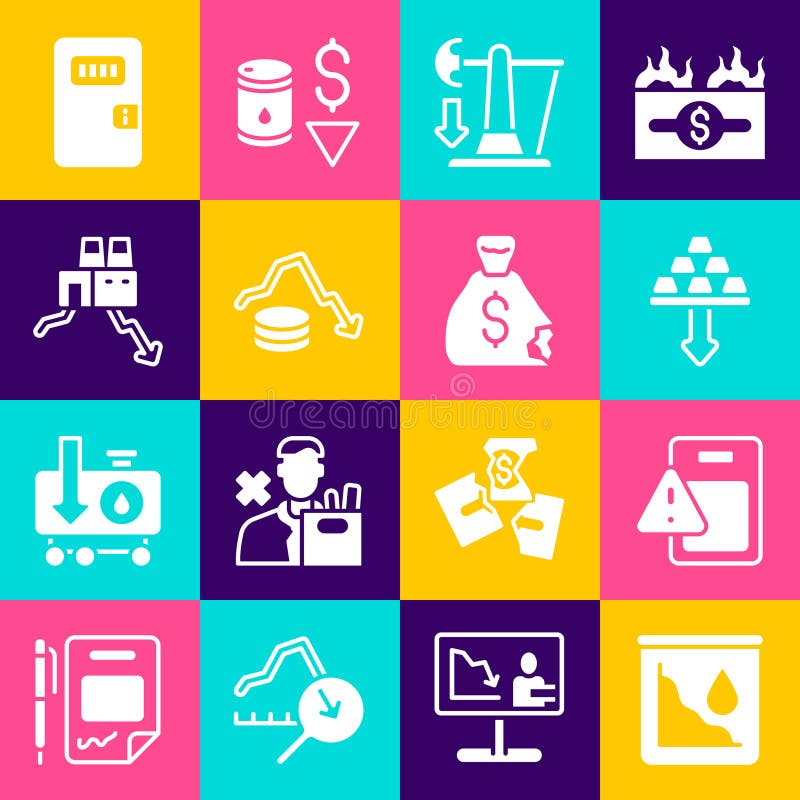
Free with trial Set line Shutdown of factory Pie chart infographic Tearing money banknote Storm Mobile stock trading Money bag Dollar rate decrease and Bank building icon. Vector. Decrease graph icon illustrations Set line Shutdown of factory, Pie chart infographic, Tearing money banknote, Storm, Mobile stock trading, Money bag. Set line Shutdown of factory Pie chart infographic Tearing money banknote Storm Mobile stock trading Money bag Dollar rate decrease and Bank building icon. Vector.
Free with trial Grey line Property and housing market collapse icon isolated seamless pattern on white background. Falling property prices. Real estate stock risk or economic recession. Vector. Decrease graph icon illustrations Grey line Property and housing market collapse icon isolated seamless pattern on white background. Falling property
Free with trial Hand drawn declining bar graph with a downward arrow illustrating a financial recession and business failure. Decrease graph icon vectors Hand drawn declining bar graph with a downward arrow illustrating a financial recession and business failure
Free with trial Set line Target, Wrench and gear, Financial growth decrease and Pie chart infographic. Blue square button. Vector. Decrease graph icon illustrations Set line Target, Wrench and gear, Financial growth decrease and Pie chart infographic. Blue square button. Vector
Free with trial Bar Chart With Downward Trend Line Icon. Financial Decline, Economic Recession, And Market Analysis Outline Symbol. Business Performance Tracking. Editable Stroke. Isolated Vector Illustration. Decrease graph icon vectors Bar Chart With Downward Trend Line Icon. Financial Decline, Economic Recession, And Market Analysis Outline Symbol
Free with trial Financial Crisis, Money Stack Down, Costs Cut Solid Flat Vector Icon Isolated on White Background. Decrease graph icon vectors Financial Crisis, Money Stack Down, Costs Cut Solid Flat Vector Icon Isolated on White Background
Free with trial Financial Crisis, Money Stack Down, Costs Cut Solid Flat Vector Icon Isolated on White Background. Decrease graph icon illustrations Financial Crisis, Money Stack Down, Costs Cut Solid Flat Vector Icon Isolated on White Background
Free with trial Bar Chart With Downward Trend Line Solid Icon. Financial Decline, Economic Downturn, And Market Analysis Silhouette Symbol. Business Performance Tracking. Isolated Vector Illustration. Decrease graph icon vectors Bar Chart With Downward Trend Line Solid Icon. Financial Decline, Economic Downturn, And Market Analysis Silhouette
Free with trial Digital tablet displaying a downward trending bar chart and arrow icon symbolizing financial loss or decline. Decrease graph icon vectors Digital tablet displaying a downward trending bar chart and arrow icon symbolizing financial loss or decline
Free with trial 3 points or step process infographic with round box container decrease gradually with modern dark style for slide presentation vector. Decrease graph icon illustrations 3 points or step process infographic with round box container decrease gradually with modern dark style for slide presentation
Free with trial Set line Dollar rate decrease Shutdown of factory Money bomb dollar crisis Drop in crude oil price Falling property prices Contract money and pen and Bank building icon. Vector. Decrease graph icon illustrations Set line Dollar rate decrease, Shutdown of factory, Money bomb dollar crisis, Drop in crude oil price, Falling property. Set line Dollar rate decrease Shutdown of factory Money bomb dollar crisis Drop in crude oil price Falling property prices Contract money and pen and Bank building icon. Vector.
Free with trial Set line Laptop with browser window Browser Financial growth decrease and Website stocks market. Business infographic template. Vector. Decrease graph icon illustrations Set line Laptop with browser window, Browser, Financial growth decrease and Website stocks market. Business infographic
Free with trial Hand drawn bar graph showing a downward trend with a sale tag for discounts price reductions and market decline. Decrease graph icon vectors Hand drawn bar graph showing a downward trend with a sale tag for discounts price reductions and market decline
Free with trial Eight circular icons with black backgrounds each feature a different chart or graph symbol. The frames are bordered by a sequence of colorful lines: red, green, blue, and yellow. The icons include bar graphs, line graphs, a pie chart, and scatter plots, all depicted in white. Each symbol includes axes and grid patterns, indicating statistical or financial data representation. The arrangement is in two rows of four, emphasizing symmetry and variety in chart types. A i Generated. Decrease graph icon vectors Collection of eight different chart and graph icons displayed in circular black frames with colorful borders. Eight circular icons with black backgrounds each feature a different chart or graph symbol. The frames are bordered by a sequence of colorful lines: red, green, blue, and yellow. The icons include bar graphs, line graphs, a pie chart, and scatter plots, all depicted in white. Each symbol includes axes and grid patterns, indicating statistical or financial data representation. The arrangement is in two rows of four, emphasizing symmetry and variety in chart types. A i Generated
Free with trial Set line Stop delivery cargo truck Dollar rate decrease Money bomb dollar crisis Hanging sign with Sale Mobile stock trading Drop crude oil price and Glass money jar coin icon. Vector. Decrease graph icon illustrations Set line Stop delivery cargo truck, Dollar rate decrease, Money bomb dollar crisis, Hanging sign with Sale, Mobile stock. Set line Stop delivery cargo truck Dollar rate decrease Money bomb dollar crisis Hanging sign with Sale Mobile stock trading Drop crude oil price and Glass money jar coin icon. Vector.
Free with trial Grey line Global economic crisis news icon isolated seamless pattern on white background. World finance crisis. Vector. Decrease graph icon illustrations Grey line Global economic crisis news icon isolated seamless pattern on white background. World finance crisis. Vector
Free with trial Set line Dollar rate decrease Contract money and pen Briefcase Gold bars Falling property prices Mobile stock trading Debt ball chained coin and Stop delivery cargo truck icon. Vector. Decrease graph icon illustrations Set line Dollar rate decrease, Contract money and pen, Briefcase, Gold bars, Falling property prices, Mobile stock. Set line Dollar rate decrease Contract money and pen Briefcase Gold bars Falling property prices Mobile stock trading Debt ball chained coin and Stop delivery cargo truck icon. Vector.
Free with trial Set line Casino signboard Financial growth decrease and chip with dollar. Business infographic template. Vector. Decrease graph icon vectors Set line Casino signboard, Financial growth decrease and chip with dollar. Business infographic template. Vector
Free with trial Bar Chart With Downward Arrow Line Icon. Business Decline, Financial Loss, And Market Downturn Outline Symbol. Economic Analysis And Trend Tracking. Editable Stroke. Isolated Vector Illustration. Decrease graph icon vectors Bar Chart With Downward Arrow Line Icon. Business Decline, Financial Loss, And Market Downturn Outline Symbol. Economic
Free with trial Decreasing bar graph illustration simple hand drawn financial decline, negative trend analysis chart with arrow axes, AI. Decrease graph icon vectors Decreasing bar graph illustration simple hand drawn financial decline, negative trend analysis chart with arrow axes, AI
Free with trial Set Dollar rate decrease Drop in crude oil price Fire burning house Tearing money banknote Mobile stock trading Shutdown of factory Pie chart infographic and icon. Vector. Decrease graph icon vectors Set Dollar rate decrease, Drop in crude oil price, Fire burning house, Tearing money banknote, Mobile stock trading. Set Dollar rate decrease Drop in crude oil price Fire burning house Tearing money banknote Mobile stock trading Shutdown of factory Pie chart infographic and icon. Vector.
Free with trial Up and Down sign with green and red arrows vector illustration. Concept of sales bar chart symbol icon with arrow moving down and sales bar chart with arrow moving up. Decrease graph icon vectors Up and Down sign with green and red arrows vector illustration. Concept of sales bar chart symbol icon
Free with trial Finance icons set in duotone outline stroke design for web. Pack pictograms of money, search, graph, businessman, bank, justice, coins, handshake, deposit, briefcase, atm, other. Vector illustration. Decrease graph icon vectors Finance icons set in duotone outline stroke design for web. Pack pictograms of money, search, graph, businessman, bank, justice
Free with trial Set line Bank building Shutdown of factory Prison cell door Dollar rate decrease Global economic crisis Employee dismissal Storm and Pie chart infographic icon. Vector. Decrease graph icon vectors Set line Bank building, Shutdown of factory, Prison cell door, Dollar rate decrease, Global economic crisis, Employee. Set line Bank building Shutdown of factory Prison cell door Dollar rate decrease Global economic crisis Employee dismissal Storm and Pie chart infographic icon. Vector.
Free with trial Set line Data analysis Financial growth decrease Cloud and shield and Browser with stocks market. Business infographic template. Vector. Decrease graph icon illustrations Set line Data analysis, Financial growth decrease, Cloud and shield and Browser with stocks market. Business infographic
Free with trial Set line Global economic crisis Mobile stock trading Dollar rate decrease Shutdown of factory Safe Drop crude oil price and Calculation expenses icon. Vector. Decrease graph icon vectors Set line Global economic crisis, Mobile stock trading, Dollar rate decrease, Shutdown of factory, Safe, Drop crude oil. Set line Global economic crisis Mobile stock trading Dollar rate decrease Shutdown of factory Safe Drop crude oil price and Calculation expenses icon. Vector.
Free with trial Set Global economic crisis Drop in crude oil price Dollar rate decrease Employee dismissal Hanging sign with Sale and Gold bars icon. Vector. Decrease graph icon illustrations Set Global economic crisis, Drop in crude oil price, Dollar rate decrease, Employee dismissal, Hanging sign with Sale. Set Global economic crisis Drop in crude oil price Dollar rate decrease Employee dismissal Hanging sign with Sale and Gold bars icon. Vector.
Free with trial Set Drop in crude oil price Global economic crisis Gold bars Dollar rate decrease Shutdown of factory Prison cell door and Money bag icon. Vector. Decrease graph icon illustrations Set Drop in crude oil price, Global economic crisis, Gold bars, Dollar rate decrease, Shutdown of factory, Prison cell. Set Drop in crude oil price Global economic crisis Gold bars Dollar rate decrease Shutdown of factory Prison cell door and Money bag icon. Vector.
Free with trial Set Data analysis Financial growth and decrease on seamless pattern. Vector. Decrease graph icon vectors Set Data analysis, Financial growth and decrease on seamless pattern. Vector
Free with trial Set Fire in burning house Broken piggy bank Pie chart infographic Contract money and pen Drop crude oil price Gold bars Dollar rate decrease and icon. Vector. Decrease graph icon vectors Set Fire in burning house, Broken piggy bank, Pie chart infographic, Contract money and pen, Drop crude oil price, Gold. Set Fire in burning house Broken piggy bank Pie chart infographic Contract money and pen Drop crude oil price Gold bars Dollar rate decrease and icon. Vector.
Free with trial Digital tablet icon displaying a bar chart with a downward trend arrow and percentage sign, indicating decline or loss. Decrease graph icon vectors Digital tablet icon displaying a bar chart with a downward trend arrow and percentage sign, indicating decline or loss
Free with trial Business graph with falling down arrow loss finance animation, city background. Decrease graph icon illustrations Business graph with falling down arrow loss finance animation, city background
Free with trial Business graph with falling down arrow loss finance animation, city background. Decrease graph icon illustrations Business graph with falling down arrow loss finance animation, city background
Free with trial Business graph with falling down arrow loss finance animation, city background. Decrease graph icon illustrations Business graph with falling down arrow loss finance animation, city background
Free with trial Set line Shutdown of factory Pie chart infographic Dollar rate decrease Employee dismissal Bank building Drop crude oil price and Tearing money banknote icon. Vector. Decrease graph icon vectors Set line Shutdown of factory, Pie chart infographic, Dollar rate decrease, Employee dismissal, Bank building, Drop crude. Set line Shutdown of factory Pie chart infographic Dollar rate decrease Employee dismissal Bank building Drop crude oil price and Tearing money banknote icon. Vector.
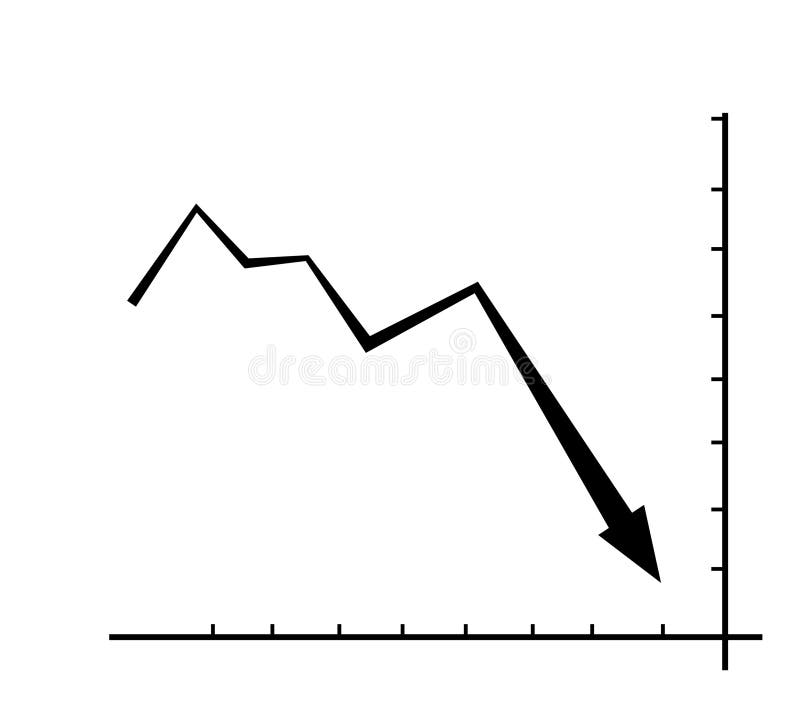
Free with trial Black and white descending graph diagram. loss or decline. flat design style. Suitable for use in reports, illustrations, presentations, etc. vector design template. Decrease graph icon vectors Black and white descending graph diagram. loss or decline. flat design style. Suitable for use in reports, illustrations
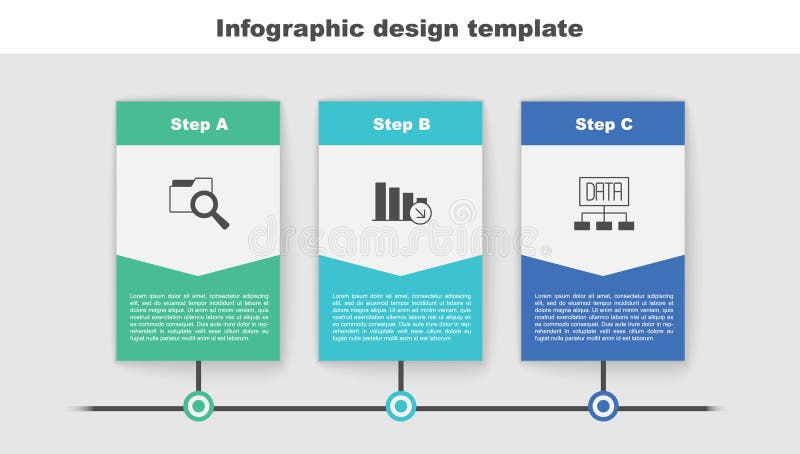
Free with trial Set Search with folder Financial growth decrease and Data analysis. Business infographic template. Vector. Decrease graph icon illustrations Set Search with folder, Financial growth decrease and Data analysis. Business infographic template. Vector
Free with trial Set Drop in crude oil price, Calculation of expenses, and Dollar rate decrease on seamless pattern. Vector. Decrease graph icon vectors Set Drop in crude oil price, Calculation of expenses, and Dollar rate decrease on seamless pattern. Vector
Free with trial Set Credit card, Broken piggy bank, Drop in crude oil price, Global economic crisis and Shutdown of factory icon. Vector. Decrease graph icon vectors Set Credit card, Broken piggy bank, Drop in crude oil price, Global economic crisis and Shutdown of factory icon. Vector
Free with trial Bar Chart With Downward Arrow Solid Icon. Financial Decline, Economic Downturn, And Business Loss Silhouette Symbol. Market Analysis And Trend Observation. Isolated Vector Illustration. Decrease graph icon vectors Bar Chart With Downward Arrow Solid Icon. Financial Decline, Economic Downturn, And Business Loss Silhouette Symbol
Free with trial Glowing neon line Global economic crisis news icon isolated on brick wall background. World finance crisis. Vector. Decrease graph icon illustrations Glowing neon line Global economic crisis news icon isolated on brick wall background. World finance crisis. Vector
Free with trial Colorful Property and housing market collapse icon isolated on white background. Falling property prices. Real estate stock risk or economic recession. Square button. 3D render illustration. Decrease graph icon illustrations Colorful Property and housing market collapse icon isolated on white background. Falling property prices. Real estate
Free with trial Colorful Property and housing market collapse icon isolated on white background. Falling property prices. Real estate stock risk or economic recession. Minimalism concept. 3D render illustration. Decrease graph icon illustrations Colorful Property and housing market collapse icon isolated on white background. Falling property prices. Real estate
Free with trial Bar Chart With Downward Arrow Solid Icon. Financial Decline, Economic Downturn, And Business Loss Silhouette Symbol. Market Analysis And Trend Evaluation. Isolated Vector Illustration. Decrease graph icon vectors Bar Chart With Downward Arrow Solid Icon. Financial Decline, Economic Downturn, And Business Loss Silhouette Symbol
Free with trial Pink and green graph. Motion. Cartoon animation with graphs with a white dot moving to the left. High quality 4k footage. Decrease graph icon illustrations Pink and green graph. Motion.Cartoon animation with graphs with a white dot moving to the left.
Free with trial Pink and green graph. Motion. Cartoon animation with graphs with a white dot moving to the left. High quality 4k footage. Decrease graph icon illustrations Pink and green graph. Motion.Cartoon animation with graphs with a white dot moving to the left.
Free with trial Pink and green graph. Motion. Cartoon animation with graphs with a white dot moving to the left. High quality 4k footage. Decrease graph icon illustrations Pink and green graph. Motion.Cartoon animation with graphs with a white dot moving to the left.
Free with trial Money Loss, risk line flat icon for mobile application, button and website design. Illustration isolated on white background illustration. Decrease graph icon illustrations Money Loss, risk line flat icon for mobile application, button and website design. Illustration isolated on white background
Free with trial Set line Pie chart infographic Financial growth decrease and Search data analysis on seamless pattern. Vector. Decrease graph icon illustrations Set line Pie chart infographic, Financial growth decrease and Search data analysis on seamless pattern. Vector
Free with trial Declining bar graph illustration showing negative trend of business or economic recession or market crash with downward arrow. Decrease graph icon vectors Declining bar graph illustration showing negative trend of business or economic recession or market crash with downward arrow
Free with trial Black Searching for food in trash can on streets outdoors icon isolated on transparent background. Homelessness and poverty concept. Green square button. Decrease graph icon illustrations Black Searching for food in trash can on streets outdoors icon isolated on transparent background. Homelessness and
Free with trial Shiny metallic percentage sign centered on blue financial graph background. Selective focus highlights symbol over stock market data. Represents finance, business, price, discount sale. Decrease graph icon illustrations Shiny metallic percentage sign centered on blue financial graph background. Selective focus highlights symbol over stock market
Free with trial Set Pie chart infographic, Financial growth decrease, Data analysis and Search data on seamless pattern. Vector. Decrease graph icon illustrations Set Pie chart infographic, Financial growth decrease, Data analysis and Search data on seamless pattern. Vector
Free with trial Pop art line Global economic crisis icon isolated on color background. World finance crisis. Vector. Decrease graph icon illustrations Pop art line Global economic crisis icon isolated on color background. World finance crisis. Vector
Free with trial Set line Pie chart infographic Global economic crisis and Drop crude oil price icon. Vector. Decrease graph icon vectors Set line Pie chart infographic, Global economic crisis and Drop crude oil price icon. Vector
Free with trial Cartoon Gesture Icon Mockup. Flat 3d isometric businessman hand turn cost dial to low position. Cost reduction management concept. 3D rendering on white background. Decrease graph icon vectors Cartoon Gesture Icon Mockup.Flat 3d isometric businessman hand turn cost dial to low position.
Free with trial Isometric line Global economic crisis icon isolated on yellow background. World finance crisis. Black circle button. Vector. Decrease graph icon vectors Isometric line Global economic crisis icon isolated on yellow background. World finance crisis. Black circle button
Free with trial Green Global economic crisis icon isolated on green background. World finance crisis. Long shadow style. Vector. Decrease graph icon vectors Green Global economic crisis icon isolated on green background. World finance crisis. Long shadow style. Vector
Free with trial Glowing neon line Global economic crisis icon isolated on black background. World finance crisis. Vector. Decrease graph icon illustrations Glowing neon line Global economic crisis icon isolated on black background. World finance crisis. Vector