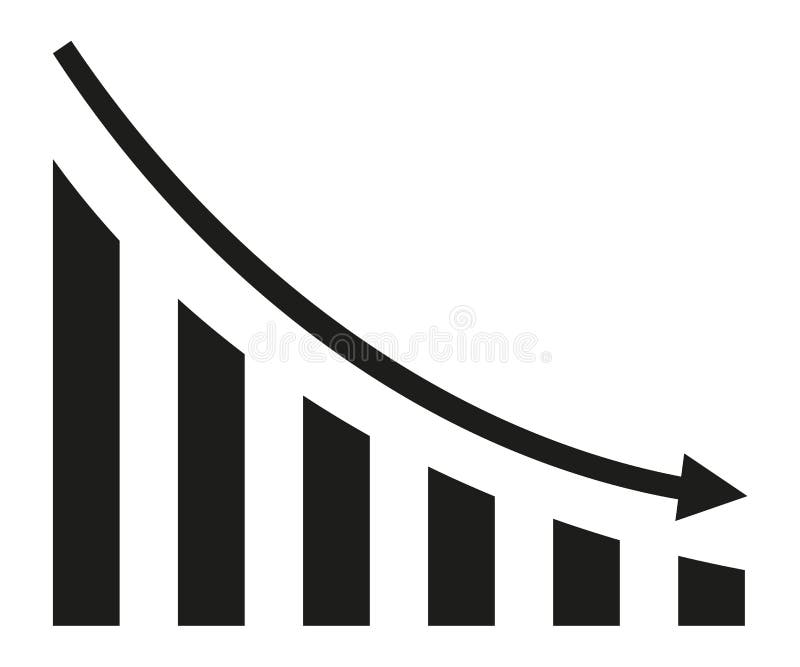
Free with trial Statistic line icon. Finance and unsuccessful investments. Stroke high quality symbol. Decrease icon in modern line style on white background. Arrow pointing down on graph. Green Graphic Chart Icon. Decrease graph icon vectors Statistic line icon. Finance and unsuccessful investments. Stroke high quality symbol. Decrease icon in modern line style on white
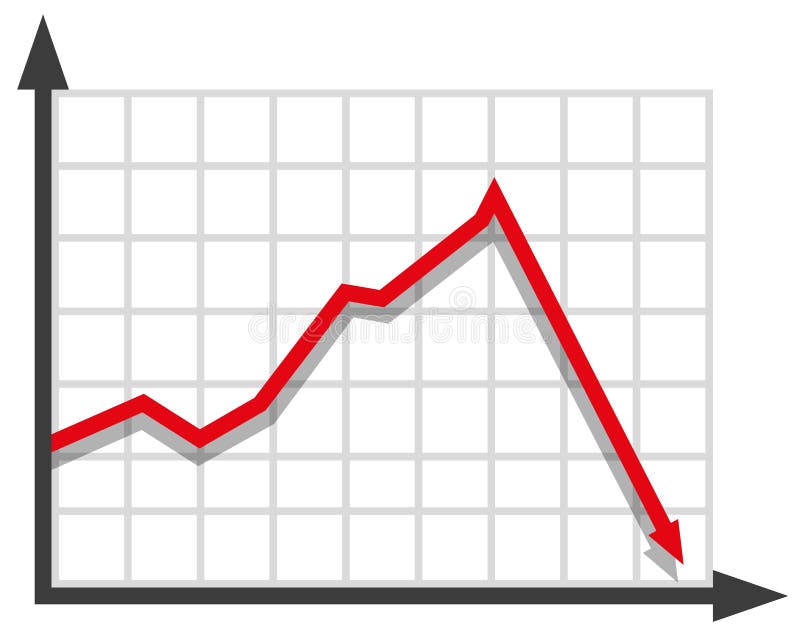
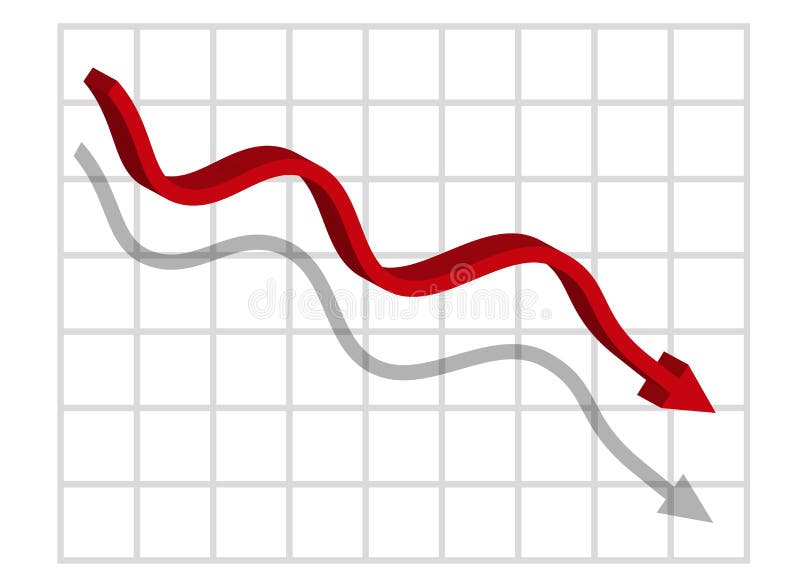
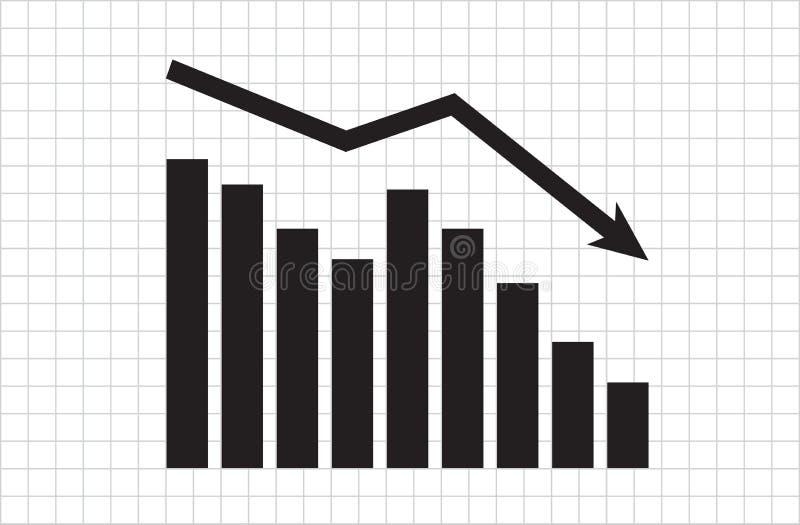
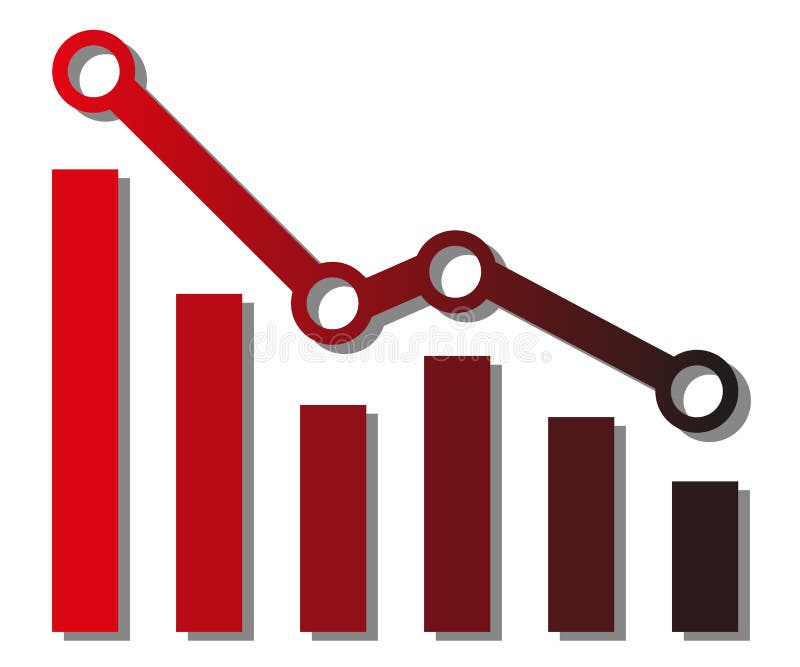
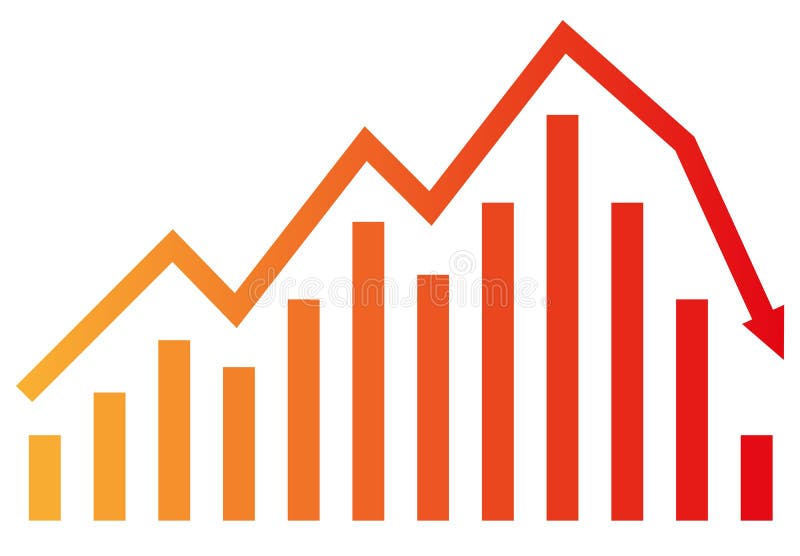
Free with trial Graph with decrease report. Diagram with recession and bankruptcy progress. Business and finance vector illustration. Decrease graph icon vectors Graph with decrease report. Diagram with recession and bankruptcy progress. Business and finance
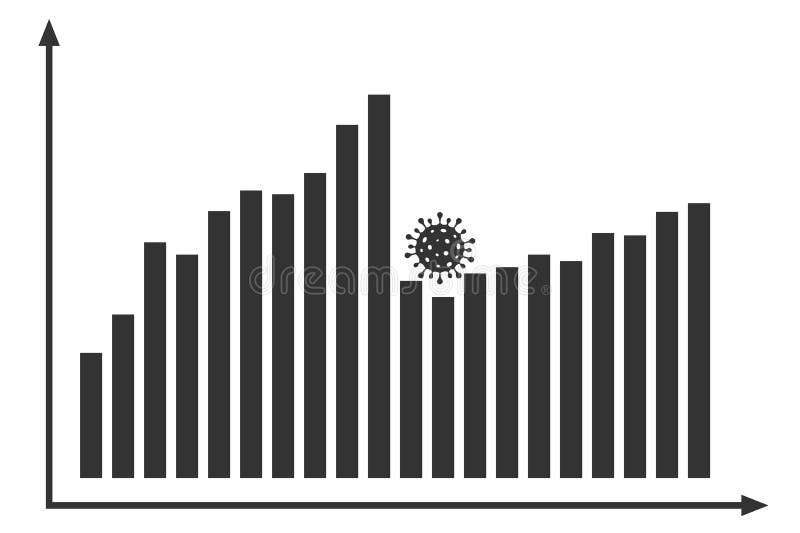
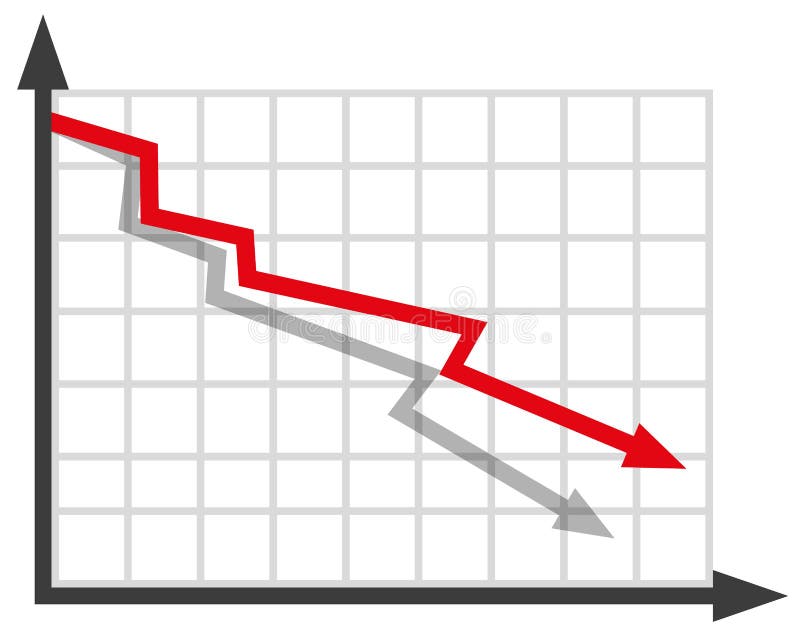
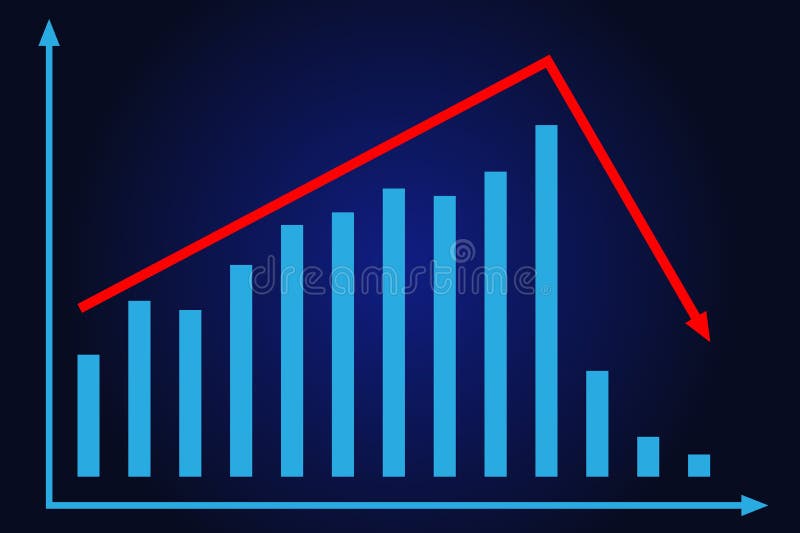
Free with trial Graph with covid decrease report. Diagram with coronavirus recession and bankruptcy progress. Vector illustration. Decrease graph icon vectors Graph with covid decrease report. Diagram with coronavirus recession and bankruptcy progress
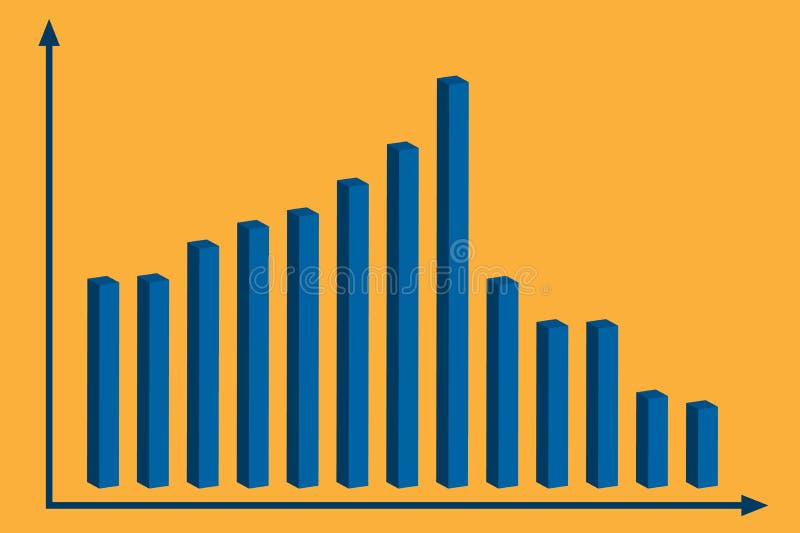
Free with trial Statistic line icon. Finance and unsuccessful investments. Stroke high quality symbol. Decrease icon in modern line style on white background. Arrow pointing down on graph. Green Bar Chart Icon. Decrease graph icon vectors Statistic line icon. Finance and unsuccessful investments. Stroke high quality symbol. Decrease icon in modern line style on white
Free with trial Set line Search engine, Online shopping on screen, Graph chart infographic and Financial growth decrease icon. Vector. Decrease graph icon illustrations Set line Search engine, Online shopping on screen, Graph chart infographic and Financial growth decrease icon. Vector
Free with trial Set line Financial growth decrease New chat messages notification Browser setting and Graph chart infographic icon. Vector. Decrease graph icon vectors Set line Financial growth decrease, New chat messages notification, Browser setting and Graph chart infographic icon
Free with trial Set line Financial growth decrease, Graph, chart, diagram, Arrow and icon. Vector. Decrease graph icon illustrations Set line Financial growth decrease, Graph, chart, diagram, Arrow and icon. Vector
Free with trial Set Pie chart infographic Arrow Financial growth decrease Graph chart diagram Many ways directional arrow Infographic element and Old hourglass with sand icon. Vector. Decrease graph icon vectors Set Pie chart infographic, Arrow, Financial growth decrease, Graph, chart, diagram, Many ways directional arrow. Set Pie chart infographic Arrow Financial growth decrease Graph chart diagram Many ways directional arrow Infographic element and Old hourglass with sand icon. Vector.
Free with trial Set Data analysis Folder and lock Network cloud connection Document with graph chart Financial growth decrease Browser exclamation mark and icon. Vector. Decrease graph icon illustrations Set Data analysis, Folder and lock, Network cloud connection, Document with graph chart, Financial growth decrease. Set Data analysis Folder and lock Network cloud connection Document with graph chart Financial growth decrease Browser exclamation mark and icon. Vector.
Free with trial Set Data analysis Folder and lock Network cloud connection Document with graph chart Financial growth decrease Browser exclamation mark and icon. Vector. Decrease graph icon vectors Set Data analysis, Folder and lock, Network cloud connection, Document with graph chart, Financial growth decrease. Set Data analysis Folder and lock Network cloud connection Document with graph chart Financial growth decrease Browser exclamation mark and icon. Vector.
Free with trial Set Binary code Document with graph chart Search cloud computing Financial growth decrease Processor CPU Data analysis and icon. Vector. Decrease graph icon vectors Set Binary code, Document with graph chart, Search cloud computing, Financial growth decrease, Processor CPU, Data. Set Binary code Document with graph chart Search cloud computing Financial growth decrease Processor CPU Data analysis and icon. Vector.
Free with trial Set Binary code Document with graph chart Search cloud computing Financial growth decrease Processor CPU Data analysis and icon. Vector. Decrease graph icon illustrations Set Binary code, Document with graph chart, Search cloud computing, Financial growth decrease, Processor CPU, Data. Set Binary code Document with graph chart Search cloud computing Financial growth decrease Processor CPU Data analysis and icon. Vector.
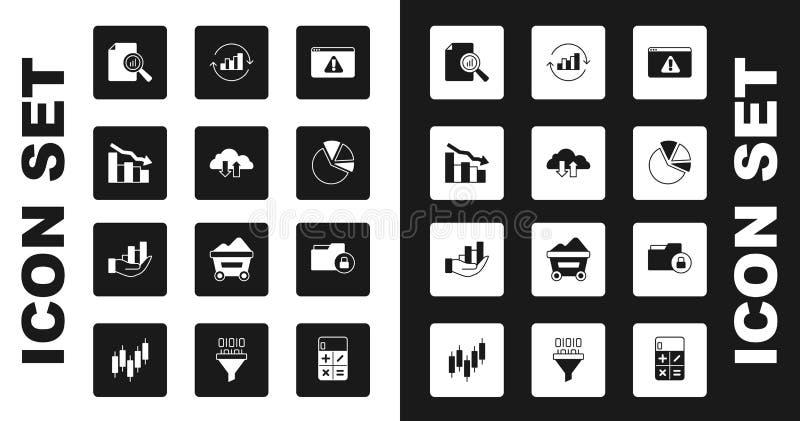
Free with trial Set Browser with exclamation mark Cloud download and upload Financial growth decrease Document graph chart Pie infographic Folder lock and icon. Vector. Decrease graph icon vectors Set Browser with exclamation mark, Cloud download and upload, Financial growth decrease, Document graph chart, Pie. Set Browser with exclamation mark Cloud download and upload Financial growth decrease Document graph chart Pie infographic Folder lock and icon. Vector.
Free with trial Set Browser with exclamation mark Cloud download and upload Financial growth decrease Document graph chart Pie infographic Folder lock and icon. Vector. Decrease graph icon illustrations Set Browser with exclamation mark, Cloud download and upload, Financial growth decrease, Document graph chart, Pie. Set Browser with exclamation mark Cloud download and upload Financial growth decrease Document graph chart Pie infographic Folder lock and icon. Vector.
Free with trial Set line Many ways directional arrow Digital speed meter Shopping bag with Sale Financial growth decrease Graph chart diagram Pyramid infographics Intersection point and Arrow icon. Vector. Decrease graph icon illustrations Set line Many ways directional arrow, Digital speed meter, Shopping bag with Sale, Financial growth decrease, Graph. Set line Many ways directional arrow Digital speed meter Shopping bag with Sale Financial growth decrease Graph chart diagram Pyramid infographics Intersection point and Arrow icon. Vector.
Free with trial Set line Many ways directional arrow Digital speed meter Shopping bag with Sale Financial growth decrease Graph chart diagram Pyramid infographics Intersection point and Arrow icon. Vector. Decrease graph icon vectors Set line Many ways directional arrow, Digital speed meter, Shopping bag with Sale, Financial growth decrease, Graph. Set line Many ways directional arrow Digital speed meter Shopping bag with Sale Financial growth decrease Graph chart diagram Pyramid infographics Intersection point and Arrow icon. Vector.
Free with trial 20 Startup Solid Glyph icon Pack like transform flip graph down decrease. Decrease graph icon vectors 20 Startup Solid Glyph icon Pack like transform flip graph down decrease
Free with trial Set Financial growth, Arrow, Graph, chart, diagram, decrease, Many ways directional arrow, Flag and icon. Vector. Decrease graph icon vectors Set Financial growth, Arrow, Graph, chart, diagram, decrease, Many ways directional arrow, Flag and icon. Vector
Free with trial Set line Financial growth decrease Unknown search Mountains with flag Flag Graph chart diagram Infographic element and increase icon. Vector. Decrease graph icon vectors Set line Financial growth decrease, Unknown search, Mountains with flag, Flag, Graph, chart, diagram, Infographic. Set line Financial growth decrease Unknown search Mountains with flag Flag Graph chart diagram Infographic element and increase icon. Vector.
Free with trial Set line Location Graph chart diagram Financial growth decrease Pie infographic Flag Shopping bag with Sale Arrow and Project team base icon. Vector. Decrease graph icon vectors Set line Location, Graph, chart, diagram, Financial growth decrease, Pie infographic, Flag, Shopping bag with Sale. Set line Location Graph chart diagram Financial growth decrease Pie infographic Flag Shopping bag with Sale Arrow and Project team base icon. Vector.
Free with trial Set line Arrow Flag Clock Financial growth decrease Pyramid chart infographics Graph chart diagram and Intersection point icon. Vector. Decrease graph icon illustrations Set line Arrow, Flag, Clock, Financial growth decrease, Pyramid chart infographics, Graph, chart, diagram and. Set line Arrow Flag Clock Financial growth decrease Pyramid chart infographics Graph chart diagram and Intersection point icon. Vector.
Free with trial Set line Arrow Flag Clock Financial growth decrease Pyramid chart infographics Graph chart diagram and Intersection point icon. Vector. Decrease graph icon vectors Set line Arrow, Flag, Clock, Financial growth decrease, Pyramid chart infographics, Graph, chart, diagram and. Set line Arrow Flag Clock Financial growth decrease Pyramid chart infographics Graph chart diagram and Intersection point icon. Vector.
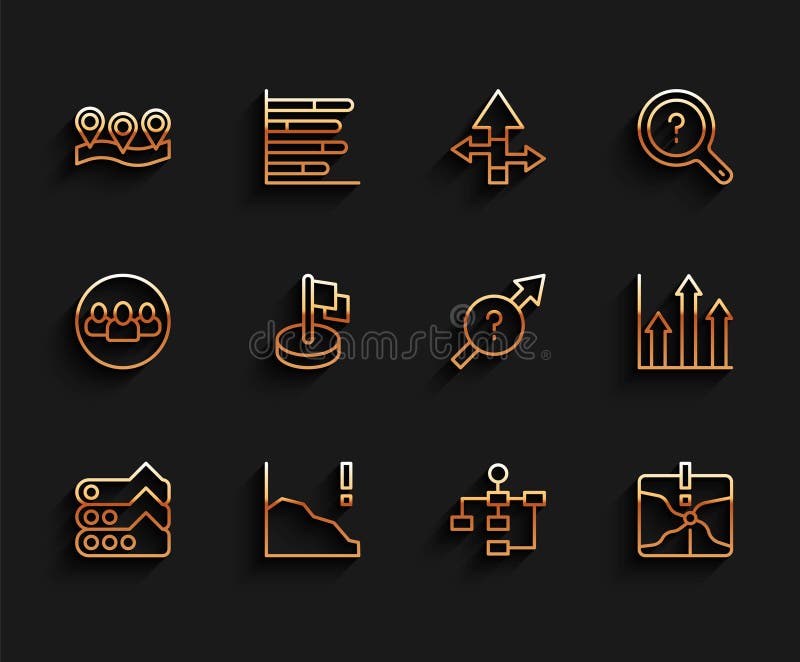
Free with trial Set Unknown search Wrench and gear Clock Graph chart diagram Financial growth decrease Arrow Intersection point and Mountains with flag icon. Vector. Decrease graph icon illustrations Set Unknown search, Wrench and gear, Clock, Graph, chart, diagram, Financial growth decrease, Arrow, Intersection point. Set Unknown search Wrench and gear Clock Graph chart diagram Financial growth decrease Arrow Intersection point and Mountains with flag icon. Vector.
Free with trial Set Financial growth decrease Hierarchy organogram chart Old hourglass with sand Delivery tracking Graph diagram Pyramid infographics Target and Many ways directional arrow icon. Vector. Decrease graph icon vectors Set Financial growth decrease, Hierarchy organogram chart, Old hourglass with sand, Delivery tracking, Graph, diagram. Set Financial growth decrease Hierarchy organogram chart Old hourglass with sand Delivery tracking Graph diagram Pyramid infographics Target and Many ways directional arrow icon. Vector.
Free with trial Set line Graph chart diagram Financial growth decrease Location Hierarchy organogram Intersection point Flag Pie infographic and Arrow icon. Vector. Decrease graph icon vectors Set line Graph, chart, diagram, Financial growth decrease, Location, Hierarchy organogram, Intersection point, Flag, Pie. Set line Graph chart diagram Financial growth decrease Location Hierarchy organogram Intersection point Flag Pie infographic and Arrow icon. Vector.
Free with trial Set line Graph chart diagram Pie infographic Financial growth decrease Clock Digital speed meter Old hourglass with sand and Arrow icon. Vector. Decrease graph icon vectors Set line Graph, chart, diagram, Pie infographic, Financial growth decrease, Clock, Digital speed meter, Old hourglass. Set line Graph chart diagram Pie infographic Financial growth decrease Clock Digital speed meter Old hourglass with sand and Arrow icon. Vector.
Free with trial Set line Graph chart diagram Pie infographic Financial growth decrease Clock Digital speed meter Old hourglass with sand and Arrow icon. Vector. Decrease graph icon illustrations Set line Graph, chart, diagram, Pie infographic, Financial growth decrease, Clock, Digital speed meter, Old hourglass. Set line Graph chart diagram Pie infographic Financial growth decrease Clock Digital speed meter Old hourglass with sand and Arrow icon. Vector.
Free with trial Economic decrease graph gold coins illustration. Decrease graph icon vectors Economic decrease graph gold coins
Free with trial Money icon with arrows, capital decrease and increase, dollar rate increase, investment concept – stock vector. Decrease graph icon illustrations Money icon with arrows, capital decrease and increase, dollar rate increase, investment concept – vector
Free with trial Low rate profit cost icon. Reduction cost decrease percent profit down sign. Decrease graph icon vectors Low rate profit cost icon. Reduction cost decrease percent profit down sign
Free with trial GDP decrease fall, red arrow and percent icon. Vector GDP, investment profit loss arrow down symbol. Decrease graph icon vectors GDP decrease fall, red arrow percent icon. Vector GDP, investment profit loss arrow down symbol
Free with trial Fall down chart. Finance crisis, business problem and economy drop. Down arrow graph, loss and decrease income. Profit declining vector set. Crisis economy, arrow down, problem decrease illustration. Decrease graph icon vectors Fall down chart. Finance crisis, business problem and economy drop. Down arrow graph, loss and decrease income. Profit
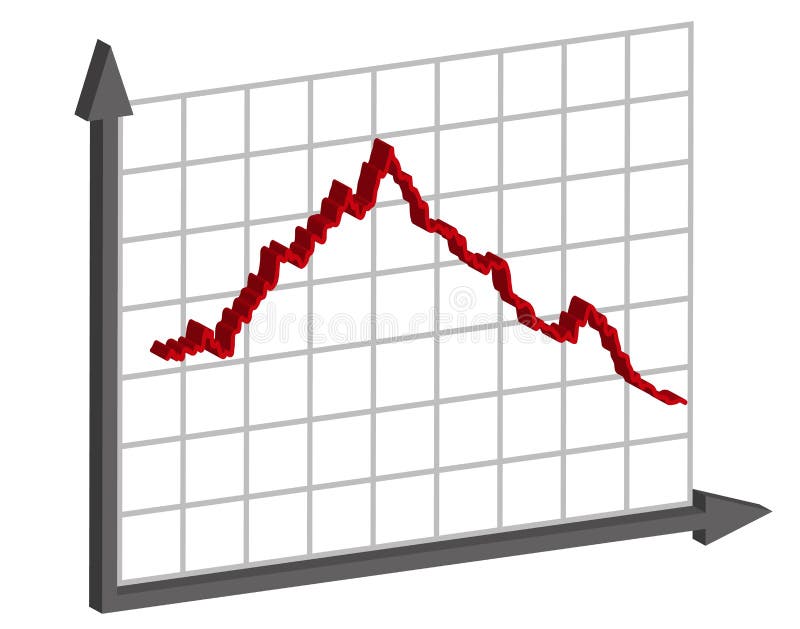
Free with trial Graph chart decline, fall market stock bar isometric icon. 3d vector illustration. Isolated line art technical drawing. Editable stroke. Decrease graph icon illustrations Graph chart decline, fall market stock bar isometric icon. 3d line art technical drawing. Editable stroke vector. graph chart decline, fall market stock bar isometric icon. 3d vector illustration. Isolated line art technical drawing. Editable stroke
Free with trial Money icon with arrows, capital decrease and increase, dollar rate increase, investment concept – stock vector. Decrease graph icon illustrations Money icon with arrows, capital decrease and increase, dollar rate increase, investment concept – vector
Free with trial Business management vector decrease icon. Decrease graph icon vectors Business management vector decrease icon
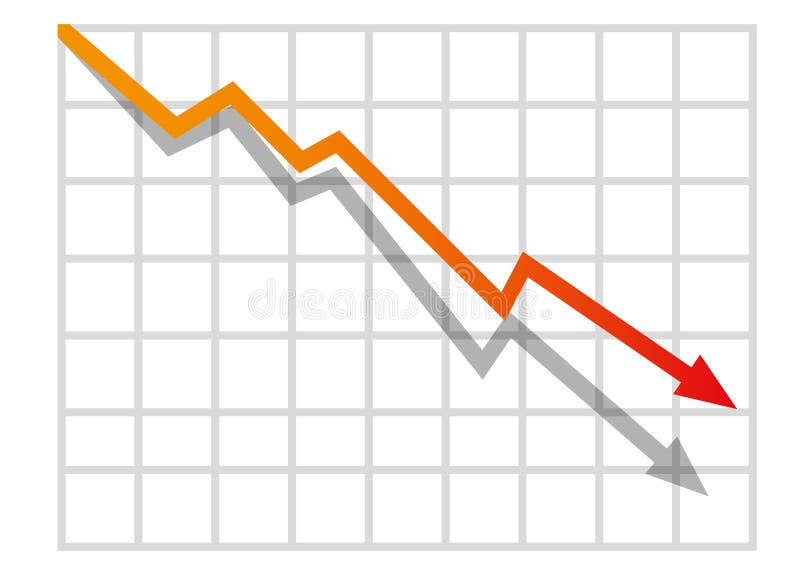
Free with trial Graph with decrease report. Diagram with recession and bankruptcy progress. Business and finance vector illustration. Decrease graph icon vectors Graph with decrease report. Diagram with recession and bankruptcy progress. Business and finance vector
Free with trial Increase, decrease Arrow symbol set, icon business concept. Vector illustration on white background. Decrease graph icon vectors Increase, decrease Arrow symbol set, icon business concept. Vector illustration on white background.
Free with trial Graph chart decline, fall market stock bar isometric flat icon. 3d vector colorful illustration. Pictogram isolated on white background. Decrease graph icon vectors Graph chart decline, fall market stock bar isometric flat icon. 3d vector
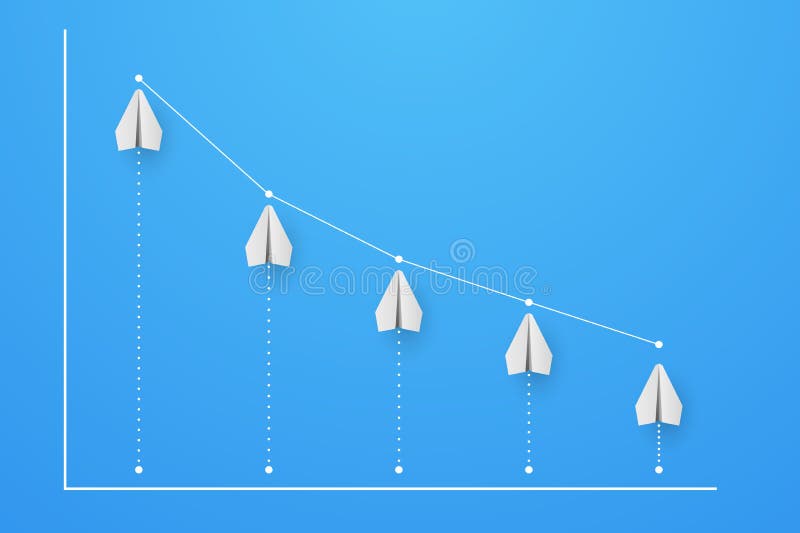
Free with trial Graph and diagram from planes with decrease. Finance and business concept. Vector Illustration. Decrease graph icon vectors Graph and diagram from planes with decrease. Finance and business concept. Vector
Free with trial Graph with decrease report. Diagram with recession and bankruptcy progress. Business and finance vector. Illustration. Decrease graph icon vectors Graph with decrease report. Diagram with recession and bankruptcy progress. Business and finance vector. Illustration
Free with trial Graph and diagram from planes with decrease. Finance and business concept. Vector Illustration. Decrease graph icon vectors Graph and diagram from planes with decrease. Finance and business concept
Free with trial Graph line icons. Vector illustration include icon - data analysis, diagram, stat, histogram, economy outline pictogram for infographic statistic presentation. 64x64 Pixel Perfect, Editable Stroke. Decrease graph icon illustrations Graph line icons. Vector illustration include icon - data analysis, diagram, stat, histogram, economy outline pictogram
Free with trial Income decrease graph, financial crisis rate, revenue decline chart, economy downturn, investment risk, fund management, budget deficit, vector illustration, flat icon. Decrease graph icon vectors Budget deficit, income decrease, economy decline, financial crisis, investment risk. Income decrease graph, financial crisis rate, revenue decline chart, economy downturn, investment risk, fund management, budget deficit, vector illustration, flat icon
Free with trial Graph with covid decrease report. Diagram with coronavirus recession and bankruptcy progress. Vector illustration. Decrease graph icon vectors Graph with covid decrease report. Diagram with coronavirus recession and bankruptcy progress. Vector
Free with trial Graph with covid decrease report. Diagram with coronavirus recession and bankruptcy progress. Vector illustration. Decrease graph icon vectors Graph with covid decrease report. Diagram with coronavirus recession and bankruptcy progress. Vector
Free with trial Graph with decrease report. Diagram with recession and bankruptcy progress. Business and finance vector illustration. Decrease graph icon vectors Graph with decrease report. Diagram with recession and bankruptcy progress
Free with trial Graph with decrease report. Diagram with recession and bankruptcy progress. Business and finance vector illustration. Decrease graph icon vectors Graph with decrease report. Diagram with recession and bankruptcy progress
Free with trial Graph down. Black Icon graph decline with arrow isolated on white background. Hologram statistic. Deficit direction for business concept design. Analysis information forecast. Vector illustration. Decrease graph icon vectors Graph down. Black Icon graph decline with arrow isolated on white background. Hologram deficit direction for business design. Graph down. Black Icon graph decline with arrow isolated on white background. Hologram statistic. Deficit direction for business concept design. Analysis information forecast. Vector illustration
Free with trial Graph down. Black icon graph decline with arrow isolated on white background. Hologram statistic. Deficit direction for business concept design. Analysis information forecast. Vector illustration. Decrease graph icon vectors Graph down. Black icon graph decline with arrow. Hologram statistic. Deficit direction business. Analysis information forecast. Graph down. Black icon graph decline with arrow isolated on white background. Hologram statistic. Deficit direction for business concept design. Analysis information forecast. Vector illustration
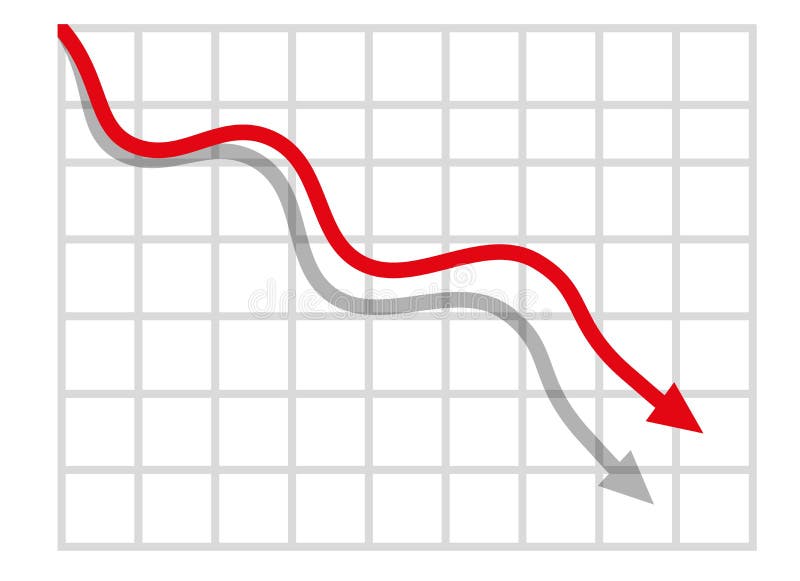
Free with trial Chart graph. Black Icon growth and downward with arrow isolated on background. Hologram positive, fall percentage. Design business concept direction growth, recession. Analysis. Vector illustration. Decrease graph icon vectors Chart graph. Black Icon growth and downward with arrow isolated on background. Hologram positive, fall percentage. Design business
Free with trial Market crash failure statistics icon flat vector. Economy graph. Financial stock economic decrease in chart. Investment crisis and business collapse. Board isolated on white background. Decrease graph icon vectors Market crash failure statistics icon flat vector
Free with trial Modern and various graph icons, bar chart, pie chart icon for indicating the progress. Decrease graph icon vectors Modern and various graph icons, bar chart, pie chart icon
Free with trial Cost reduction icon. Cost down concept. Businessman with hand lowers arrow of the graph. Vector illustration flat minimal line design. Isolated on background. Decrease down profit. Declining chart. Decrease graph icon vectors Cost reduction icon. Cost down concept
Free with trial Graph with decrease report. Diagram with recession and bankruptcy progress. Business and finance vector illustration. Decrease graph icon vectors Graph with decrease report. Diagram with recession and bankruptcy progress. Business and finance
Free with trial Graph with decrease report. Diagram with recession and bankruptcy progress. Business and finance vector illustration. Decrease graph icon vectors Graph with decrease report. Diagram with recession and bankruptcy progress. Business and finance
Free with trial Graph with decrease report. Diagram with recession and bankruptcy progress. Business and finance vector illustration. Decrease graph icon vectors Graph with decrease report. Diagram with recession and bankruptcy progress. Business and finance
Free with trial Graph with decrease report. Diagram with recession and bankruptcy progress. Business and finance vector illustration. Decrease graph icon vectors Graph with decrease report. Diagram with recession and bankruptcy progress. Business and finance
Free with trial Graph with decrease report. Diagram with recession and bankruptcy progress. Business and finance vector illustration. Decrease graph icon vectors Graph with decrease report. Diagram with recession and bankruptcy progress. Business and finance
Free with trial Decline graph vector line icon isolated on white background. Zigzag line going down line icon for infographic, website or app. Decrease graph icon vectors Decline graph vector line icon. Decline graph vector line icon isolated on white background. Zigzag line going down line icon for infographic, website or app.
Free with trial Graph with covid decrease report. Diagram with coronavirus recession and bankruptcy progress. Vector illustration. Decrease graph icon vectors Graph with covid decrease report. Diagram with coronavirus recession and bankruptcy progress
Free with trial Diagram with recession and bankruptcy progress. Graph with decrease report. Business and finance vector illustration. Decrease graph icon vectors Diagram with recession and bankruptcy progress. Graph with decrease report. Business and finance vector
Free with trial Graph with decrease report. Diagram with recession and bankruptcy progress. Business and finance vector illustration. Decrease graph icon vectors Graph with decrease report. Diagram with recession and bankruptcy progress. Business and finance vector
Free with trial Graph with decrease report. Diagram with recession and bankruptcy progress. Business and finance vector illustration. Decrease graph icon vectors Graph with decrease report. Diagram with recession and bankruptcy progress. Business and finance vector
Free with trial Graph with decrease report. Diagram with recession and bankruptcy progress. Business and finance vector illustration. Decrease graph icon vectors Graph with decrease report. Diagram with recession and bankruptcy progress. Business and finance vector
Free with trial Graph with decrease report. Diagram with recession and bankruptcy progress. Business and finance vector illustration. Decrease graph icon vectors Graph with decrease report. Diagram with recession and bankruptcy progress. Business and finance vector
Free with trial Graph with decrease report. Diagram with recession and bankruptcy progress. Business and finance vector illustration. Decrease graph icon vectors Graph with decrease report. Diagram with recession and bankruptcy progress. Business and finance vector
Free with trial Graph with decrease report. Diagram with recession and bankruptcy progress. Business and finance vector illustration. Decrease graph icon vectors Graph with decrease report. Diagram with recession and bankruptcy progress. Business and finance vector
Free with trial Graph with decrease report. Diagram with recession and bankruptcy progress. Business and finance vector illustration. Decrease graph icon vectors Graph with decrease report. Diagram with recession and bankruptcy progress. Business and finance vector
Free with trial Graph with decrease report. Diagram with recession and bankruptcy progress. Business and finance vector illustration. Decrease graph icon vectors Graph with decrease report. Diagram with recession and bankruptcy progress. Business and finance vector
Free with trial Graph with decrease report. Diagram with recession and bankruptcy progress. Business and finance vector illustration. Decrease graph icon vectors Graph with decrease report. Diagram with recession and bankruptcy progress. Business and finance vector
Free with trial Graph with decrease report. Diagram with recession and bankruptcy progress. Business and finance vector illustration. Decrease graph icon vectors Graph with decrease report. Diagram with recession and bankruptcy progress. Business and finance vector
Free with trial Graph with decrease report. Diagram with recession and bankruptcy progress. Business and finance vector illustration. Decrease graph icon vectors Graph with decrease report. Diagram with recession and bankruptcy progress. Business and finance vector
Free with trial Graph with decrease report. Diagram with recession and bankruptcy progress. Business and finance vector illustration. Decrease graph icon vectors Graph with decrease report. Diagram with recession and bankruptcy progress. Business and finance vector
Free with trial Graph with decrease report. Diagram with recession and bankruptcy progress. Business and finance vector illustration. Decrease graph icon vectors Graph with decrease report. Diagram with recession and bankruptcy progress. Business and finance vector
Free with trial Graph with decrease report. Diagram with recession and bankruptcy progress. Business and finance vector illustration. Decrease graph icon vectors Graph with decrease report. Diagram with recession and bankruptcy progress. Business and finance vector
Free with trial Graph with decrease report. Diagram with recession and bankruptcy progress. Business and finance vector illustration. Decrease graph icon vectors Graph with decrease report. Diagram with recession and bankruptcy progress. Business and finance vector