Free with trial Chat arrow down icon Vector set on white background. EPS 10. Decrease graph line icon vectors Chart arrow down icon set. decline downward chart vector symbol. stock trend downturn graph sign. negative economy bar Chart. Chat arrow down icon Vector set on white background. EPS 10
Free with trial Collection of business growth and financial analysis icons featuring bar charts and arrows with editable line art and flat shape style. Editable vector icon set. Decrease graph line icon vectors Collection of business growth and financial analysis icons featuring bar charts and arrows with editable line art and flat shape
Free with trial A collection of nine flat vector icons for data visualization including bar graphs, line charts, pie charts, and performance meters isolated on a white background. Decrease graph line icon vectors Simple black data analysis and business chart icon set. A collection of nine flat vector icons for data visualization including bar graphs, line charts, pie charts, and performance meters isolated on a white background
Free with trial Chat arrow down icon Vector set on white background. EPS 10. Decrease graph line icon vectors Chart arrow down icon set. decline downward chart vector symbol. stock trend downturn graph sign. negative economy bar Chart. Chat arrow down icon Vector set on white background. EPS 10
Free with trial Chat arrow down icon Vector set on white background. EPS 10. Decrease graph line icon vectors Chart arrow down icon set. decline downward chart vector symbol. stock trend downturn graph sign. negative economy bar Chart. Chat arrow down icon Vector set on white background. EPS 10
Free with trial Two drop and growth technology icon with gear. outline simple trend stats logotype graphic stroke art web design isolated on white. concept of key performance indicator or operation strategy symbol. Decrease graph line icon vectors Two drop and growth technology icon with gear
Free with trial Downward graph line with sad face, email icon, and user profile symbol. Ideal for analytics, failure, feedback, notification, business trends, communication and simple flat metaphor. Decrease graph line icon vectors Declining Chart with Sad Face, Email Notification, and User Profile Icons. Downward graph line with sad face, email icon, and user profile symbol. Ideal for analytics, failure, feedback, notification, business trends, communication and simple flat metaphor
Free with trial Business falling icon isolated on background vector illustration. Non AI Generate. Decrease graph line icon vectors Business falling icon isolated on background vector illustration.
Free with trial Downward graph trend with red points, sad face, and a file folder suggests failure, loss, or poor performance. Ideal for business, data, analysis, decline management error simple flat metaphor. Decrease graph line icon vectors Declining Graph with Sad Face Emphasizing Negative Analytics and Data Loss. Downward graph trend with red points, sad face, and a file folder suggests failure, loss, or poor performance. Ideal for business, data, analysis, decline management error simple flat metaphor
Free with trial Downward trend line on a graph, sad face emoticon, verified user profile. Ideal for analytics, decline monitoring, user feedback, quality control, performance review, error tracking simple flat. Decrease graph line icon vectors Declining Performance Chart with Sad Face and User Profile Checkmark. Downward trend line on a graph, sad face emoticon, verified user profile. Ideal for analytics, decline monitoring, user feedback, quality control, performance review, error tracking simple flat
Free with trial Funny pizza slice cartoon character presenting a sales report bar graph. This vector illustration is perfect for business analysis, food industry, and creative presentations about market trends. Decrease graph line icon illustrations Pizza Sales Report Cartoon Icon, Business Analysis Concept. Funny pizza slice cartoon character presenting a sales report bar graph. This vector illustration is perfect for business analysis, food industry, and creative presentations about market trends.
Free with trial A professional collection of 16 business and financial icons featuring various bar charts and line graphs. Perfect for UI dashboards, corporate presentations, and data-heavy infographics showing market growth or decline. Decrease graph line icon vectors Business Growth Bar Charts and Financial Trend Line Graph Vector Icons Set. A professional collection of 16 business and financial icons featuring various bar charts and line graphs. Perfect for UI dashboards, corporate presentations, and data-heavy infographics showing market growth or decline.
Free with trial A professional collection of 16 business and financial icons featuring various bar charts and line graphs. Perfect for UI dashboards, corporate presentations, and data-heavy infographics showing market growth or decline. Decrease graph line icon vectors Business Growth Bar Charts and Financial Trend Line Graph Vector Icons Set. A professional collection of 16 business and financial icons featuring various bar charts and line graphs. Perfect for UI dashboards, corporate presentations, and data-heavy infographics showing market growth or decline.
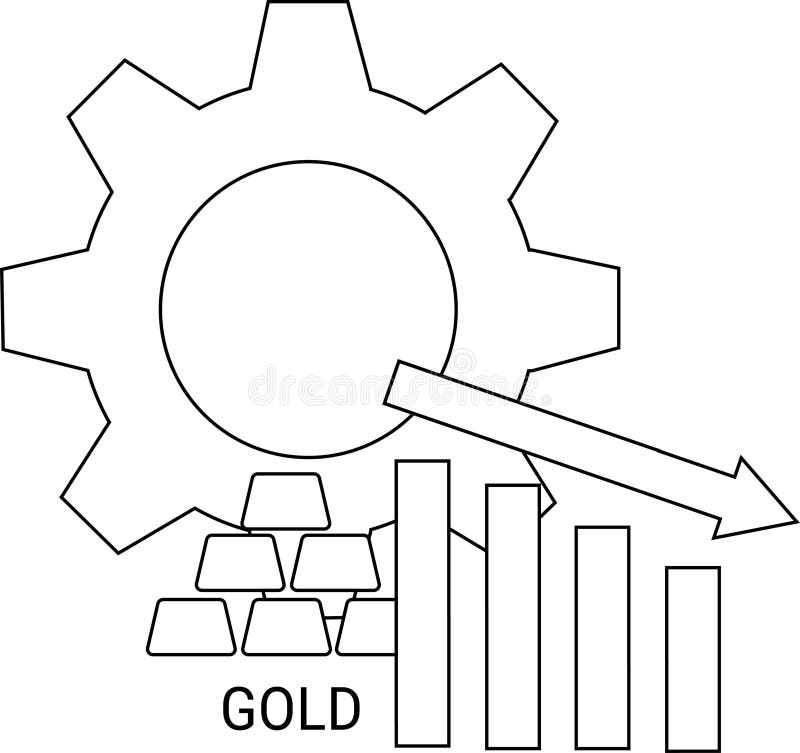
Free with trial Conceptual diagram depicting a decrease in gold production. Decrease graph line icon illustrations Gold Production Decrease Gear, Bars, Arrow Concept. Conceptual diagram depicting a decrease in gold production.
Free with trial Business performance, negative trends, data analysis, economic decline, search results, user concerns. Sad emoticon, graph with downward trend magnifying glass. Business and negative trends. Decrease graph line icon vectors Declining Graph with Sad Face and Search Bar Negative Trends and Analysis. Business performance, negative trends, data analysis, economic decline, search results, user concerns. Sad emoticon, graph with downward trend magnifying glass. Business and negative trends
Free with trial Flat icon showing a person, bars decreasing, and a downturn arrow next to a cross. Decrease graph line icon vectors Declining performance icon: person, bars, arrow, and cross. Flat icon showing a person, bars decreasing, and a downturn arrow next to a cross
Free with trial Set of vector line icons related to loan, bank credit rate, finance and investment. Symbols for website or app ui, logo design, illustration. Decrease graph line icon vectors Vector line icons of money credit and loan. Set of vector line icons related to loan, bank credit rate, finance and investment. Symbols for website or app ui, logo design, illustration
Free with trial Finance concept simple line icons set. Pack outline pictograms of deposit, growth, briefcase, secure, atm, insurance, banking, wallet, cash and other. Symbols for website and mobile app design. Decrease graph line icon illustrations Finance concept simple line icons set. Pack outline pictograms of deposit, growth, briefcase, secure, atm, insurance, banking
Free with trial Cardboard box with label beside a fluctuating line graph, denoting analytics, efficiency, shipment tracking, or delivery trends. Ideal for logistics, e-commerce, data trends, analysis operations. Decrease graph line icon vectors Box with Shipping Label and Data Graph Representing Logistics and Performance Trends. Cardboard box with label beside a fluctuating line graph, denoting analytics, efficiency, shipment tracking, or delivery trends. Ideal for logistics, e-commerce, data trends, analysis operations
Free with trial Line graph with downward trend and red markers, sad face symbolizing disappointment, outlined clouds indicating challenges. Ideal for analysis, business, growth, crisis, finance, performance or. Decrease graph line icon vectors Declining Graph with Sad Face and Clouds Representing Negative Trends and Challenges. Line graph with downward trend and red markers, sad face symbolizing disappointment, outlined clouds indicating challenges. Ideal for analysis, business, growth, crisis, finance, performance or
Free with trial Downward trend line on grid chart with sad face and progress icon signaling mediocre results or declining metrics. Ideal for failure, analytics, market loss, strategy, performance, results, simple. Decrease graph line icon illustrations Declining Trend on Graph with Sad Face Symbolizing Negative Results or Performance. Downward trend line on grid chart with sad face and progress icon signaling mediocre results or declining metrics. Ideal for failure, analytics, market loss, strategy, performance, results, simple
Free with trial Bold red downward graph arrow 2D cartoon object. Trend market decline. Descending line chart. Business loss. Economic downturn isolated element flat vector clip art on white. Spot illustration. Decrease graph line icon vectors Bold red downward graph arrow 2D cartoon object
Free with trial Sale discount icon continuous outline drawing simple style marketing white background. Decrease graph line icon vectors Sale discount icon continuous outline drawing simple style marketing
Free with trial Set of vector line icons related to loan, bank credit rate, finance and investment. Symbols for website or app UI, logo design, illustration. Decrease graph line icon vectors Vector line icons of money credit and loan. Set of vector line icons related to loan, bank credit rate, finance and investment. Symbols for website or app UI, logo design, illustration
Free with trial Single line art illustration of classic percent symbol isolated outline white background. Decrease graph line icon vectors Single line art illustration of classic percent symbol isolated outline
Free with trial Percent sign simple outline single line art illustration isolated design vector art. Decrease graph line icon vectors Percent sign simple outline single line art illustration isolated design
Free with trial Discount percentage icon continuous outline drawing simple style finance vector art. Decrease graph line icon vectors Discount percentage icon continuous outline drawing simple style finance
Free with trial This image showcases a large collection of minimalist, line-style icons representing various charts and graphs. These icons depict data visualization elements commonly used in business, analytics, and reporting. high-quality professional. Decrease graph line icon vectors Collection of diverse line style charts and graphs icons displayed neatly. This image showcases a large collection of minimalist, line-style icons representing various charts and graphs. These icons depict data visualization elements commonly used in business, analytics, and reporting. high-quality professional
Free with trial A bold black line charts a significant downward trajectory, indicating a sharp decline, against a subtle grid. Decrease graph line icon illustrations A jagged downward trend line illustrates a sharp decline on a grid background. A bold black line charts a significant downward trajectory, indicating a sharp decline, against a subtle grid
Free with trial Simple outline illustration of percent sign continuous single line drawing white background. Decrease graph line icon vectors Simple outline illustration continuous single line drawing of percent sign. Simple outline illustration of percent sign continuous single line drawing white background
Free with trial Percentage symbol simple single line art drawing outline illustration minimal vector art. Decrease graph line icon vectors Percentage symbol simple single line art drawing outline illustration minimal
Free with trial A collection of five distinct black and white graphic representations of data. From left to right, the first is a line graph with dots, showing fluctuations. The second is a zig-zag line graph with dots and an upward arrow. The third is a series of ascending vertical bars. The fourth is a bar chart with a single dot above one of the bars. The fifth is a pie chart divided into four sections, with. Decrease graph line icon vectors Collection of black and white business and data charts and graphs statistics analytics. A collection of five distinct black and white graphic representations of data. From left to right, the first is a line graph with dots, showing fluctuations. The second is a zig-zag line graph with dots and an upward arrow. The third is a series of ascending vertical bars. The fourth is a bar chart with a single dot above one of the bars. The fifth is a pie chart divided into four sections, with
Free with trial Black glyph icon representing a broken downward arrow, symbolizing decline, financial crisis, market downturn, failure, or negative trends. Ideal for business presentations, economic reports, data visualization, infographics, and conceptual designs indicating loss, recession, or problems. Simple, clean graphic illustration on a white background. Generated by AI. Decrease graph line icon vectors Declining Trend Broken Downward Arrow Icon. Black glyph icon representing a broken downward arrow, symbolizing decline, financial crisis, market downturn, failure, or negative trends. Ideal for business presentations, economic reports, data visualization, infographics, and conceptual designs indicating loss, recession, or problems. Simple, clean graphic illustration on a white background. Generated by AI
Free with trial Up and down percentage icon set. Percentage growth and decline icons. Percent arrow up and down icon. Decrease graph line icon vectors Up and down percentage icon set. Percentage growth and decline icons. Percent arrow up and down icon
Free with trial Reduction chart icon Vector symbol or sign set collection in black and white outline. Decrease graph line icon vectors Reduction chart icon Symbol mark in filled style. Reduction chart icon Vector symbol or sign set collection in black and white outline
Free with trial A comprehensive vector icon set featuring essential symbols for business, finance, and data analysis. This collection includes various arrows for indicating growth and decline, wavy lines representing market trends, checkmarks for success or approval, X marks for errors or rejection, stopwatches for time management and efficiency, and stacks of coins with dollar signs for financial concepts. Ideal for presentations, infographics, web design, and reports to visually communicate progress, status, and economic indicators. Decrease graph line icon vectors Business, Finance, and Data Analytics Vector Icon Set. A comprehensive vector icon set featuring essential symbols for business, finance, and data analysis. This collection includes various arrows for indicating growth and decline, wavy lines representing market trends, checkmarks for success or approval, X marks for errors or rejection, stopwatches for time management and efficiency, and stacks of coins with dollar signs for financial concepts. Ideal for presentations, infographics, web design, and reports to visually communicate progress, status, and economic indicators.
Free with trial A clean line drawing showcases a magnifying glass focusing on a hand holding a declining bar graph with a downward. Decrease graph line icon illustrations Declining Market Analysis Magnifying Glass on Loss Trend. A clean line drawing showcases a magnifying glass focusing on a hand holding a declining bar graph with a downward.
Free with trial Conceptual image showing a magnifying glass focusing on a business presentation with a declining graph. Decrease graph line icon illustrations Decline Analysis Magnifying Glass on Business Loss Graph. Conceptual image showing a magnifying glass focusing on a business presentation with a declining graph.
Free with trial Conceptual line art depicting a decrease in gold prices. Decrease graph line icon illustrations Gold Price Drop Magnifying Glass Showing Decreasing Value. Conceptual line art depicting a decrease in gold prices.
Free with trial Conceptual icon depicting declining mental health or cognitive decline. Decrease graph line icon illustrations Declining Mental Health Brain, Chart, Magnifying Glass Icon. Conceptual icon depicting declining mental health or cognitive decline.
Free with trial Black and white graph with dollar signs and decreasing trend line on white background. Decrease graph line icon vectors Black map pin icon with white circle in center. Black and white graph with dollar signs and decreasing trend line on white background
Free with trial Conceptual line art depicting business analysis and market trends. Decrease graph line icon illustrations Business Analysis Magnifying Glass, Thumbs Up, Declining Graph. Conceptual line art depicting business analysis and market trends.
Free with trial A flat design vector illustration depicting a financial market data board or stock ticker. The black-bordered display features various stock symbols, numerical values like '$ ,80K', '$ ,22,50', and indicators of market performance. Prominently highlighted in red is the word 'LOSING', accompanied by a red downward arrow signifying a price drop, and a red downward triangle. Conversely, a green upward arrow indicates a price increase. This icon effectively visualizes concepts of financial loss, gain, market volatility, and investment trends, suitable for business, finance, and economic content. Decrease graph line icon illustrations Financial Market Data Board Icon with Loss and Gain Indicators. A flat design vector illustration depicting a financial market data board or stock ticker. The black-bordered display features various stock symbols, numerical values like '$ ,80K', '$ ,22,50', and indicators of market performance. Prominently highlighted in red is the word 'LOSING', accompanied by a red downward arrow signifying a price drop, and a red downward triangle. Conversely, a green upward arrow indicates a price increase. This icon effectively visualizes concepts of financial loss, gain, market volatility, and investment trends, suitable for business, finance, and economic content.
Free with trial Set line Mobile stock trading, Contract money and pen and Global economic crisis on seamless pattern. Vector. Decrease graph line icon illustrations Set line Mobile stock trading, Contract money and pen and Global economic crisis on seamless pattern. Vector.
Free with trial A 3D render illustrating a concept of financial decline and economic recession. The image features a red bar chart with progressively shorter bars, indicating a downward trend. A bold, red arrow follows this negative trajectory, pointing sharply downwards. Set against a clean, neutral gray background, this graphic powerfully symbolizes concepts like business failure, stock market crash, investment loss, sales decrease, and economic crisis. It's a perfect visual for presentations, reports, and articles discussing financial downturns, poor performance, and negative growth. Decrease graph line icon illustrations Financial Decline Graph with Red Arrow Down. A 3D render illustrating a concept of financial decline and economic recession. The image features a red bar chart with progressively shorter bars, indicating a downward trend. A bold, red arrow follows this negative trajectory, pointing sharply downwards. Set against a clean, neutral gray background, this graphic powerfully symbolizes concepts like business failure, stock market crash, investment loss, sales decrease, and economic crisis. It's a perfect visual for presentations, reports, and articles discussing financial downturns, poor performance, and negative growth.
Free with trial A conceptual vector illustration depicting a severe economic downturn. The image features a grey bar chart with progressively shorter bars, symbolizing declining profits or performance. A bold red arrow points sharply downwards, representing a crash or significant loss, alongside a blue line graph also showing a negative trend. This graphic is ideal for illustrating concepts such as financial crisis, recession, stock market crash, business failure, bankruptcy, and negative growth. Perfect for financial reports, business presentations, news articles, and economic analysis infographics. Decrease graph line icon illustrations Economic Downturn and Financial Crisis Graph. A conceptual vector illustration depicting a severe economic downturn. The image features a grey bar chart with progressively shorter bars, symbolizing declining profits or performance. A bold red arrow points sharply downwards, representing a crash or significant loss, alongside a blue line graph also showing a negative trend. This graphic is ideal for illustrating concepts such as financial crisis, recession, stock market crash, business failure, bankruptcy, and negative growth. Perfect for financial reports, business presentations, news articles, and economic analysis infographics.
Free with trial Percent Arrow Icons Set: Growth, Increase, Decrease Filled Up and Down Arrows. Decrease graph line icon vectors Percent Arrow Icons Set: Growth, Increase, Decrease Filled Up and Down Arrows
Free with trial Two sets of simple flat design charts showing bar graphs with line graphs and three-segment pie charts in red, green, and blue. Decrease graph line icon vectors Two bar charts with line graphs and two pie charts data visualization statistics. Two sets of simple flat design charts showing bar graphs with line graphs and three-segment pie charts in red, green, and blue
Free with trial Arrow Up Down Icon North South Upward Downward Pointer Scale Rise Fall Elevator Sign Symbol Growth Scroll Gesture Position Navigation Location Sign. Decrease graph line icon vectors Arrow Up Down Icon North South Upward Downward Pointer Scale Rise Fall Elevator Sign Symbol Growth Scroll Gesture
Free with trial A downward trend is shown on a graph. The graph is black and white. Decrease graph line icon illustrations A downward trend is shown on a graph
Free with trial A vibrant and modern illustration of a bar graph, featuring four bars of varying heights and colors: blue, green, orange, and red. The bars are positioned on a gray horizontal line, creating a sense of data comparison and visual hierarchy. This image is ideal for representing data, statistics, business reports, financial analysis, or any concept requiring visual data representation. The clean design and bright colors make it suitable for presentations, websites, and marketing materials. Decrease graph line icon illustrations Colorful Bar Graph Illustration. A vibrant and modern illustration of a bar graph, featuring four bars of varying heights and colors: blue, green, orange, and red. The bars are positioned on a gray horizontal line, creating a sense of data comparison and visual hierarchy. This image is ideal for representing data, statistics, business reports, financial analysis, or any concept requiring visual data representation. The clean design and bright colors make it suitable for presentations, websites, and marketing materials.
Free with trial Blue sad face next to a declining line graph in a calendar frame under a cloud. Ideal for business loss, economic crisis, emotional impact, failure, disappointment, analytics, trends. Simple flat. Decrease graph line icon vectors Sad face and declining data chart representing failure, downturn, or negative outcome concept. Blue sad face next to a declining line graph in a calendar frame under a cloud. Ideal for business loss, economic crisis, emotional impact, failure, disappointment, analytics, trends. Simple flat
Free with trial A black downward arrow with a percentage symbol and a jagged line inside it on a white background. Decrease graph line icon illustrations Black downward arrow with percentage sign and jagged line on white image photo. A black downward arrow with a percentage symbol and a jagged line inside it on a white background
Free with trial This vector illustration shows a set of black graph icons with rising and falling charts indicated by arrows showing trends in data with clear simple design and sharp edges calm. Generative AI. Decrease graph line icon vectors Black graph icons set rising and falling charts with arrows vector illustration simple design. This vector illustration shows a set of black graph icons with rising and falling charts indicated by arrows showing trends in data with clear simple design and sharp edges calm. Generative AI
Free with trial A black shopping basket icon displays various financial charts and graphs in blue and green, indicating business analytics. Decrease graph line icon illustrations Shopping basket icon with financial charts and graphs on white background cart retail. A black shopping basket icon displays various financial charts and graphs in blue and green, indicating business analytics
Free with trial Financial crisis concept. Decreasing graph with falling columns. Vector illustration showing recession, bankruptcy, and economic decline. Decrease graph line icon vectors Financial crisis concept. Decreasing graph with falling columns. Vector illustration showing recession, bankruptcy
Free with trial Line chart tracks data trends over time, with a downward arrow implying decline and a globe representing global impact. Ideal for analytics, performance, global strategy, tracking, economics, market. Decrease graph line icon illustrations Line Chart with Data Points, Downward Arrow, and Globe for Analysis and Global Trends. Line chart tracks data trends over time, with a downward arrow implying decline and a globe representing global impact. Ideal for analytics, performance, global strategy, tracking, economics, market
Free with trial A high-quality conceptual image featuring a row of smooth wooden cubes spelling the word "PESSIMISM" on a wooden surface. The arrangement includes a stacked block showing a sad face emoticon and a downward-sloping line graph, symbolizing financial loss, recession, negative market sentiment, and psychological discouragement in a professional or personal context. Decrease graph line icon illustrations Wooden Blocks Spelling Pessimism with Sad Face Icon and Downward Trend Graph. A high-quality conceptual image featuring a row of smooth wooden cubes spelling the word "PESSIMISM" on a wooden surface. The arrangement includes a stacked block showing a sad face emoticon and a downward-sloping line graph, symbolizing financial loss, recession, negative market sentiment, and psychological discouragement in a professional or personal context.
Free with trial Line graph with downward trend, sad face for dissatisfaction, alert bell for warning, and magnifier symbolizing evaluation. Ideal for data analysis, performance tracking, decline, warning, failure. Decrease graph line icon vectors Declining Graph with Sad Face, Alert Bell, and Magnifier Indicating Negative Trends. Line graph with downward trend, sad face for dissatisfaction, alert bell for warning, and magnifier symbolizing evaluation. Ideal for data analysis, performance tracking, decline, warning, failure
Free with trial A black curved shape descending towards a horizontal line on a white background, symbolizing decline. Decrease graph line icon illustrations Curved Black Shape Descending Towards a Horizontal Line on White Background Keywords: curve. A black curved shape descending towards a horizontal line on a white background, symbolizing decline
Free with trial Red sad face beside a line graph showing a downward trend and a bar graph. Ideal for business loss, economic decline, performance issues, challenges, setbacks, analytics, trends. Simple flat metaphor. Decrease graph line icon vectors Declining Chart with Sad Face and Bar Graph Representing Negative Trend and Challenges. Red sad face beside a line graph showing a downward trend and a bar graph. Ideal for business loss, economic decline, performance issues, challenges, setbacks, analytics, trends. Simple flat metaphor
Free with trial A graphic illustrating declining gas prices, featuring a fuel pump and a downward trending red line graph, isolated on a white background. Decrease graph line icon illustrations Falling gas prices graph with fuel pump isolated on white background. A graphic illustrating declining gas prices, featuring a fuel pump and a downward trending red line graph, isolated on a white background
Free with trial Downward line graph with sad face reflecting poor performance, folder with binary data, and cloud element. Ideal for finance, analytics, failure, statistics, digital storage, emotions simple flat. Decrease graph line icon illustrations Negative trend in data analysis with declining graph, sad face, and digital file management. Downward line graph with sad face reflecting poor performance, folder with binary data, and cloud element. Ideal for finance, analytics, failure, statistics, digital storage, emotions simple flat