Free with trial Economic downturn, financial instability, business crisis, consumer spending, recovery, growth. Drooping plant with dotted line, dollar sign and shopping basket illustration. Economic downturn. Decrease graph line icon vectors Economic Decline and Recovery Concept with Drooping Plant, Dollar Sign, and Shopping Basket. Economic downturn, financial instability, business crisis, consumer spending, recovery, growth. Drooping plant with dotted line, dollar sign and shopping basket illustration. Economic downturn
Free with trial A set of hand drawn black and white graphs and charts for business analysis. Decrease graph line icon illustrations A collection of six hand drawn graphs and charts in black and white .ai generate. a set of hand drawn black and white graphs and charts for business analysis.
Free with trial Abstract illustration showing a downward trend arrow, suitable for depicting loss, decline, or reduction. Decrease graph line icon vectors Downward Trend Arrow Illustration: Financial Loss, Market Decline, or Data Reduction. Abstract illustration showing a downward trend arrow, suitable for depicting loss, decline, or reduction.
Free with trial Set of sketched icons showing mutual fund nav increases and decreases with indian rupee signs on an alpha transparent base. Decrease graph line icon vectors Mutual fund nav trend sketch icons with rupee symbol alpha transparent. Set of sketched icons showing mutual fund nav increases and decreases with indian rupee signs on an alpha transparent base.
Free with trial Business finance and growth icons illustrating statistics charts trends progress and success. Decrease graph line icon vectors Finance and growth icons showing progress and business performance blue navy. Business finance and growth icons illustrating statistics charts trends progress and success
Free with trial A detailed black and white illustration of a knitting pattern stitch chart. This graphical guide features a grid with various symbols, icons, and abbreviations like 'k2tog' and 'ssk', representing different knitting stitches and techniques. The chart is organized by rows and columns, providing a visual map for creating intricate designs, particularly in lace knitting. This image is ideal for crafting websites, DIY tutorials, knitting books, hobby blogs, and instructional materials related to needlework, textiles, and handmade crafts. Decrease graph line icon illustrations Knitting Pattern Stitch Chart
Free with trial Vector illustration of a downward arrow symbolizing economic decline, recession, and financial downturn. Decrease graph line icon vectors Vector illustration of a downward arrow symbolizing economic decline, recession
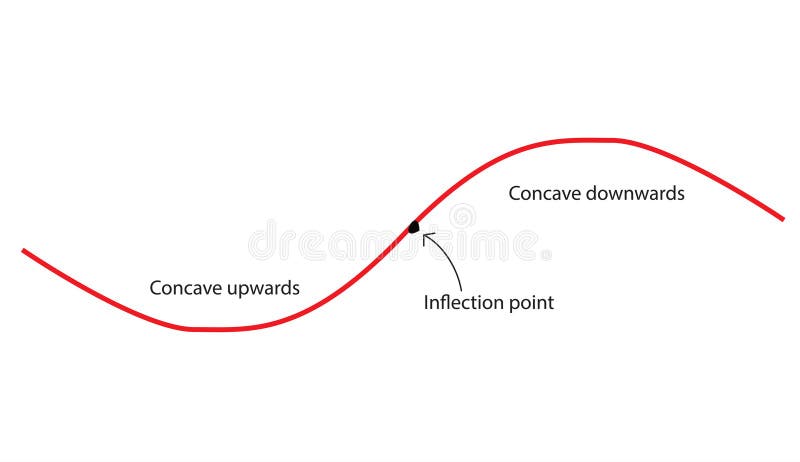
Free with trial Concavity of curve. Inflection point, concave down and concave up. Second derivative tangent lines of function. Decrease graph line icon vectors Concavity of curve
Free with trial Arrow Direction and Percentage Icons for Business Growth Concept. Decrease graph line icon illustrations Arrow Direction and Percentage Icons for Business Growth Concept
Free with trial Several dark, pointed arrow shapes are patterned diagonally across a light background. The arrows point downwards, suggesting a trend or direction. Decrease graph line icon illustrations Downward Trend Shown With Repeating Arrow Shapes on a Plain Background. Several dark, pointed arrow shapes are patterned diagonally across a light background. The arrows point downwards, suggesting a trend or direction.
Free with trial Abstract blue up and down arrow icons illustration set minimalist molecular grid design isolated on white background for technology business growth data analysis and finance ui ux. Decrease graph line icon vectors Abstract blue up and down arrow icons illustration set minimalist molecular grid design isolated on white background for. Technology business growth data. Abstract blue up and down arrow icons illustration set minimalist molecular grid design isolated on white background for technology business growth data analysis and finance ui ux
Free with trial Abstract illustration of business growth, featuring bar graphs and line graphs in shades of blue and grey. The image conveys concepts of data analysis, progress, and financial performance. Suitable for presentations, reports, and marketing materials related to business, finance, and technology. Decrease graph line icon illustrations Abstract Business Growth Chart. Abstract illustration of business growth, featuring bar graphs and line graphs in shades of blue and grey. The image conveys concepts of data analysis, progress, and financial performance. Suitable for presentations, reports, and marketing materials related to business, finance, and technology.
Free with trial Financial analysis scene showing colorful graphs and charts with a wooden block displaying a house icon and the year 2026, conveying real estate market growth and investment trends, ideal for finance and real estate marketing materials. Decrease graph line icon illustrations Financial Growth Charts with Wooden House Block and Year 2026. Financial analysis scene showing colorful graphs and charts with a wooden block displaying a house icon and the year 2026, conveying real estate market growth and investment trends, ideal for finance and real estate marketing materials
Free with trial Blue flat visualization showing bar chart and downward arrow over data grid with world map overlay. Analytics, finance, data analysis, digital, infographic, corporate, trend. Decrease graph line icon illustrations Blue flat visualization showing bar chart and downward arrow over data grid with world map overlay
Free with trial Money loan interest rate hand drawn doodle icons set collection in flat style. Payment benefit vector illustration on isolated background. Discount sign business concept. Decrease graph line icon vectors Money loan interest rate hand drawn doodle icons set collection in flat style. Payment benefit vector illustration on isolated
Free with trial Money loan interest rate hand drawn doodle icons set collection in flat style. Payment benefit vector illustration on isolated background. Discount sign business concept. Decrease graph line icon vectors Money loan interest rate hand drawn doodle icons set collection in flat style. Payment benefit vector illustration on isolated
Free with trial Black outline of descending bar chart with downward arrow, isolated on white background. concept of economic decline, data analysis, financial crisis, statistics. Decrease graph line icon vectors Black outline of descending bar chart with downward arrow, isolated on white background. concept of economic decline, data
Free with trial White isometric icons representing various financial concepts, including money, transactions, and data management, are depicted against a black background. These clean, modern icons are ideal for financial applications, websites, or presentations. Decrease graph line icon illustrations Isometric Finance Icons. White isometric icons representing various financial concepts, including money, transactions, and data management, are depicted against a black background. These clean, modern icons are ideal for financial applications, websites, or presentations.
Free with trial A conceptual vector illustration depicting business analysis and market research. A hand holds a magnifying glass, focusing on a colorful financial chart with bar and line graphs labeled 'Market Trends'. Surrounding icons represent key business metrics like growth, decline, market share, and innovation. This flat design graphic is ideal for presentations, reports, and web content related to data analytics, strategic planning, and financial performance evaluation, symbolizing the scrutiny of data to identify opportunities and understand market dynamics. Decrease graph line icon illustrations Business Analysis and Market Trends Concept with Magnifying Glass. A conceptual vector illustration depicting business analysis and market research. A hand holds a magnifying glass, focusing on a colorful financial chart with bar and line graphs labeled 'Market Trends'. Surrounding icons represent key business metrics like growth, decline, market share, and innovation. This flat design graphic is ideal for presentations, reports, and web content related to data analytics, strategic planning, and financial performance evaluation, symbolizing the scrutiny of data to identify opportunities and understand market dynamics.
Free with trial Business data is visually represented in black and white through various charts and graphs illustrating growth analysis and strategic planning for financial reporting showing a clear picture of market. Decrease graph line icon vectors Black and white business data visualization with charts and graphs showing growth and analysis for financial reporting and. Business data is visually represented in black and white through various charts and graphs illustrating growth analysis and strategic planning for financial reporting showing a clear picture of market
Free with trial Illustration of economic growth is depicted by a green staircase ascending toward light, symbolizing progress and increased prosperity. Decrease graph line icon vectors Illustration of economic growth is depicted by a green staircase ascending toward light
Free with trial Flat design business icons depict various charts, percentage signs, targets, hierarchical diagrams, and coin stacks representing financial growth and data analysis in monochrome. Generative AI. Decrease graph line icon vectors Black and white flat design business icons including charts percentage target and money stacks illustrating financial growth and. Flat design business icons depict various charts, percentage signs, targets, hierarchical diagrams, and coin stacks representing financial growth and data analysis in monochrome. Generative AI
Free with trial A sharp red arrow with a jagged line points downwards, indicating a decline or loss, isolated on a white background. Decrease graph line icon illustrations Red downward trend arrow isolated on white background. A sharp red arrow with a jagged line points downwards, indicating a decline or loss, isolated on a white background
Free with trial A clean, minimalist vector illustration of a bar chart featuring three distinct columns. The columns are colored in vibrant orange, teal, and yellow, representing different data points or categories. The chart is set against a white background with a dark blue axis line, making it ideal for presentations, reports, and infographics focused on data visualization, business growth, or financial analysis. Decrease graph line icon vectors Simple Bar Chart with Three Columns. A clean, minimalist vector illustration of a bar chart featuring three distinct columns. The columns are colored in vibrant orange, teal, and yellow, representing different data points or categories. The chart is set against a white background with a dark blue axis line, making it ideal for presentations, reports, and infographics focused on data visualization, business growth, or financial analysis.
Free with trial A comprehensive set of minimalist linear icons depicting financial analytics and business trends, featuring stacks of coins and both upward and downward trending bar charts. Decrease graph line icon vectors Linear Business and Financial Growth Icon Set for Analytics, Investment, and Economic Trend Visualization. A comprehensive set of minimalist linear icons depicting financial analytics and business trends, featuring stacks of coins and both upward and downward trending bar charts.
Free with trial Three coin stacks with dollar signs, showing growth, and a downward arrow indicating potential decline. Decrease graph line icon vectors A line drawing depicting three stacks of coins with dollar signs on top, showing financial growth. three coin stacks with dollar signs, showing growth, and a downward arrow indicating potential decline
Free with trial Real-Time Market Data Analysis with Candlestick Chart vector concept seamless pattern. Decrease graph line icon vectors Real-Time Market Data Analysis with Candlestick Chart vector seamless pattern
Free with trial A vibrant 3D bar chart, featuring glossy blue and orange rectangular segments, illustrates data progression or comparison. The varying bar heights convey growth or statistical analysis. This modern graphic is ideal for business, finance, and analytical concepts, presented cleanly isolated on a transparent background. Decrease graph line icon vectors Glossy 3D bar chart showing data growth and statistics with blue and orange segments, perfect for business and finance presentatio. A vibrant 3D bar chart, featuring glossy blue and orange rectangular segments, illustrates data progression or comparison. The varying bar heights convey growth or statistical analysis. This modern graphic is ideal for business, finance, and analytical concepts, presented cleanly isolated on a transparent background.
Free with trial Colorful Charts and Graphs Data Visualization Infographic. Decrease graph line icon illustrations Colorful Charts and Graphs Data Visualization Infographic
Free with trial A bar chart shows a decline, coupled with a sad face, conveying negative trends in a flat design style. Decrease graph line icon vectors Declining bar chart with a sad face symbolizing loss, downturn, or negative trends. A bar chart shows a decline, coupled with a sad face, conveying negative trends in a flat design style.
Free with trial A modern, hand-drawn illustration symbolizing a bear market. This creative doodle features a stylized purple bear, the financial metaphor for a declining market, surrounded by downward arrows, volatile stock chart lines, and a warning sign. The abstract, pastel-colored design effectively visualizes concepts of economic downturn, recession, financial crisis, and investment risk. This vector graphic is perfect for articles, blogs, presentations, and infographics related to finance, trading, economics, and stock market analysis. Isolated on a white background for versatile use. Decrease graph line icon vectors Bear Market Financial Concept Illustration. A modern, hand-drawn illustration symbolizing a bear market. This creative doodle features a stylized purple bear, the financial metaphor for a declining market, surrounded by downward arrows, volatile stock chart lines, and a warning sign. The abstract, pastel-colored design effectively visualizes concepts of economic downturn, recession, financial crisis, and investment risk. This vector graphic is perfect for articles, blogs, presentations, and infographics related to finance, trading, economics, and stock market analysis. Isolated on a white background for versatile use.
Free with trial A hand-drawn illustration featuring a large percentage symbol at the center, surrounded by various financial and business-related doodles. Icons include bar charts, pie charts, stacks of coins, a calculator, dollar signs, and numerous arrows indicating direction, flow, or change. The style is simple, black and white line art, suitable for representing concepts like finance, economics, growth, discounts, and business analysis. Decrease graph line icon illustrations Doodle Financial Icons and Percentage Symbol. A hand-drawn illustration featuring a large percentage symbol at the center, surrounded by various financial and business-related doodles. Icons include bar charts, pie charts, stacks of coins, a calculator, dollar signs, and numerous arrows indicating direction, flow, or change. The style is simple, black and white line art, suitable for representing concepts like finance, economics, growth, discounts, and business analysis.
Free with trial A simple flat icon vector illustration of two hands adjusting a simple chart with a downturn arrow, symbolizing risk mitigation in a business setting. The simple chart with a downturn arrow is orange with dark gray elements, indicating loss control. White background. Minimalist style with sharp edges and no shadows. Orange and Gray color palette. Vector graphics with rounded corners. High. Decrease graph line icon illustrations Hands Protect Financial Growth Chart Decline, Business Crisis Management. A simple flat icon vector illustration of two hands adjusting a simple chart with a downturn arrow, symbolizing risk mitigation in a business setting. The simple chart with a downturn arrow is orange with dark gray elements, indicating loss control. White background. Minimalist style with sharp edges and no shadows. Orange and Gray color palette. Vector graphics with rounded corners. High
Free with trial Illustration of a growing budget efficiency with a simple money bag closing tightly, a stylized downward-pointing cost arrow, and a stream of saved coins. Vector flat icon design on a white background for a cost control illustration --chaos 30 --ar 16:9 --v 7 Job ID: 35adf769-e45b-43cf-a8e7-0b2af69479b3. Decrease graph line icon illustrations Money Bag Downward Arrow, Financial Crisis, Economic Downturn, Falling Value. Illustration of a growing budget efficiency with a simple money bag closing tightly, a stylized downward-pointing cost arrow, and a stream of saved coins. Vector flat icon design on a white background for a cost control illustration --chaos 30 --ar 16:9 --v 7 Job ID: 35adf769-e45b-43cf-a8e7-0b2af69479b3
Free with trial Four brown arrows with percentage signs on a white background. The arrows are pointing up, down, and two variations of down with a broken line. The image appears to be a graphic design element, possibly used to represent changes in percentage or rates. The simple and clean design makes it versatile for various applications, such as infographics, presentations, or websites. Decrease graph line icon illustrations Four brown percentage arrows on white background. Four brown arrows with percentage signs on a white background. The arrows are pointing up, down, and two variations of down with a broken line. The image appears to be a graphic design element, possibly used to represent changes in percentage or rates. The simple and clean design makes it versatile for various applications, such as infographics, presentations, or websites.
Free with trial A grid of various icons related to business technology and data analysis. Generative AI. Decrease graph line icon illustrations Collection of Business and Technology Icons Set. A grid of various icons related to business technology and data analysis. Generative AI
Free with trial A colorful, hand-drawn illustration depicting a large percentage symbol surrounded by various financial and statistical icons. This doodle-style artwork includes bar graphs, pie charts, stacks of coins, dollar signs, and arrows indicating growth and decline. The sketch effectively visualizes concepts like interest rates, economic trends, business analytics, investment returns, and market data. Isolated on a white background, this versatile image is perfect for presentations, infographics, financial reports, and educational materials related to business, finance, and statistics. Decrease graph line icon illustrations Hand Drawn Finance and Percentage Concept Illustration. A colorful, hand-drawn illustration depicting a large percentage symbol surrounded by various financial and statistical icons. This doodle-style artwork includes bar graphs, pie charts, stacks of coins, dollar signs, and arrows indicating growth and decline. The sketch effectively visualizes concepts like interest rates, economic trends, business analytics, investment returns, and market data. Isolated on a white background, this versatile image is perfect for presentations, infographics, financial reports, and educational materials related to business, finance, and statistics.
Free with trial A dynamic black and white background pattern featuring a collection of hand-drawn financial and economic elements. The design includes various currency symbols like the Dollar, Euro, and Yen, alongside upward and downward arrows, zig-zag lines representing market volatility, and simple bar charts indicating growth or decline. Scattered ink splatters add a grunge, artistic touch to the overall composition. This versatile illustration is ideal for conveying concepts related to global finance, business trends, investment, stock market fluctuations, economic data, and wealth management in a creative and engaging way. Decrease graph line icon vectors Hand Drawn Financial Market Elements Background Pattern. A dynamic black and white background pattern featuring a collection of hand-drawn financial and economic elements. The design includes various currency symbols like the Dollar, Euro, and Yen, alongside upward and downward arrows, zig-zag lines representing market volatility, and simple bar charts indicating growth or decline. Scattered ink splatters add a grunge, artistic touch to the overall composition. This versatile illustration is ideal for conveying concepts related to global finance, business trends, investment, stock market fluctuations, economic data, and wealth management in a creative and engaging way.
Free with trial A diverse set of icons representing financial growth, market trends, and business analytics, including line graphs, bar charts, pie charts, and currency symbols. Decrease graph line icon vectors Collection of Financial and Business Growth Icons and Charts. A diverse set of icons representing financial growth, market trends, and business analytics, including line graphs, bar charts, pie charts, and currency symbols
Free with trial A comprehensive set of financial and data visualization icons, perfect for illustrating business and economic concepts. This collection includes a growing bar chart with an upward trend, a declining bar chart with a downward trend, and a mixed bar chart. Also featured are stacks of global currencies (USD, Euro, INR), a segmented pie chart, and a world map colored green and red to signify global market conditions or data distribution. Ideal for presentations, reports, websites, and educational materials related to economics, finance, and market analysis. Decrease graph line icon vectors Global Financial and Business Data Visualization Icons Set. A comprehensive set of financial and data visualization icons, perfect for illustrating business and economic concepts. This collection includes a growing bar chart with an upward trend, a declining bar chart with a downward trend, and a mixed bar chart. Also featured are stacks of global currencies (USD, Euro, INR), a segmented pie chart, and a world map colored green and red to signify global market conditions or data distribution. Ideal for presentations, reports, websites, and educational materials related to economics, finance, and market analysis.
Free with trial Conceptual image depicting job loss and economic downturn. Decrease graph line icon illustrations Job Loss Analysis Magnifying Glass on Downward Trend, Layoffs. Conceptual image depicting job loss and economic downturn.
Free with trial Minimalist black and white illustration depicting financial decline and risk assessment, ideal for business reports, health safety awareness, and market analysis presentations. Decrease graph line icon vectors Downward trend analysis with biohazard and magnifying glass icons. Minimalist black and white illustration depicting financial decline and risk assessment, ideal for business reports, health safety awareness, and market analysis presentations
Free with trial Business finance icons set vector scalable eps collection for stock vector, the image is generated using AI. Decrease graph line icon vectors Business finance icons set vector scalable eps collection for stock vector
Free with trial The image showcases a large, three-dimensional yellow percentage sign against a plain background. The sign is composed of two circles connected by a horizontal line, creating a bold and eye-catching symbol. Decrease graph line icon illustrations A close-up view of a large, three-dimensional yellow percentage sign. The image showcases a large, three-dimensional yellow percentage sign against a plain background. The sign is composed of two circles connected by a horizontal line, creating a bold and eye-catching symbol
Free with trial A vibrant infographic illustrating business growth, financial analysis, and data visualization with charts, graphs, and icons. Decrease graph line icon vectors Infographic of Business Growth and Financial Analysis with Charts and Icons. A vibrant infographic illustrating business growth, financial analysis, and data visualization with charts, graphs, and icons
Free with trial A set of six black outline icons depicting magnifying glasses, graphs, a computer monitor displaying a waveform, and network connections. Decrease graph line icon vectors Magnifying glass and data analysis icons with graphs and monitor search. A set of six black outline icons depicting magnifying glasses, graphs, a computer monitor displaying a waveform, and network connections
Free with trial Silhouettes depict male figures interacting with downward-pointing arrows, symbolizing business loss or decline. One figure gestures towards a large arrow, another walks alongside it. The minimalist design uses solid black on a white background, emphasizing the concept of financial reduction or setbacks. Arrow sizes vary, enhancing the visual representation of movement or direction. Decrease graph line icon vectors A set of Business Loss Concept with Male Figure. Silhouettes depict male figures interacting with downward-pointing arrows, symbolizing business loss or decline. One figure gestures towards a large arrow, another walks alongside it. The minimalist design uses solid black on a white background, emphasizing the concept of financial reduction or setbacks. Arrow sizes vary, enhancing the visual representation of movement or direction.
Free with trial Silhouettes depict male figures interacting with downward-pointing arrows, symbolizing business loss or decline. One figure gestures towards a large arrow, another walks alongside it. The minimalist design uses solid black on a white background, emphasizing the concept of financial reduction or setbacks. Arrow sizes vary, enhancing the visual representation of movement or direction. Decrease graph line icon vectors A set of Business Loss Concept with Male Figure. Silhouettes depict male figures interacting with downward-pointing arrows, symbolizing business loss or decline. One figure gestures towards a large arrow, another walks alongside it. The minimalist design uses solid black on a white background, emphasizing the concept of financial reduction or setbacks. Arrow sizes vary, enhancing the visual representation of movement or direction.
Free with trial Silhouettes depict male figures interacting with downward-pointing arrows, symbolizing business loss or decline. One figure gestures towards a large arrow, another walks alongside it. The minimalist design uses solid black on a white background, emphasizing the concept of financial reduction or setbacks. Arrow sizes vary, enhancing the visual representation of movement or direction. Decrease graph line icon vectors A set of Business Loss Concept with Male Figure. Silhouettes depict male figures interacting with downward-pointing arrows, symbolizing business loss or decline. One figure gestures towards a large arrow, another walks alongside it. The minimalist design uses solid black on a white background, emphasizing the concept of financial reduction or setbacks. Arrow sizes vary, enhancing the visual representation of movement or direction.
Free with trial Silhouettes depict male figures interacting with downward-pointing arrows, symbolizing business loss or decline. One figure gestures towards a large arrow, another walks alongside it. The minimalist design uses solid black on a white background, emphasizing the concept of financial reduction or setbacks. Arrow sizes vary, enhancing the visual representation of movement or direction. Decrease graph line icon vectors A set of Business Loss Concept with Male Figure. Silhouettes depict male figures interacting with downward-pointing arrows, symbolizing business loss or decline. One figure gestures towards a large arrow, another walks alongside it. The minimalist design uses solid black on a white background, emphasizing the concept of financial reduction or setbacks. Arrow sizes vary, enhancing the visual representation of movement or direction.
Free with trial Silhouettes depict male figures interacting with downward-pointing arrows, symbolizing business loss or decline. One figure gestures towards a large arrow, another walks alongside it. The minimalist design uses solid black on a white background, emphasizing the concept of financial reduction or setbacks. Arrow sizes vary, enhancing the visual representation of movement or direction. Decrease graph line icon vectors A set of Business Loss Concept with Male Figure. Silhouettes depict male figures interacting with downward-pointing arrows, symbolizing business loss or decline. One figure gestures towards a large arrow, another walks alongside it. The minimalist design uses solid black on a white background, emphasizing the concept of financial reduction or setbacks. Arrow sizes vary, enhancing the visual representation of movement or direction.
Free with trial Nine flat design icons depict various data charts and graphs in muted blue and teal tones. Decrease graph line icon vectors Collection of nine flat design data charts and graphs analysis statistics. Nine flat design icons depict various data charts and graphs in muted blue and teal tones.
Free with trial Cost reduction level design vector illustration. Decrease graph line icon vectors Cost reduction level concept vector illustration. Cost reduction level design vector illustration
Free with trial This vector illustration shows a financial chart with green bar graphs, arrows indicating downfalls, a dollar coin and money bag. It conveys a financial concept. Decrease graph line icon vectors Financial Chart Showing Market Trends with Dollar Signs and Green Arrows. This vector illustration shows a financial chart with green bar graphs, arrows indicating downfalls, a dollar coin and money bag. It conveys a financial concept.
Free with trial Online Crypto Trading vector Candlestick Chart concept outline seamless pattern. Decrease graph line icon illustrations Online Crypto Trading vector Candlestick Chart outline seamless pattern
Free with trial A 3D png of a red jagged arrow pointing downwards. This graphic represents a decline in stock markets, financial loss, economic recession, or a negative business trend, isolated on a white background. Decrease graph line icon vectors Red downward trend arrow financial crisis concept isolated on transparent background. A 3D png of a red jagged arrow pointing downwards. This graphic represents a decline in stock markets, financial loss, economic recession, or a negative business trend, isolated on a white background.
Free with trial Business Strategy and Analysis: Lightbulb, Magnifying Glass, Briefcases, and Data Illustration. Decrease graph line icon vectors Business Strategy and Analysis Lightbulb Magnifying Glass Briefcases and Data Illustration.
Free with trial Minimalist black and white circular sign featuring a bold downward arrow, ideal for financial reports, market trends, business decline, or reduction concepts in presentations and infographics. Decrease graph line icon vectors Bold downward arrow in black and white circular sign for business decline or reduction. Minimalist black and white circular sign featuring a bold downward arrow, ideal for financial reports, market trends, business decline, or reduction concepts in presentations and infographics
Free with trial This is an detailed assembly of essential outline icons for business strategy, data visualization, and planning. Decrease graph line icon vectors Essential business strategy and data visualization tools in professional outline style. This is an detailed assembly of essential outline icons for business strategy, data visualization, and planning
Free with trial A grid of thin line icons illustrating business growth and financial concepts, featuring charts, graphs, money symbols, and people. Decrease graph line icon illustrations Business Growth and Financial Analytics Icon Collection with Charts and Money Keywords: business, growth, finance, analytics. A grid of thin line icons illustrating business growth and financial concepts, featuring charts, graphs, money symbols, and people
Free with trial Concept of volatile market with one stack of coins growing and another one decreasing. Decrease graph line icon illustrations Money stack growing while one is decreasing showing market volatility. Concept of volatile market with one stack of coins growing and another one decreasing
Free with trial Arrow 3d vector illustration. Web design elements, pointer or cursor sign, increase of decrease financial sign. Up and down forward arrow, motion and navigation symbol. Decrease graph line icon vectors Arrow navigation pointer, forward upward. Arrow 3d vector illustration. Web design elements, pointer or cursor sign, increase of decrease financial sign. Up and down forward arrow, motion and navigation symbol
Free with trial Cryptocurrency Day Trading vector Candlestick Chart Patterns concept outline seamless pattern. Decrease graph line icon illustrations Cryptocurrency Day Trading vector Candlestick Chart Patterns outline seamless pattern
Free with trial Abstract vector showing price decreasing and investment increasing, using blue lines and pink accents. Simple composition, balanced for illustrative purposes. Decrease graph line icon vectors Abstract visual illustrating price reduction, investment, and financial dynamics on a black background. Abstract vector showing price decreasing and investment increasing, using blue lines and pink accents. Simple composition, balanced for illustrative purposes.
Free with trial Black and white line icons depicting currency devaluation, falling stocks, and market data analysis. Decrease graph line icon vectors Financial downturn and market analysis icons. Black and white line icons depicting currency devaluation, falling stocks, and market data analysis
Free with trial Currency exchange rate is fluctuating showing dollar gaining value while euro is decreasing. Decrease graph line icon vectors Dollar growing while euro is decreasing showing currency exchange rate. Currency exchange rate is fluctuating showing dollar gaining value while euro is decreasing
Free with trial Laptop displaying a declining chart with an error sign, symbolizing business failure. Decrease graph line icon vectors Laptop showing declining chart with error sign, business failure concept. Laptop displaying a declining chart with an error sign, symbolizing business failure
Free with trial Trend and Candlestick Chart vector Crypto Investment concept seamless pattern. Decrease graph line icon vectors Trend and Candlestick Chart vector Crypto Investment seamless pattern
Free with trial A graphic illustration featuring two distinct charts on a white background. The upper chart displays three descending lines in black, red, and green, each ending with a downward-pointing arrow. Below this, a bar chart shows three black bars of increasing height, with arrows pointing upwards from the tallest bars. A stylized black graphic element resembling diverging paths or a funnel is positioned. Decrease graph line icon vectors Downward and upward trending graphs with arrows chart. A graphic illustration featuring two distinct charts on a white background. The upper chart displays three descending lines in black, red, and green, each ending with a downward-pointing arrow. Below this, a bar chart shows three black bars of increasing height, with arrows pointing upwards from the tallest bars. A stylized black graphic element resembling diverging paths or a funnel is positioned
Free with trial Up vs down balance on economic scale. Balance on scale. Business Concept. Vector stock illustration. Decrease graph line icon vectors Up vs down balance on economic scale
Free with trial Candlestick Chart on PC Screen vector Crypto Investment concept colored seamless pattern. Decrease graph line icon vectors Candlestick Chart on PC Screen vector Crypto Investment colored seamless pattern
Free with trial Candlestick Chart vector Professional Financial Trading concept seamless pattern. Decrease graph line icon vectors Candlestick Chart vector Professional Financial Trading seamless pattern
Free with trial This image presents a set of four icons depicting different types of bar charts with upward and downward trends. These icons are commonly used to visually represent growth, decline, progress, and regression in various contexts, such as business, finance, and data analysis. Decrease graph line icon vectors Collection of Growth and Decline Chart Icons. This image presents a set of four icons depicting different types of bar charts with upward and downward trends. These icons are commonly used to visually represent growth, decline, progress, and regression in various contexts, such as business, finance, and data analysis.
Free with trial A red arrow is showing the trend of the market to a downtrend. Background for the economy and data analysis. Decrease graph line icon vectors Red Downtrend Arrow Object Abstract Background. A red arrow is showing the trend of the market to a downtrend. Background for the economy and data analysis.
Free with trial Online Candlestick Chart vector Professional Financial Trading concept colored seamless pattern. Decrease graph line icon vectors Online Candlestick Chart vector Professional Financial Trading colored seamless pattern
Free with trial A red down arrow on a transparent white background. Decrease graph line icon vectors A red down arrow on a transparent white background
Free with trial Simple up and down arrow on black circle. Upward and downward sign symbol vector. Decrease graph line icon vectors Simple up and down arrow on black circle. Upward and downward sign symbol
Free with trial Hand raising a sign that says Rightward Direction drawn using engraving technique. Decrease graph line icon vectors Hand raising a sign that says Rightward Direction COLORED. Hand raising a sign that says Rightward Direction drawn using engraving technique
Free with trial Data analytics icons set in duotone outline stroke design for web. Pack pictograms of search, mining, filter, pie chart, presentation, mind map, database, discover, flow, other. Vector illustration. Decrease graph line icon illustrations Data analytics icons set in duotone outline stroke design for web. Pack pictograms of search, mining, filter, pie chart