Free with trial Set line Graph chart diagram Many ways directional arrow Mountains with flag Arrow Digital speed meter Pie infographic Old hourglass sand and Pyramid infographics icon. Vector. Decrease graph line icon vectors Set line Graph, chart, diagram, Many ways directional arrow, Mountains with flag, Arrow, Digital speed meter, Pie. Set line Graph chart diagram Many ways directional arrow Mountains with flag Arrow Digital speed meter Pie infographic Old hourglass sand and Pyramid infographics icon. Vector.
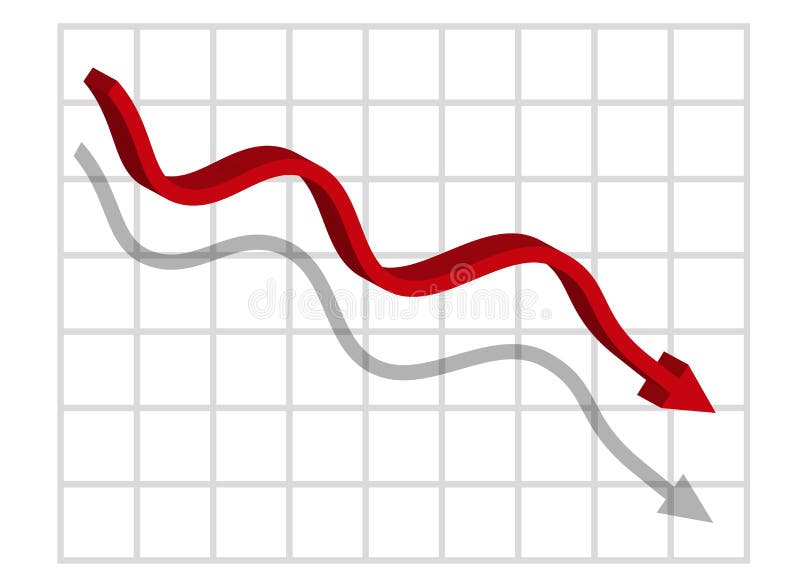
Free with trial Diagram with recession and bankruptcy progress. Graph with decrease report. Business and finance vector illustration. Decrease graph line icon vectors Diagram with recession and bankruptcy progress. Graph with decrease report. Business and finance vector
Free with trial Graph with decrease report. Diagram with recession and bankruptcy progress. Business and finance vector illustration. Decrease graph line icon vectors Graph with decrease report. Diagram with recession and bankruptcy progress. Business and finance vector
Free with trial Set line Wrench and gear Graph chart diagram Dollar symbol Arrow Mountains with flag Many ways directional arrow Financial growth decrease and Delivery tracking icon. Vector. Decrease graph line icon vectors Set line Wrench and gear, Graph, chart, diagram, Dollar symbol, Arrow, Mountains with flag, Many ways directional arrow. Set line Wrench and gear Graph chart diagram Dollar symbol Arrow Mountains with flag Many ways directional arrow Financial growth decrease and Delivery tracking icon. Vector.
Free with trial Set line Flag Target Graph chart diagram Light bulb Arrow Mountains with flag Pie infographic and Dollar symbol icon. Vector. Decrease graph line icon vectors Set line Flag, Target, Graph, chart, diagram, Light bulb, Arrow, Mountains with flag, Pie infographic and Dollar symbol. Set line Flag Target Graph chart diagram Light bulb Arrow Mountains with flag Pie infographic and Dollar symbol icon. Vector.
Free with trial Set line Clock Layers Delivery tracking Many ways directional arrow Infographic element Graph chart diagram Light bulb and Arrow icon. Vector. Decrease graph line icon vectors Set line Clock, Layers, Delivery tracking, Many ways directional arrow, Infographic element, Graph, chart, diagram. Set line Clock Layers Delivery tracking Many ways directional arrow Infographic element Graph chart diagram Light bulb and Arrow icon. Vector.
Free with trial Set line Pie chart infographic Many ways directional arrow Financial growth decrease Mountains with flag Arrow and Old hourglass sand icon. Vector. Decrease graph line icon vectors Set line Pie chart infographic, Many ways directional arrow, Financial growth decrease, Mountains with flag, Arrow, and. Set line Pie chart infographic Many ways directional arrow Financial growth decrease Mountains with flag Arrow and Old hourglass sand icon. Vector.
Free with trial Set line Old hourglass with sand Light bulb Layers Financial growth Graph chart diagram Dollar symbol Mountains flag and Arrow icon. Vector. Decrease graph line icon vectors Set line Old hourglass with sand, Light bulb, Layers, Financial growth, Graph, chart, diagram, Dollar symbol, Mountains. Set line Old hourglass with sand Light bulb Layers Financial growth Graph chart diagram Dollar symbol Mountains flag and Arrow icon. Vector.
Free with trial Set line Flag Graph chart diagram Delivery tracking Pyramid infographics Financial growth Project team base and decrease icon. Vector. Decrease graph line icon vectors Set line Flag, Graph, chart, diagram, Delivery tracking, Pyramid infographics, Financial growth, Project team base and. Set line Flag Graph chart diagram Delivery tracking Pyramid infographics Financial growth Project team base and decrease icon. Vector.
Free with trial Set line Target Financial growth decrease Arrow Unknown search Many ways directional arrow and Pie chart infographic icon. Vector. Decrease graph line icon vectors Set line Target, Financial growth decrease, Arrow, Unknown search, Many ways directional arrow, and Pie chart. Set line Target Financial growth decrease Arrow Unknown search Many ways directional arrow and Pie chart infographic icon. Vector.
Free with trial Set line Target Financial growth decrease Arrow Unknown search Many ways directional arrow and Pie chart infographic icon. Vector. Decrease graph line icon illustrations Set line Target, Financial growth decrease, Arrow, Unknown search, Many ways directional arrow, and Pie chart. Set line Target Financial growth decrease Arrow Unknown search Many ways directional arrow and Pie chart infographic icon. Vector.
Free with trial Set line Dollar symbol Shopping bag with Sale Delivery tracking Graph chart diagram Old hourglass sand Financial growth decrease Flag and Arrow icon. Vector. Decrease graph line icon illustrations Set line Dollar symbol, Shopping bag with Sale, Delivery tracking, Graph, chart, diagram, Old hourglass sand, Financial. Set line Dollar symbol Shopping bag with Sale Delivery tracking Graph chart diagram Old hourglass sand Financial growth decrease Flag and Arrow icon. Vector.
Free with trial Set line Hierarchy organogram chart Financial growth decrease Pie infographic Flag Arrow and Many ways directional arrow icon. Vector. Decrease graph line icon vectors Set line Hierarchy organogram chart, Financial growth decrease, Pie infographic, Flag, Arrow and Many ways directional. Set line Hierarchy organogram chart Financial growth decrease Pie infographic Flag Arrow and Many ways directional arrow icon. Vector.
Free with trial Set line Layers Old hourglass with sand Financial growth decrease Pie chart infographic Flag Target and Wrench gear icon. Vector. Decrease graph line icon vectors Set line Layers, Old hourglass with sand, Financial growth decrease, Pie chart infographic, Flag, Target and Wrench gear
Free with trial Low rate profit cost icon. Reduction cost decrease percent profit down sign. Decrease graph line icon vectors Low rate profit cost icon. Reduction cost decrease percent profit down sign
Free with trial GDP decrease fall, red arrow and percent icon. Vector GDP, investment profit loss arrow down symbol. Decrease graph line icon vectors GDP decrease fall, red arrow percent icon. Vector GDP, investment profit loss arrow down symbol
Free with trial Cost reduction icon price lower arrow. Vector low cost money crisis line icon. Decrease graph line icon vectors Cost reduction icon price lower arrow. Vector low cost money crisis line icon
Free with trial Graph with decrease report. Diagram with recession and bankruptcy progress. Business and finance vector illustration. Decrease graph line icon vectors Graph with decrease report. Diagram with recession and bankruptcy progress. Business and finance vector
Free with trial Investment line icon set. Quick approval, bank loan, percentage, trader, investor, exchange, newspaper, bond vector illustrations. Simple outline signs for financial activities. Editable Stroke. Decrease graph line icon illustrations Investment line icon set. Quick approval, bank loan, percentage, trader, investor, exchange, newspaper, bond vector
Free with trial Investment line icon set. Quick approval, bank loan, percentage, trader, investor, exchange, newspaper, bond vector illustrations. Simple outline signs for financial activities. Editable Stroke. Decrease graph line icon vectors Investment line icon set. Quick approval, bank loan, percentage, trader, investor, exchange, newspaper, bond vector
Free with trial Investment line icon set. Quick approval, bank loan, percentage, trader, investor, exchange, newspaper, bond vector illustrations. Simple outline signs for financial activities. Editable Stroke. Decrease graph line icon vectors Investment line icon set. Quick approval, bank loan, percentage, trader, investor, exchange, newspaper, bond vector
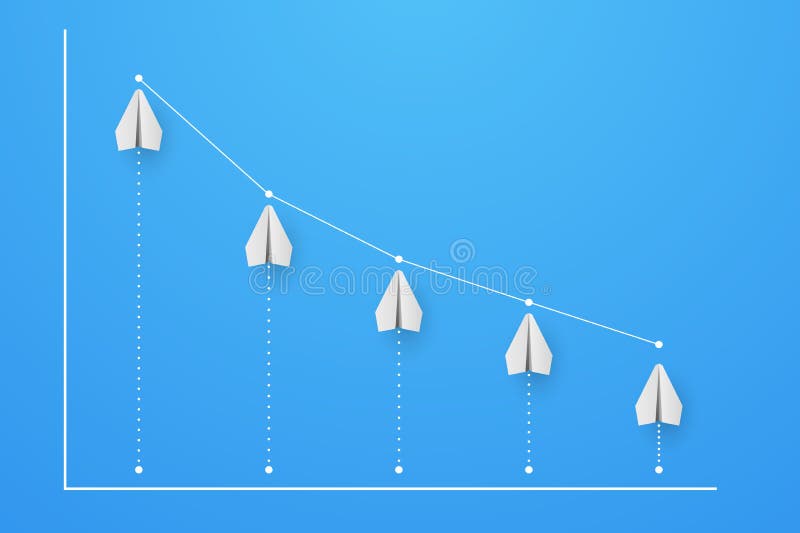
Free with trial Graph and diagram from planes with decrease. Finance and business concept. Vector Illustration. Decrease graph line icon vectors Graph and diagram from planes with decrease. Finance and business concept. Vector
Free with trial Graph with decrease report. Diagram with recession and bankruptcy progress. Business and finance vector illustration. Decrease graph line icon vectors Graph with decrease report. Diagram with recession and bankruptcy progress. Business and finance vector
Free with trial Graph and diagram from planes with decrease. Finance and business concept. Vector Illustration. Decrease graph line icon vectors Graph and diagram from planes with decrease. Finance and business concept
Free with trial Editable as a line illustration of a negative or downward going bar graph with a stick figure person standing on the infographic preventing the chart from going down with a rope as a small business owner in crisis. Decrease graph line icon illustrations Editable line illustration of a negative downward bar graph. Editable as a line illustration of a negative or downward going bar graph with a stick figure person standing on the infographic preventing the chart from going down with a rope as a small business owner in crisis
Free with trial Chart line icons set. Graph, finance report, income growth, economy statistic, gantt diagram, infographic, mind map, data visualization vector illustration. Outline sign of analytics. Editable Stroke. Decrease graph line icon vectors Chart line icons set. Graph, finance report, income growth, economy statistic, gantt diagram, infographic, mind map
Free with trial Cost reduction icon price lower arrow. Vector low cost money crisis line icon. Decrease graph line icon vectors Cost reduction icon price lower arrow. Vector low cost money crisis line icon
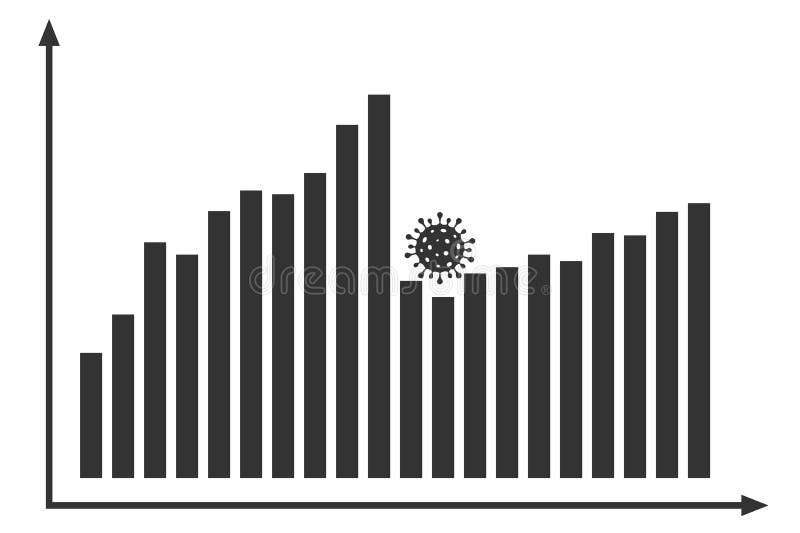
Free with trial Graph with covid decrease report. Diagram with coronavirus recession and bankruptcy progress. Vector illustration. Decrease graph line icon vectors Graph with covid decrease report. Diagram with coronavirus recession and bankruptcy progress. Vector
Free with trial Graph with covid decrease report. Diagram with coronavirus recession and bankruptcy progress. Vector illustration. Decrease graph line icon vectors Graph with covid decrease report. Diagram with coronavirus recession and bankruptcy progress. Vector
Free with trial Graph with decrease report. Diagram with recession and bankruptcy progress. Business and finance vector illustration. Decrease graph line icon vectors Graph with decrease report. Diagram with recession and bankruptcy progress
Free with trial Graph with decrease report. Diagram with recession and bankruptcy progress. Business and finance vector illustration. Decrease graph line icon vectors Graph with decrease report. Diagram with recession and bankruptcy progress
Free with trial Graph down. Black Icon graph decline with arrow isolated on white background. Hologram statistic. Deficit direction for business concept design. Analysis information forecast. Vector illustration. Decrease graph line icon vectors Graph down. Black Icon graph decline with arrow isolated on white background. Hologram deficit direction for business design. Graph down. Black Icon graph decline with arrow isolated on white background. Hologram statistic. Deficit direction for business concept design. Analysis information forecast. Vector illustration
Free with trial Graph with Trend Line with Arrow Going Down in Flat Style. Vector Illustration. Decrease graph line icon vectors Graph with Trend Line with Arrow Going Down in Flat Style. Vector Illustration. Graph with Trend Line with Arrow Going Down in Flat Style
Free with trial Graph down. Black icon graph decline with arrow isolated on white background. Hologram statistic. Deficit direction for business concept design. Analysis information forecast. Vector illustration. Decrease graph line icon vectors Graph down. Black icon graph decline with arrow. Hologram statistic. Deficit direction business. Analysis information forecast. Graph down. Black icon graph decline with arrow isolated on white background. Hologram statistic. Deficit direction for business concept design. Analysis information forecast. Vector illustration
Free with trial Cost reduction icon price lower arrow. Vector low cost money crisis line icon. Decrease graph line icon vectors Cost reduction icon price lower arrow. Vector low cost money crisis line icon
Free with trial Cost reduction icon price lower arrow. Vector low cost money crisis line icon. Decrease graph line icon vectors Cost reduction icon price lower arrow. Vector low cost money crisis line icon
Free with trial Cost reduction icon price lower arrow. Vector low cost money crisis line icon. Decrease graph line icon vectors Cost reduction icon price lower arrow. Vector low cost money crisis line icon
Free with trial Cost reduction icon price lower arrow. Vector low cost money crisis line icon. Decrease graph line icon vectors Cost reduction icon price lower arrow. Vector low cost money crisis line icon
Free with trial Cost reduction icon price lower arrow. Vector low cost money crisis line icon. Decrease graph line icon vectors Cost reduction icon price lower arrow. Vector low cost money crisis line icon
Free with trial Cost reduction icon price lower arrow. Vector low cost money crisis line icon. Decrease graph line icon vectors Cost reduction icon price lower arrow. Vector low cost money crisis line icon
Free with trial Cost reduction icon price lower arrow. Vector low cost money crisis line icon. Decrease graph line icon vectors Cost reduction icon price lower arrow. Vector low cost money crisis line icon
Free with trial Graph with decrease report. Diagram with recession and bankruptcy progress. Business and finance vector illustration. Decrease graph line icon vectors Graph with decrease report. Diagram with recession and bankruptcy progress. Business and finance
Free with trial Graph with decrease report. Diagram with recession and bankruptcy progress. Business and finance vector illustration. Decrease graph line icon vectors Graph with decrease report. Diagram with recession and bankruptcy progress. Business and finance
Free with trial Graph with decrease report. Diagram with recession and bankruptcy progress. Business and finance vector illustration. Decrease graph line icon vectors Graph with decrease report. Diagram with recession and bankruptcy progress. Business and finance
Free with trial Graph with decrease report. Diagram with recession and bankruptcy progress. Business and finance vector illustration. Decrease graph line icon vectors Graph with decrease report. Diagram with recession and bankruptcy progress. Business and finance
Free with trial Graph with decrease report. Diagram with recession and bankruptcy progress. Business and finance vector illustration. Decrease graph line icon vectors Graph with decrease report. Diagram with recession and bankruptcy progress. Business and finance
Free with trial Graph with decrease report. Diagram with recession and bankruptcy progress. Business and finance vector illustration. Decrease graph line icon vectors Graph with decrease report. Diagram with recession and bankruptcy progress. Business and finance
Free with trial Graph with covid decrease report. Diagram with coronavirus recession and bankruptcy progress. Vector illustration. Decrease graph line icon vectors Graph with covid decrease report. Diagram with coronavirus recession and bankruptcy progress
Free with trial Graph with covid decrease report. Diagram with coronavirus recession and bankruptcy progress. Vector illustration. Decrease graph line icon vectors Graph with covid decrease report. Diagram with coronavirus recession and bankruptcy progress
Free with trial Diagram with recession and bankruptcy progress. Graph with decrease report. Business and finance vector illustration. Decrease graph line icon vectors Diagram with recession and bankruptcy progress. Graph with decrease report. Business and finance vector
Free with trial Graph with decrease report. Diagram with recession and bankruptcy progress. Business and finance vector illustration. Decrease graph line icon vectors Graph with decrease report. Diagram with recession and bankruptcy progress. Business and finance vector
Free with trial Graph with decrease report. Diagram with recession and bankruptcy progress. Business and finance vector illustration. Decrease graph line icon vectors Graph with decrease report. Diagram with recession and bankruptcy progress. Business and finance vector
Free with trial Graph with decrease report. Diagram with recession and bankruptcy progress. Business and finance vector illustration. Decrease graph line icon vectors Graph with decrease report. Diagram with recession and bankruptcy progress. Business and finance vector
Free with trial Graph with decrease report. Diagram with recession and bankruptcy progress. Business and finance vector illustration. Decrease graph line icon vectors Graph with decrease report. Diagram with recession and bankruptcy progress. Business and finance vector
Free with trial Graph with decrease report. Diagram with recession and bankruptcy progress. Business and finance vector illustration. Decrease graph line icon vectors Graph with decrease report. Diagram with recession and bankruptcy progress. Business and finance vector
Free with trial Graph with decrease report. Diagram with recession and bankruptcy progress. Business and finance vector illustration. Decrease graph line icon vectors Graph with decrease report. Diagram with recession and bankruptcy progress. Business and finance vector
Free with trial Graph with decrease report. Diagram with recession and bankruptcy progress. Business and finance vector illustration. Decrease graph line icon vectors Graph with decrease report. Diagram with recession and bankruptcy progress. Business and finance vector
Free with trial Graph with decrease report. Diagram with recession and bankruptcy progress. Business and finance vector illustration. Decrease graph line icon vectors Graph with decrease report. Diagram with recession and bankruptcy progress. Business and finance vector
Free with trial Graph with decrease report. Diagram with recession and bankruptcy progress. Business and finance vector illustration. Decrease graph line icon vectors Graph with decrease report. Diagram with recession and bankruptcy progress. Business and finance vector
Free with trial Graph with decrease report. Diagram with recession and bankruptcy progress. Business and finance vector illustration. Decrease graph line icon vectors Graph with decrease report. Diagram with recession and bankruptcy progress. Business and finance vector
Free with trial Graph with decrease report. Diagram with recession and bankruptcy progress. Business and finance vector illustration. Decrease graph line icon vectors Graph with decrease report. Diagram with recession and bankruptcy progress. Business and finance vector
Free with trial Graph with decrease report. Diagram with recession and bankruptcy progress. Business and finance vector illustration. Decrease graph line icon vectors Graph with decrease report. Diagram with recession and bankruptcy progress. Business and finance vector
Free with trial Graph with decrease report. Diagram with recession and bankruptcy progress. Business and finance vector illustration. Decrease graph line icon vectors Graph with decrease report. Diagram with recession and bankruptcy progress. Business and finance vector
Free with trial Graph with decrease report. Diagram with recession and bankruptcy progress. Business and finance vector illustration. Decrease graph line icon vectors Graph with decrease report. Diagram with recession and bankruptcy progress. Business and finance vector
Free with trial Graph with decrease report. Diagram with recession and bankruptcy progress. Business and finance vector illustration. Decrease graph line icon vectors Graph with decrease report. Diagram with recession and bankruptcy progress. Business and finance vector
Free with trial Graph with decrease report. Diagram with recession and bankruptcy progress. Business and finance vector illustration. Decrease graph line icon vectors Graph with decrease report. Diagram with recession and bankruptcy progress. Business and finance vector
Free with trial Graph with decrease report. Diagram with recession and bankruptcy progress. Business and finance vector illustration. Decrease graph line icon vectors Graph with decrease report. Diagram with recession and bankruptcy progress. Business and finance vector
Free with trial Deflation line icon set. Economic crisis sign. Vector illustration isolated on transparent background. Decrease graph line icon vectors Deflation line icon set
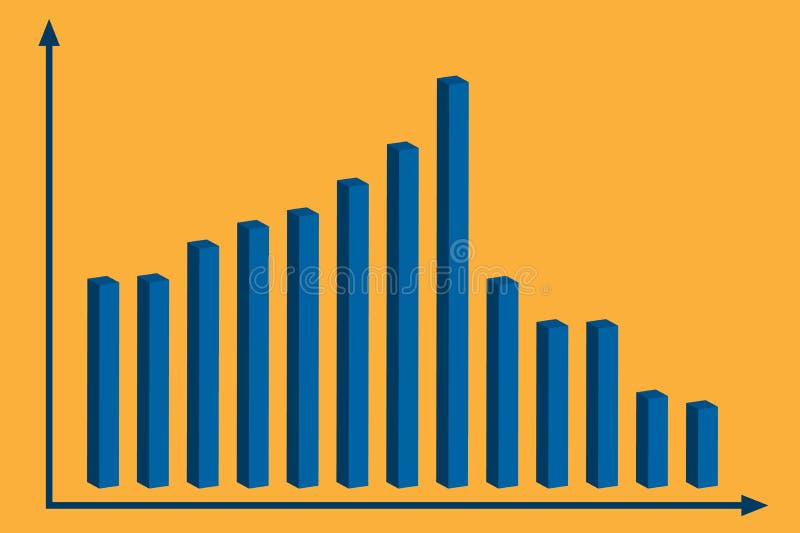
Free with trial 3d graph with decrease report. Diagram with recession and bankruptcy progress. Business and finance vector illustration. Decrease graph line icon vectors 3d graph with decrease report. Diagram with recession and bankruptcy progress. Business and finance vector
Free with trial 3d graph with decrease report. Diagram with recession and bankruptcy progress. Business and finance vector illustration. Decrease graph line icon vectors 3d graph with decrease report. Diagram with recession and bankruptcy progress. Business and finance vector
Free with trial 3d graph with decrease report. Diagram with recession and bankruptcy progress. Business and finance vector illustration. Decrease graph line icon vectors 3d graph with decrease report. Diagram with recession and bankruptcy progress. Business and finance vector
Free with trial 3d graph with decrease report. Diagram with recession and bankruptcy progress. Business and finance vector illustration. Decrease graph line icon vectors 3d graph with decrease report. Diagram with recession and bankruptcy progress. Business and finance vector
Free with trial Graph with decrease report. 3d diagram with recession and bankruptcy progress. Business and finance vector illustration. Decrease graph line icon vectors Graph with decrease report. 3d diagram with recession and bankruptcy progress. Business and finance vector
Free with trial Flat search icon of bitcoin cryptocurrency graph going down. Decrease graph line icon vectors Search icon of bitcoin cryptocurrency graph going down
Free with trial Career growth conceptual icon. Graph vector design. Chart illustration. Decrease graph line icon vectors Career growth conceptual icon. Graph vector design
Free with trial Increase decrease and arrow vector icon set design, 48x48 pixel perfect and editable stroke. Decrease graph line icon vectors Increase decrease icon. Increase decrease and arrow vector icon set design, 48x48 pixel perfect and editable stroke
Free with trial Increase decrease and arrow vector icon set, 48x48 pixel perfect and editable stroke. Decrease graph line icon vectors Increase decrease icon. Increase decrease and arrow vector icon set, 48x48 pixel perfect and editable stroke
Free with trial Decreasing arrows graph icon isolated on white background,flat vector illustration can be used for web, mobile and print. Decrease graph line icon vectors Decreasing arrows graph icon
Free with trial Increase decrease and arrow vector icon set design, 48x48 pixel perfect and editable stroke. Decrease graph line icon vectors Increase decrease icon. Increase decrease and arrow vector icon set design, 48x48 pixel perfect and editable stroke
Free with trial Increase decrease and arrow vector icon set design, 48x48 pixel perfect and editable stroke. Decrease graph line icon vectors Increase decrease icon. Increase decrease and arrow vector icon set design, 48x48 pixel perfect and editable stroke