Free with trial A black icon of a line graph showing a downward trend on a white background. Clear details and vibrant colors. Decrease graph line icon illustrations Black icon of a downward trending graph on white background chart decline. A black icon of a line graph showing a downward trend on a white background. Clear details and vibrant colors
Free with trial Global recession icon showing declining graph and downward arrow with globe and money, line art icon set. Decrease graph line icon vectors Global recession icon showing declining graph and downward arrow with globe and money, line art icon set
Free with trial Set line Global economic crisis Drop in crude oil price Dollar rate decrease Money bag Burning dollar bill and Safe icon. Vector. Decrease graph line icon vectors Set line Global economic crisis, Drop in crude oil price, Dollar rate decrease, Money bag, Burning dollar bill and Safe
Free with trial A split-screen business concept image contrasts a blue line graph with downward-pointing red arrows against a black background on the left side, symbolizing declining metrics or negative financial performance, with a right side featuring a pink line-drawn person icon with a sad expression wearing a blue shirt against a grey-to-white gradient background, representing human emotional response to. Decrease graph line icon illustrations Business concept showing declining graph with sad person icon representing negative financial performance and economic downturn. A split-screen business concept image contrasts a blue line graph with downward-pointing red arrows against a black background on the left side, symbolizing declining metrics or negative financial performance, with a right side featuring a pink line-drawn person icon with a sad expression wearing a blue shirt against a grey-to-white gradient background, representing human emotional response to
Free with trial Set line Hierarchy organogram chart Many ways directional arrow Graph diagram Dollar symbol Financial growth decrease Clock Intersection point and Arrow icon. Vector. Decrease graph line icon vectors Set line Hierarchy organogram chart, Many ways directional arrow, Graph, diagram, Dollar symbol, Financial growth. Set line Hierarchy organogram chart Many ways directional arrow Graph diagram Dollar symbol Financial growth decrease Clock Intersection point and Arrow icon. Vector.
Free with trial Line art bar graph icon set featuring upward and downward trend arrows for business analysis. Decrease graph line icon vectors Line art bar graph icon set featuring upward and downward trend arrows for business analysis
Free with trial Isolated showing simple line graph showing a downward trend on white background keywords: graph, chart, line, trend, data, decline, decrease. Decrease graph line icon illustrations Simple line graph showing a downward trend on white background Keywords: graph, chart, line, trend, data, decline
Free with trial Black and white line graph showing decreasing population statistics over time. Decrease graph line icon vectors Line graph showing decreasing population statistics icon. Black and white line graph showing decreasing population statistics over time
Free with trial Vibrant data visualization featuring bar and line graphs, sun icon, and descending trend lines against a stark black background in a flat style. Decrease graph line icon vectors Colorful data visualization with bar graphs, line graph, sun icon, and descending trends on a black background. Vibrant data visualization featuring bar and line graphs, sun icon, and descending trend lines against a stark black background in a flat style.
Free with trial Decrease vector icon on the white background. EPS 10. Decrease graph line icon vectors Decrease thin line vector icon set. Decrease vector icon on the white background. EPS 10
Free with trial Decrease vector icon on the white background. EPS 10. Decrease graph line icon vectors Decrease thin line vector icon set. Decrease vector icon on the white background. EPS 10
Free with trial Decrease vector icon on the white background. EPS 10. Decrease graph line icon vectors Decrease thin line vector icon set. Decrease vector icon on the white background. EPS 10
Free with trial Decrease vector icon on the white background. EPS 10. Decrease graph line icon vectors Decrease thin line vector icon set. Decrease vector icon on the white background. EPS 10
Free with trial Decrease vector icon on the white background. EPS 10. Decrease graph line icon vectors Decrease thin line vector icon set. Decrease vector icon on the white background. EPS 10
Free with trial Decrease vector icon on the white background. EPS 10. Decrease graph line icon vectors Decrease thin line vector icon set. Decrease vector icon on the white background. EPS 10
Free with trial Decrease vector icon on the white background. EPS 10. Decrease graph line icon vectors Decrease thin line vector icon set. Decrease vector icon on the white background. EPS 10
Free with trial Decrease vector icon on the white background. EPS 10. Decrease graph line icon vectors Decrease thin line vector icon set. Decrease vector icon on the white background. EPS 10
Free with trial Decrease vector icon on the white background. EPS 10. Decrease graph line icon vectors Decrease thin line vector icon set. Decrease vector icon on the white background. EPS 10
Free with trial Decrease vector icon on the white background. EPS 10. Decrease graph line icon vectors Decrease thin line vector icon set. Decrease vector icon on the white background. EPS 10
Free with trial 3D render icon Line graph tracking energy consumption with a playful narrative icon 3d analysis. Generative AI. Decrease graph line icon illustrations 3D render icon Line graph tracking energy consumption with a playful narrative icon 3d analysis
Free with trial 3D render icon Line graph tracking energy consumption with a playful narrative icon 3d analysis. Generative AI. Decrease graph line icon illustrations 3D render icon Line graph tracking energy consumption with a playful narrative icon 3d analysis
Free with trial 3D render icon Line graph tracking energy consumption with a playful narrative icon 3d analysis. Generative AI. Decrease graph line icon illustrations 3D render icon Line graph tracking energy consumption with a playful narrative icon 3d analysis
Free with trial 3D render icon Line graph tracking energy consumption with a playful narrative icon 3d analysis. Generative AI. Decrease graph line icon illustrations 3D render icon Line graph tracking energy consumption with a playful narrative icon 3d analysis
Free with trial 3D render icon Line graph tracking energy consumption with a playful narrative icon 3d analysis. Generative AI. Decrease graph line icon illustrations 3D render icon Line graph tracking energy consumption with a playful narrative icon 3d analysis
Free with trial Downward trend line color icon. Statistical chart, metric analysis. Performance decrease, data visualization. Isolated vector illustration. Flat colorful symbol design. Editable stroke. Decrease graph line icon vectors Downward trend line color icon
Free with trial Square icon with rounded edges featuring a red downward-trending bar graph on a white background. The graph has five bars of varying heights, each decreasing from left to right, with a red arrow descending across the tops of the bars. The icon is set against a plain gray background, highlighting the contrast between the red graph and the white square. The design suggests a decrease or decline in data or statistics, commonly used in business or financial contexts. Decrease graph line icon illustrations Square icon with rounded edges featuring a red downward-trending bar graph on a
Free with trial Set line Server Website with stocks market Infographic of city map Laptop browser window Financial growth decrease Browser shield Photo retouching and Secure your HTTPS SSL icon. Vector. Decrease graph line icon illustrations Set line Server, Website with stocks market, Infographic of city map, Laptop browser window, Financial growth decrease. Set line Server Website with stocks market Infographic of city map Laptop browser window Financial growth decrease Browser shield Photo retouching and Secure your HTTPS SSL icon. Vector.
Free with trial A simple line graph illustration showing fluctuations and an upward trend. The graph is drawn on a grid with a black line and red data points, indicating a period of increase, followed by a decrease, and then a final increase. This image can be used to represent business trends, financial analysis, stock market data, or any data that shows changes over time. Decrease graph line icon vectors Line Graph with Fluctuations. A simple line graph illustration showing fluctuations and an upward trend. The graph is drawn on a grid with a black line and red data points, indicating a period of increase, followed by a decrease, and then a final increase. This image can be used to represent business trends, financial analysis, stock market data, or any data that shows changes over time.
Free with trial A simple and modern black silhouette icon of a business graph, isolated on a white background. This flat vector illustration combines a bar chart with an overlaid line graph, showing a fluctuating trend with a general decline. The graphic symbolizes concepts such as data analysis, financial reporting, market statistics, economic downturn, and business performance metrics. It's an ideal visual element for presentations, infographics, websites, and applications related to finance, economics, and analytics, representing concepts of decrease, loss, or market volatility. Decrease graph line icon vectors Business Data Analytics Chart Icon. A simple and modern black silhouette icon of a business graph, isolated on a white background. This flat vector illustration combines a bar chart with an overlaid line graph, showing a fluctuating trend with a general decline. The graphic symbolizes concepts such as data analysis, financial reporting, market statistics, economic downturn, and business performance metrics. It's an ideal visual element for presentations, infographics, websites, and applications related to finance, economics, and analytics, representing concepts of decrease, loss, or market volatility.
Free with trial A colored outline vector icon of a line graph showing a downward trend, indicating a decrease or decline. Represents financial trends, statistics, losses, or negative performance. Useful for finance, business reports, or data visualization showing reduction. Illustrates a declining value over time, vector design Generative AI. Decrease graph line icon vectors Decreasing Trend Stock Market Graph Vector, vector design Generative AI. A colored outline vector icon of a line graph showing a downward trend, indicating a decrease or decline. Represents financial trends, statistics, losses, or negative performance. Useful for finance, business reports, or data visualization showing reduction. Illustrates a declining value over time, vector design Generative AI
Free with trial Economic crisis line icon of investment decline with arrow down, vector outline symbol. Global economy downturn and bankruptcy or world crisis in banking business and stock exchange decrease. Decrease graph line icon vectors Economic crisis line icon of investment decline
Free with trial A modern flat design icon representing financial data analysis and market trends. This vector illustration features a combination of a green bar chart and a dark grey line graph, showing fluctuations in performance. An upward arrow indicates initial growth, followed by a volatile trend line symbolizing concepts like market instability, economic changes, profit and loss, or business analytics. This versatile graphic is perfect for infographics, financial reports, presentations, websites, and applications related to business, finance, statistics, and economics. Isolated on a white background for easy use. Decrease graph line icon vectors Financial Market Fluctuation Graph Icon. A modern flat design icon representing financial data analysis and market trends. This vector illustration features a combination of a green bar chart and a dark grey line graph, showing fluctuations in performance. An upward arrow indicates initial growth, followed by a volatile trend line symbolizing concepts like market instability, economic changes, profit and loss, or business analytics. This versatile graphic is perfect for infographics, financial reports, presentations, websites, and applications related to business, finance, statistics, and economics. Isolated on a white background for easy use.
Free with trial Set line Data analysis Search data Financial growth decrease Server security with padlock Pie chart infographic and icon. Vector. Decrease graph line icon vectors Set line Data analysis, Search data, Financial growth decrease, Server security with padlock, Pie chart infographic, and
Free with trial A collection of eight black and white, hand-drawn or doodle style icons. Each square icon features a different line graph, representing data, analytics, statistics, or financial trends. Decrease graph line icon illustrations Set of hand drawn financial chart line graph icons isolated on white. A collection of eight black and white, hand-drawn or doodle style icons. Each square icon features a different line graph, representing data, analytics, statistics, or financial trends
Free with trial A collection of eight black and white, hand-drawn or doodle style icons. Each square icon features a different line graph, representing data, analytics, statistics, or financial trends. Decrease graph line icon illustrations Set of hand drawn financial chart line graph icons isolated on white. A collection of eight black and white, hand-drawn or doodle style icons. Each square icon features a different line graph, representing data, analytics, statistics, or financial trends
Free with trial Line art style icon of a smartphone displaying a decreasing graph, representing negative market trends. Decrease graph line icon vectors Smartphone showing decreasing graph icon outline vector. Line art style icon of a smartphone displaying a decreasing graph, representing negative market trends
Free with trial Report line icon. Neumorphic, Flat shadow, 3d buttons. Column graph, pie chart sign. Market analytics symbol. Line report icon. Social media icons. Vector. Decrease graph line icon vectors Report line icon. Column graph, pie chart sign. Neumorphic buttons. Vector. Report line icon. Neumorphic, Flat shadow, 3d buttons. Column graph, pie chart sign. Market analytics symbol. Line report icon. Social media icons. Vector
Free with trial A simple line style icon of a bar chart representing growth, data, or statistics. This graphic element is perfect for use in presentations, infographics, web design, and user interfaces. Decrease graph line icon vectors Simple Line Style Bar Chart Graphic Outline Display Graph Icon. A simple line style icon of a bar chart representing growth, data, or statistics. This graphic element is perfect for use in presentations, infographics, web design, and user interfaces.
Free with trial Doodle style bar and line graph icon representing growth and analytics. Decrease graph line icon vectors Doodle style bar and line graph icon representing growth and analytics
Free with trial Decrease vector icon on the white background. EPS 10. Decrease graph line icon vectors Decrease thin line vector icon set. Decrease vector icon on the white background. EPS 10
Free with trial Decrease vector icon on the white background. EPS 10. Decrease graph line icon vectors Decrease thin line vector icon set. Decrease vector icon on the white background. EPS 10
Free with trial Decrease vector icon on the white background. EPS 10. Decrease graph line icon vectors Decrease thin line vector icon set. Decrease vector icon on the white background. EPS 10
Free with trial Decrease vector icon on the white background. EPS 10. Decrease graph line icon vectors Decrease thin line vector icon set. Decrease vector icon on the white background. EPS 10
Free with trial Decrease vector icon on the white background. EPS 10. Decrease graph line icon vectors Decrease thin line vector icon set. Decrease vector icon on the white background. EPS 10
Free with trial Decrease vector icon on the white background. EPS 10. Decrease graph line icon vectors Decrease thin line vector icon set. Decrease vector icon on the white background. EPS 10
Free with trial Decrease vector icon on the white background. EPS 10. Decrease graph line icon vectors Decrease thin line vector icon set. Decrease vector icon on the white background. EPS 10
Free with trial Decrease vector icon on the white background. EPS 10. Decrease graph line icon vectors Decrease thin line vector icon set. Decrease vector icon on the white background. EPS 10
Free with trial Decrease vector icon on the white background. EPS 10. Decrease graph line icon vectors Decrease thin line vector icon set. Decrease vector icon on the white background. EPS 10
Free with trial Decrease vector icon on the white background. EPS 10. Decrease graph line icon vectors Decrease thin line vector icon set. Decrease vector icon on the white background. EPS 10
Free with trial Decrease vector icon on the white background. EPS 10. Decrease graph line icon vectors Decrease thin line vector icon set. Decrease vector icon on the white background. EPS 10
Free with trial Decrease vector icon on the white background. EPS 10. Decrease graph line icon vectors Decrease thin line vector icon set. Decrease vector icon on the white background. EPS 10
Free with trial Decrease vector icon on the white background. EPS 10. Decrease graph line icon vectors Decrease thin line vector icon set. Decrease vector icon on the white background. EPS 10
Free with trial Decrease vector icon on the white background. EPS 10. Decrease graph line icon vectors Decrease thin line vector icon set. Decrease vector icon on the white background. EPS 10
Free with trial Man, crypto price or line graph decrease in studio, stock market broker or financial loss on white background. Illustration, current economy trend or value drop of currency for interest rate risk. Decrease graph line icon illustrations Man, crypto price or line graph decrease in studio, stock market broker or financial loss on white background
Free with trial Set line Credit card, Pie chart infographic, Prison cell door and Dollar rate decrease icon. Vector. Decrease graph line icon illustrations Set line Credit card, Pie chart infographic, Prison cell door and Dollar rate decrease icon. Vector
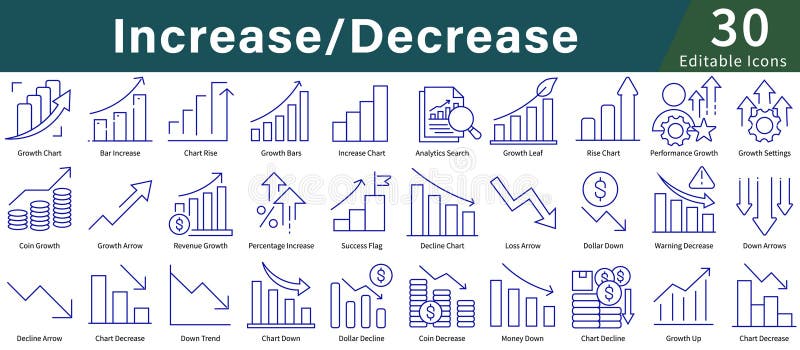
Free with trial Icons illustrating concepts of "Increase Decrease," using simple blue line art. Features include graphs and charts with upward and downward arrows, coins, dollar symbols, and percentage signs. Icons depict growth, decline, analytics, and performance tracking. Suitable for business, finance, or data analysis themes, these icons provide a visual representation of financial trends and statistics, making abstract concepts clear and easily understandable. The design is minimalistic and user-friendly, aimed at enhancing clarity in presentations and reports. Decrease graph line icon vectors Increase Decrease Icon Set in Line Style with Editable Vector for Growth, Analytics, Charts, and Data Visualization. Icons illustrating concepts of "Increase Decrease," using simple blue line art. Features include graphs and charts with upward and downward arrows, coins, dollar symbols, and percentage signs. Icons depict growth, decline, analytics, and performance tracking. Suitable for business, finance, or data analysis themes, these icons provide a visual representation of financial trends and statistics, making abstract concepts clear and easily understandable. The design is minimalistic and user-friendly, aimed at enhancing clarity in presentations and reports.
Free with trial Set line Tearing money banknote Dollar rate decrease Calculation of expenses Shutdown factory Money bomb dollar crisis Pie chart infographic Mobile stock trading and Global economic icon. Vector. Decrease graph line icon illustrations Set line Tearing money banknote, Dollar rate decrease, Calculation of expenses, Shutdown factory, Money bomb dollar. Set line Tearing money banknote Dollar rate decrease Calculation of expenses Shutdown factory Money bomb dollar crisis Pie chart infographic Mobile stock trading and Global economic icon. Vector.
Free with trial Set line Laptop with browser window Browser Cloud technology data transfer Financial growth increase decrease Magnifying glass and delete Online shopping on screen and Server icon. Vector. Decrease graph line icon vectors Set line Laptop with browser window, Browser, Cloud technology data transfer, Financial growth increase, decrease. Set line Laptop with browser window Browser Cloud technology data transfer Financial growth increase decrease Magnifying glass and delete Online shopping on screen and Server icon. Vector.
Free with trial Set line Browser window Server Data Cloud upload Search engine Graph chart infographic and Financial growth decrease icon. Vector. Decrease graph line icon vectors Set line Browser window, Server, Data, Cloud upload, Search engine, Graph chart infographic and Financial growth. Set line Browser window Server Data Cloud upload Search engine Graph chart infographic and Financial growth decrease icon. Vector.
Free with trial Set line Drop in crude oil price, Dollar rate decrease, Debt ball chained to coin and Bank building icon. Vector. Decrease graph line icon illustrations Set line Drop in crude oil price, Dollar rate decrease, Debt ball chained to coin and Bank building icon. Vector
Free with trial Set Isometric line Briefcase, Mobile stock trading, Debt ball chained coin and Dollar rate decrease icon. Vector. Decrease graph line icon illustrations Set Isometric line Briefcase, Mobile stock trading, Debt ball chained coin and Dollar rate decrease icon. Vector
Free with trial Set line Falling property prices Dollar rate decrease Tearing money banknote Storm Drop crude oil Mobile stock trading Briefcase and icon. Vector. Decrease graph line icon illustrations Set line Falling property prices, Dollar rate decrease, Tearing money banknote, Storm, Drop crude oil, Mobile stock. Set line Falling property prices Dollar rate decrease Tearing money banknote Storm Drop crude oil Mobile stock trading Briefcase and icon. Vector.
Free with trial Set line Dollar rate decrease Drop in crude oil price Mobile stock trading Briefcase Global economic crisis and Bank building icon. Vector. Decrease graph line icon vectors Set line Dollar rate decrease, Drop in crude oil price, Mobile stock trading, Briefcase, Global economic crisis, and. Set line Dollar rate decrease Drop in crude oil price Mobile stock trading Briefcase Global economic crisis and Bank building icon. Vector.
Free with trial Set line Pie chart infographic Pyramid infographics Light bulb Financial growth decrease Unknown search Arrow and Target icon. Vector. Decrease graph line icon vectors Set line Pie chart infographic, Pyramid infographics, Light bulb, Financial growth decrease, Unknown search, Arrow, and. Set line Pie chart infographic Pyramid infographics Light bulb Financial growth decrease Unknown search Arrow and Target icon. Vector.
Free with trial Set line Dollar rate decrease, Broken piggy bank, Pie chart infographic and Drop crude oil price. Glowing neon icon. Vector. Decrease graph line icon illustrations Set line Dollar rate decrease, Broken piggy bank, Pie chart infographic and Drop crude oil price. Glowing neon icon
Free with trial Set line Employee dismissal Global economic crisis Pie chart infographic Dollar rate decrease Safe Briefcase and Drop crude oil price icon. Vector. Decrease graph line icon vectors Set line Employee dismissal, Global economic crisis, Pie chart infographic, Dollar rate decrease, Safe, Briefcase and. Set line Employee dismissal Global economic crisis Pie chart infographic Dollar rate decrease Safe Briefcase and Drop crude oil price icon. Vector.
Free with trial Set line Search data analysis Server Cloud download and upload Binary code Financial growth decrease Browser with exclamation mark Data and icon. Vector. Decrease graph line icon vectors Set line Search data analysis, Server, Cloud download and upload, Binary code, Financial growth decrease, Browser with. Set line Search data analysis Server Cloud download and upload Binary code Financial growth decrease Browser with exclamation mark Data and icon. Vector.
Free with trial Set line Cloud computing lock Pie chart infographic Financial growth Search with folder Document and decrease icon. Vector. Decrease graph line icon illustrations Set line Cloud computing lock, Pie chart infographic, Financial growth, Search with folder, Document and decrease icon
Free with trial Set line Shutdown of factory Dollar rate decrease Debt ball chained coin Calculation expenses Mobile stock trading Worker and Global economic crisis news icon. Vector. Decrease graph line icon illustrations Set line Shutdown of factory, Dollar rate decrease, Debt ball chained coin, Calculation expenses, Mobile stock trading. Set line Shutdown of factory Dollar rate decrease Debt ball chained coin Calculation expenses Mobile stock trading Worker and Global economic crisis news icon. Vector.
Free with trial Set line Drop in crude oil price Global economic crisis Prison cell door Dollar rate decrease Mobile stock trading and icon. Vector. Decrease graph line icon illustrations Set line Drop in crude oil price, Global economic crisis, Prison cell door, Dollar rate decrease, Mobile stock trading. Set line Drop in crude oil price Global economic crisis Prison cell door Dollar rate decrease Mobile stock trading and icon. Vector.
Free with trial Set line Safe Drop in crude oil price Dollar rate decrease Money bag Mobile stock trading Pie chart infographic and icon. Vector. Decrease graph line icon vectors Set line Safe, Drop in crude oil price, Dollar rate decrease, Money bag, Mobile stock trading, Pie chart infographic and
Free with trial Set line Treasure chest Gold bars Chalkboard with diagram Stacks paper money cash ATM and Financial growth decrease and Price tag dollar icon. Vector. Decrease graph line icon vectors Set line Treasure chest, Gold bars, Chalkboard with diagram, Stacks paper money cash, ATM and, Financial growth decrease. Set line Treasure chest Gold bars Chalkboard with diagram Stacks paper money cash ATM and Financial growth decrease and Price tag dollar icon. Vector.
Free with trial Set line Financial growth decrease Data analysis Browser with stocks market Pie chart infographic Coal mine trolley and Cloud computing lock icon. Vector. Decrease graph line icon vectors Set line Financial growth decrease, Data analysis, Browser with stocks market, Pie chart infographic, Coal mine trolley. Set line Financial growth decrease Data analysis Browser with stocks market Pie chart infographic Coal mine trolley and Cloud computing lock icon. Vector.
Free with trial Set Isometric line Falling property prices, Dollar rate decrease, Global economic crisis and Debt ball chained to coin icon. Vector. Decrease graph line icon illustrations Set Isometric line Falling property prices, Dollar rate decrease, Global economic crisis and Debt ball chained to coin
Free with trial A 3D representation of a document displaying a bar chart and a dotted line graph, indicating data trends and analysis. A small, rounded icon featuring a landscape with mountains and a sun is placed ab. Decrease graph line icon illustrations 3d infographic showing a document with a bar chart and line graph, alongside a small image icon, isolated on white background. A 3D representation of a document displaying a bar chart and a dotted line graph, indicating data trends and analysis. A small, rounded icon featuring a landscape with mountains and a sun is placed ab
Free with trial Set line Drop in crude oil price Stop delivery cargo truck and Dollar rate decrease icon. Vector. Decrease graph line icon vectors Set line Drop in crude oil price, Stop delivery cargo truck and Dollar rate decrease icon. Vector
Free with trial Simple line art icon of a banner with a downward arrow symbolizing decrease or failure. Decrease graph line icon vectors Simple line art icon of a banner with a downward arrow symbolizing decrease or failure
Free with trial Line icon of decreasing chart representing reduced productivity, low performance, and efficiency decline. Suitable for business, work, stress, and health related topics. Decrease graph line icon vectors Reduced Productivity Icon Decrease Performance Efficiency Decline Symbol. Line icon of decreasing chart representing reduced productivity, low performance, and. Line icon of decreasing chart representing reduced productivity, low performance, and efficiency decline. Suitable for business, work, stress, and health related topics.
Free with trial Line icon of decreasing chart representing reduced productivity, low performance, and efficiency decline. Suitable for business, work, stress, and health related topics. Decrease graph line icon vectors Reduced Productivity Icon Decrease Performance Efficiency Decline Symbol black. Line icon of decreasing chart representing reduced productivity, low performance, and efficiency decline. Suitable for business, work, stress, and health related topics.
Free with trial Graph and diagram from planes with decrease. Finance and business concepts. Vector Illustration isolated. Decrease graph line icon vectors Graph and diagram from planes with decrease. Finance and business concepts. Vector Illustration