Free with trial Grey Financial growth decrease icon isolated on purple-blue background. Increasing revenue. Minimalism concept. 3D render illustration. Decrease graph symbol illustrations Grey Financial growth decrease icon isolated on purple-blue background. Increasing revenue. Minimalism concept. 3D
Free with trial Up and Down sign with golden arrows isolated on a black, vector illustration. Concept of sales bar chart symbol icon with arrow moving down and sales bar chart with gold arrows moving up and down. Decrease graph symbol vectors Up and Down sign with golden arrows isolated on a black, vector illustration. Concept of sales bar chart symbol
Free with trial Financial crisis concept. Decreasing graph with falling columns. Vector illustration showing recession, bankruptcy, and economic decline. Decrease graph symbol vectors Financial crisis concept. Decreasing graph with falling columns. Vector illustration showing recession, bankruptcy
Free with trial Arrow Up Down Icon North South Upward Downward Pointer Scale Rise Fall Elevator Sign Symbol Growth Scroll Gesture Position Navigation Location Sign. Decrease graph symbol vectors Arrow Up Down Icon North South Upward Downward Pointer Scale Rise Fall Elevator Sign Symbol Growth Scroll Gesture
Free with trial Purple-blue Financial growth decrease icon isolated on grey background. Increasing revenue. Minimalism concept. 3D render illustration. Decrease graph symbol illustrations Purple-blue Financial growth decrease icon isolated on grey background. Increasing revenue. Minimalism concept. 3D
Free with trial A 3D rendering shows a financial graph with a decreasing rate. The pink arrow points downwards, indicating a loss. The bars represent data points in a business or economic context. Decrease graph symbol illustrations Decreasing rate financial graph on white background. A 3D rendering shows a financial graph with a decreasing rate. The pink arrow points downwards, indicating a loss. The bars represent data points in a business or economic context
Free with trial A white line graph with connected points and a bar chart are shown within a dark gray circle icon, representing data analysis. Decrease graph symbol illustrations White line graph and bar chart in a dark gray circle icon data statistics. A white line graph with connected points and a bar chart are shown within a dark gray circle icon, representing data analysis
Free with trial A downward trend is shown on a graph. The graph is black and white. Decrease graph symbol illustrations A downward trend is shown on a graph
Free with trial Wood lumber price going down decrease cheaper in timber log commodity market international trading market vector. Decrease graph symbol vectors Wood lumber price going down decrease cheaper in timber log commodity market international trading market
Free with trial Set Coal mine trolley Server Pie chart infographic Financial growth Data analysis decrease and Sales funnel with icon. Vector. Decrease graph symbol vectors Set Coal mine trolley, Server, Pie chart infographic, Financial growth, Data analysis, decrease, and Sales funnel with. Set Coal mine trolley Server Pie chart infographic Financial growth Data analysis decrease and Sales funnel with icon. Vector.
Free with trial Downward blue arrow pointing to dollar coin descending beside soft cloud shape. Ideal for finance, economic loss, market decline, decrease, failure, risk, digital economy. Clean flat simple metaphor. Decrease graph symbol vectors Downward Trend in Financial Value with Dollar Symbol and Cloud Motif. Downward blue arrow pointing to dollar coin descending beside soft cloud shape. Ideal for finance, economic loss, market decline, decrease, failure, risk, digital economy. Clean flat simple metaphor
Free with trial A vibrant and modern illustration of a bar graph, featuring four bars of varying heights and colors: blue, green, orange, and red. The bars are positioned on a gray horizontal line, creating a sense of data comparison and visual hierarchy. This image is ideal for representing data, statistics, business reports, financial analysis, or any concept requiring visual data representation. The clean design and bright colors make it suitable for presentations, websites, and marketing materials. Decrease graph symbol illustrations Colorful Bar Graph Illustration. A vibrant and modern illustration of a bar graph, featuring four bars of varying heights and colors: blue, green, orange, and red. The bars are positioned on a gray horizontal line, creating a sense of data comparison and visual hierarchy. This image is ideal for representing data, statistics, business reports, financial analysis, or any concept requiring visual data representation. The clean design and bright colors make it suitable for presentations, websites, and marketing materials.
Free with trial Logotype line Financial growth decrease icon isolated on grey background. Increasing revenue. Logo design template element. Vector. Decrease graph symbol illustrations Logotype line Financial growth decrease icon isolated on grey background. Increasing revenue. Logo design template
Free with trial Graph with a red heart at the start and downward trend line, symbolizing breakup, relationship decline, and emotional loss over time. Decrease graph symbol vectors Graph with a red heart at the start and downward trend line, symbolizing breakup, relationship decline, and emotional loss over
Free with trial A bright blue neon arrow points downwards against a dark industrial wall, symbolizing loss or decrease for illustrative purposes. Decrease graph symbol illustrations Neon Arrow Down Indicator Graph. A bright blue neon arrow points downwards against a dark industrial wall, symbolizing loss or decrease for illustrative purposes
Free with trial White Financial growth decrease icon isolated with long shadow background. Increasing revenue. Circle button. Vector. Decrease graph symbol vectors White Financial growth decrease icon isolated with long shadow background. Increasing revenue. Circle button. Vector
Free with trial Stock market display with a red line graph indicating a downward trend on a digital screen. The graph is composed of jagged peaks and troughs, suggesting instability. Surrounding the graph are numeric data and grid lines, highlighting market performance details. The screen is located in a financial setting with a blurred, busy background, possibly an office or trading floor, enhancing the context of economic activity. The color red typically signifies a decrease or negative trend in market terms. Decrease graph symbol illustrations Red Stock Market Crash On Screen. Stock market display with a red line graph indicating a downward trend on a digital screen. The graph is composed of jagged peaks and troughs, suggesting instability. Surrounding the graph are numeric data and grid lines, highlighting market performance details. The screen is located in a financial setting with a blurred, busy background, possibly an office or trading floor, enhancing the context of economic activity. The color red typically signifies a decrease or negative trend in market terms.
Free with trial Set line Global economic crisis Gold bars Debt ball chained to coin Dollar rate decrease Prison cell door Safe and icon. Vector. Decrease graph symbol illustrations Set line Global economic crisis, Gold bars, Debt ball chained to coin, Dollar rate decrease, Prison cell door, Safe and
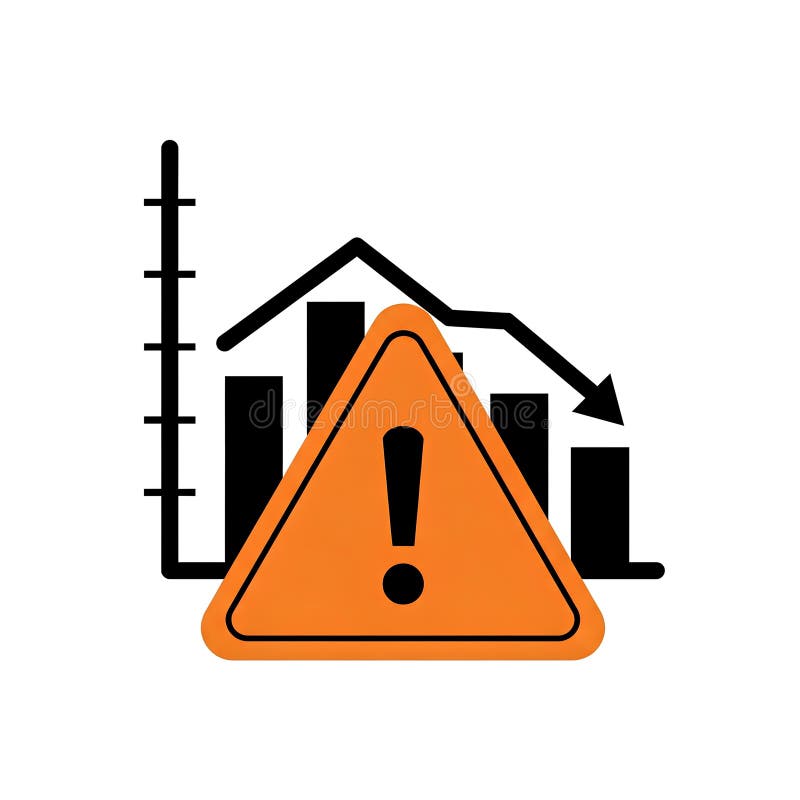
Free with trial Illustration of a downward trending graph with an orange warning sign in the foreground. The graph depicts a decline in performance or value. The warning sign highlights potential risks or negative outcomes. This image can be used to represent financial loss, economic downturn, business failure, or any situation where caution is advised. Decrease graph symbol illustrations Warning Sign with Declining Graph. Illustration of a downward trending graph with an orange warning sign in the foreground. The graph depicts a decline in performance or value. The warning sign highlights potential risks or negative outcomes. This image can be used to represent financial loss, economic downturn, business failure, or any situation where caution is advised.
Free with trial Price increase. Inflation icon group. Purchasing power decrease and savings. Services and goods cost rise. Vector illustration. Decrease graph symbol vectors Price increase. Inflation icon group. Purchasing power decrease and savings. Services and goods cost rise. Vector illustration.
Free with trial Line Financial growth decrease icon isolated on white background. Increasing revenue. Colorful outline concept. Vector. Decrease graph symbol illustrations Line Financial growth decrease icon isolated on white background. Increasing revenue. Colorful outline concept. Vector
Free with trial Set Financial growth decrease Cloud computing lock Pie chart infographic Server Sales funnel with and Data analysis icon. Vector. Decrease graph symbol illustrations Set Financial growth decrease, Cloud computing lock, Pie chart infographic, Server, Sales funnel with, and Data analysis
Free with trial Isometric line Financial growth decrease icon isolated on pink and blue background. Increasing revenue. Square button. Vector. Decrease graph symbol vectors Isometric line Financial growth decrease icon isolated on pink and blue background. Increasing revenue. Square button
Free with trial Line Financial growth decrease icon isolated on black background. Increasing revenue. Colorful outline concept. Vector. Decrease graph symbol illustrations Line Financial growth decrease icon isolated on black background. Increasing revenue. Colorful outline concept. Vector
Free with trial Ai-Generated. Professional chart stock image featuring set of black and white minimalist chart and graph line icons. Decrease graph symbol vectors Set of black and white minimalist chart and graph line icons
Free with trial Set line Debt ball chained to coin, Storm, Dollar rate decrease and Mobile stock trading. Business infographic template. Vector. Decrease graph symbol vectors Set line Debt ball chained to coin, Storm, Dollar rate decrease and Mobile stock trading. Business infographic template
Free with trial Set Isometric Financial growth increase Football betting money decrease and Casino dealer icon. Purple hexagon button. Vector. Decrease graph symbol vectors Set Isometric Financial growth increase, Football betting money, decrease and Casino dealer icon. Purple hexagon button. Set Isometric Financial growth increase. Set Isometric Financial growth increase Football betting money decrease and Casino dealer icon. Purple hexagon button. Vector.
Free with trial Black and white graph showing a fluctuating trend line with an upward and a downward arrow. Decrease graph symbol illustrations Black and white graph showing fluctuating trend with up and down arrows chart data. Black and white graph showing a fluctuating trend line with an upward and a downward arrow
Free with trial Mathematical showing black curve graph showing exponential decay on white background keywords: graph, chart. Decrease graph symbol illustrations Black curve graph showing exponential decay on white background Keywords: graph, chart, curve. Mathematical showing black curve graph showing exponential decay on white background keywords: graph, chart
Free with trial Graph of oscillating line with horizontal line and arrow isolated on white background. Decrease graph symbol vectors Graph of oscillating line with horizontal line and arrow isolated on white background
Free with trial Electricity energy price going down decrease cheaper in electric commodity market international trading market vector. Decrease graph symbol vectors Electricity energy price going down decrease cheaper in electric commodity market international trading market
Free with trial Data Stats Board Display Line Icon Downward Down Trend Statistic Performance Market Decline Economy Downturn Bar Graph Progress Outline Presentation. Decrease graph symbol vectors Data Stats Board Display Line Icon Downward Down Trend Statistic Performance Market Decline Economy Downturn Bar Graph
Free with trial A black and white illustration features a thermometer, a warning triangle with an exclamation mark, a percentage symbol, and a downward trending arrow. Decrease graph symbol vectors Warning Sign with Thermometer, Percentage Symbol, and Downward Arrow danger alert. A black and white illustration features a thermometer, a warning triangle with an exclamation mark, a percentage symbol, and a downward trending arrow
Free with trial A jagged black line graph shows a steep downward trend ending with an arrow. Clear details and vibrant colors. Decrease graph symbol illustrations Jagged black line graph trending downwards with arrow on white background line chart. A jagged black line graph shows a steep downward trend ending with an arrow. Clear details and vibrant colors
Free with trial This vector illustration shows a set of black graph icons with rising and falling charts indicated by arrows showing trends in data with clear simple design and sharp edges calm. Generative AI. Decrease graph symbol vectors Black graph icons set rising and falling charts with arrows vector illustration simple design. This vector illustration shows a set of black graph icons with rising and falling charts indicated by arrows showing trends in data with clear simple design and sharp edges calm. Generative AI
Free with trial A 3D cloud icon displays a downward trending graph and falling dollar coins, symbolizing financial decline or loss. Decrease graph symbol illustrations 3D Cloud Icon with Downward Trend Graph and Falling Dollar Coins finance economy. A 3D cloud icon displays a downward trending graph and falling dollar coins, symbolizing financial decline or loss
Free with trial A black bar graph icon with a downward arrow and trend line indicates a decline. Clear details and vibrant col. Decrease graph symbol illustrations Black Bar Graph Icon with Downward Arrow and Trend Line on White Background data. A black bar graph icon with a downward arrow and trend line indicates a decline. Clear details and vibrant col
Free with trial Black and white illustration of a market cooling graph with a fan and dollar sign. Decrease graph symbol illustrations Market cooling graph with fan, dollar sign and downward trend on white background. Black and white illustration of a market cooling graph with a fan and dollar sign
Free with trial Descending Bar Chart Illustration Depicting Decrease, Recession, Downturn with Arrow. Decrease graph symbol vectors Descending Bar Chart Illustration Depicting Decrease, Recession, Downturn with Arrow
Free with trial Uranium price going down decrease cheaper in metal mineral nuclear commodity market international trading market vector. Decrease graph symbol vectors Uranium price going down decrease cheaper in metal mineral nuclear commodity market international trading market
Free with trial A vibrant red arrow graph dramatically depicts a downward trend, ideal for illustrating concepts of decline, loss, recession, or negative growth. The transparent background allows for seamless integration into various designs, presentations, and reports. This vector graphic is perfect for financial reports, presentations, websites, and social media posts. Decrease graph symbol illustrations Red Downward Trending Arrow Graph on Transparent Background. A vibrant red arrow graph dramatically depicts a downward trend, ideal for illustrating concepts of decline, loss, recession, or negative growth. The transparent background allows for seamless integration into various designs, presentations, and reports. This vector graphic is perfect for financial reports, presentations, websites, and social media posts.
Free with trial A 3D bar graph illustrating a downward trend with a green arrow, featuring a heart icon with a minus sign, on a white background. Decrease graph symbol illustrations 3D bar graph with a downward trending green arrow and a heart icon with a minus sign chart. A 3D bar graph illustrating a downward trend with a green arrow, featuring a heart icon with a minus sign, on a white background
Free with trial A black line graph with a zigzagging downward trend and an arrow pointing down. Clear details and vibrant colo. Decrease graph symbol illustrations Black line graph showing a sharp downward trend on white background chart decline. A black line graph with a zigzagging downward trend and an arrow pointing down. Clear details and vibrant colo
Free with trial Declining graph indicating financial loss, sad face representing disappointment, coin symbolizing money, and cloud metaphor for challenges. Ideal for finance, business troubles, economic downturn. Decrease graph symbol vectors Financial Loss Concept with Declining Graph, Sad Face, Coin and Cloud Symbol. Declining graph indicating financial loss, sad face representing disappointment, coin symbolizing money, and cloud metaphor for challenges. Ideal for finance, business troubles, economic downturn
Free with trial Black triangular warning sign displaying a downward trending bar graph on a white background. Decrease graph symbol illustrations Warning sign with a downward trending bar graph on a white background danger caution. Black triangular warning sign displaying a downward trending bar graph on a white background
Free with trial A black line graph depicting a downward trend with an arrow on a white background Clear details and vibrant co. Decrease graph symbol illustrations Black line graph showing a downward trend with an arrow chart decline. A black line graph depicting a downward trend with an arrow on a white background Clear details and vibrant co
Free with trial A black line graph with two curves showing a downward trend on a white background. Decrease graph symbol illustrations Black line graph showing a downward trend with two lines on white background chart. A black line graph with two curves showing a downward trend on a white background
Free with trial An economic crisis with falling oil barrel price and red down arrow symbol financial risk and market volatility loss concept. Decrease graph symbol illustrations Economic crisis with falling oil barrel price and red down arrow symbol financial risk and market volatility loss concept
Free with trial This image features a minimalist black and white bar graph icon, depicting data analysis. It includes vertical bars of varying heights along horizontal and vertical axes. Decrease graph symbol vectors Simple Black and White Bar Graph Icon for Data Visualization. This image features a minimalist black and white bar graph icon, depicting data analysis. It includes vertical bars of varying heights along horizontal and vertical axes.
Free with trial Black line graph showing a downward trend on a white background with grid lines chart. Decrease graph symbol illustrations Black line graph showing a downward trend on a white background with grid lines chart
Free with trial A black graph shows a market normalization flat trend with a downward arrow on a white background. Decrease graph symbol illustrations Market normalization flat trend graph with downward arrow on white background image. A black graph shows a market normalization flat trend with a downward arrow on a white background
Free with trial A black icon showing a bar graph with a downward trending arrow indicating a decline. Decrease graph symbol illustrations Black bar graph with downward trending arrow icon on white background chart decline. A black icon showing a bar graph with a downward trending arrow indicating a decline
Free with trial Green arrow pointing downward on financial graph. Business chart with falling trend line. Digital stock market data visualization for investment analysis. Decrease graph symbol illustrations Green arrow pointing downward on financial graph. Business chart with falling trend line
Free with trial Black icon of a rising line graph with arrow pointing down on white background chart. Decrease graph symbol illustrations Black icon of a rising line graph with arrow pointing down on white background chart
Free with trial Simple black bar graph icon with bars of varying heights on a white background Clear details and vibrant color. Decrease graph symbol illustrations Simple black bar graph icon showing varying heights on a white background chart data. Simple black bar graph icon with bars of varying heights on a white background Clear details and vibrant color
Free with trial Three green arrows pointing downwards, each displaying a white percentage symbol. Isolated on a transparent background. Decrease graph symbol vectors Three Green Downward Arrows with Percent Symbol isolated on a transparent background. Three green arrows pointing downwards, each displaying a white percentage symbol. Isolated on a transparent background
Free with trial Set line Casino chips, Financial growth increase, Hand holding casino and decrease icon. Vector. Decrease graph symbol vectors Set line Casino chips, Financial growth increase, Hand holding casino and decrease icon. Vector
Free with trial A collection of four icons featuring downward pointing arrows with percentage symbols, illustrating concepts of discount and decrease. Decrease graph symbol illustrations Percentage down arrow icons representing discount and decrease. A collection of four icons featuring downward pointing arrows with percentage symbols, illustrating concepts of discount and decrease
Free with trial Declining business graph chart showing downward trend in finances. Decrease graph symbol vectors Declining business graph chart showing downward trend in finances
Free with trial Two flat design icons with color. One depicts an upward bar chart with a blue arrow and percentage, the other a downward bar chart with a grey arrow and percentage. Decrease graph symbol vectors Color Bar Chart Icons for Increase and Decrease graph Ai-Generated. Two flat design icons with color. One depicts an upward bar chart with a blue arrow and percentage, the other a downward bar chart with a grey arrow and percentage
Free with trial Euro currency down and up icon. Rise and fall European economy sign symbol vector. Decrease graph symbol vectors Euro currency down and up icon. Rise and fall European economy sign symbol
Free with trial Shocked Piggy Bank with Falling Graph on White Background. Decrease graph symbol illustrations Shocked Piggy Bank with Falling Graph on White Background
Free with trial A black silhouette of a financial graph with bars and jagged lines is shown on white. Decrease graph symbol illustrations Black silhouette of a financial graph with bars and jagged lines on white chart business. A black silhouette of a financial graph with bars and jagged lines is shown on white
Free with trial Downward trending bar graph with a black arrow, representing losses. Decrease graph symbol vectors Downward trending bar graph with a black arrow, representing losses
Free with trial Colorful bar graph with downward trend, business concept illustration. Decrease graph symbol vectors Colorful bar graph with downward trend, business concept illustration
Free with trial Line graph with a green line and a red dot on top. The red dot is located at the top left corner of the graph. Decrease graph symbol illustrations Graph with a green line and a red dot
Free with trial A conceptual image representing financial loss, economic downturn, or business failure. A person's hands are holding and seemingly guiding a glowing red line graph that is pointing sharply downwards. The arrow at the end confirms the negative trend. The neutral background keeps the focus on this clear symbol of decline. Generative AI. Decrease graph symbol illustrations Two hands holding a glowing red line graph that is trending downwards. A conceptual image representing financial loss, economic downturn, or business failure. A person's hands are holding and seemingly guiding a glowing red line graph that is pointing sharply downwards. The arrow at the end confirms the negative trend. The neutral background keeps the focus on this clear symbol of decline. Generative AI.
Free with trial An upward trending line graph showcases data points increasing, symbolizing growth and progress. The visual represents success, development, and positive statistics. Decrease graph symbol vectors Positive Trend Graph, Data Points Rising Upward. An upward trending line graph showcases data points increasing, symbolizing growth and progress. The visual represents success, development, and positive statistics.
Free with trial Money growth and fall on chart graph with arrow up and down, financial business invest. Vector flat illustration. Decrease graph symbol vectors Money growth and fall on chart graph with arrow up and down, financial business invest. Vector illustration
Free with trial A simple black and white illustration of a bar chart and a line graph showing business growth trends, isolated on a white background. Decrease graph symbol vectors Business growth bar chart and line graph isolated on white background. A simple black and white illustration of a bar chart and a line graph showing business growth trends, isolated on a white background
Free with trial Set Mobile stock trading, Dollar rate decrease, Broken piggy bank and icon. Vector. Decrease graph symbol illustrations Set Mobile stock trading, Dollar rate decrease, Broken piggy bank and icon. Vector
Free with trial Business bar graph with upward and downward arrow. Trend analysis icon vector. Decrease graph symbol vectors Business bar graph with upward and downward arrow. Trend analysis icon
Free with trial A graph with a reduction report. A dagram showing the recession and bankruptcy. Business and finance concept. Vector illustration. Decrease graph symbol vectors Graph with a reduction report. A dagram showing the recession and bankruptcy. Business and finance concept. Vector illustration
Free with trial Set Shutdown of factory, Dollar rate decrease and Pie chart infographic. Business infographic template. Vector. Decrease graph symbol illustrations Set Shutdown of factory, Dollar rate decrease and Pie chart infographic. Business infographic template. Vector
Free with trial Isometric illustration of a woman analyzing a graph with a magnifying glass, laptop, and coins, representing finance and business analysis. Decrease graph symbol vectors Woman analyzes graph with magnifying glass and laptop coin. isometric illustration of a woman analyzing a graph with a magnifying glass, laptop, and coins, representing finance and business analysis.
Free with trial Simple line graph illustrating data points and trends. Ideal for presentations, reports, and infographics related to business analysis, market research, or financial reporting. Decrease graph symbol vectors Simple Line Graph, Data Visualization, Business Chart. Simple line graph illustrating data points and trends. Ideal for presentations, reports, and infographics related to business analysis, market research, or financial reporting.
Free with trial Red graph plummeting down, illustrating market crash, downturn, and financial crisis, with percentage and dollar sign. Decrease graph symbol illustrations Market crash showing economic downturn with falling graph and percentage symbol. Red graph plummeting down, illustrating market crash, downturn, and financial crisis, with percentage and dollar sign
Free with trial Flat lay colorful arrow sign symbol falling down on blue background copy space. Abstract economy crisis, stock market collapse, business, finance and investment loss concept. Decrease graph symbol illustrations Flat lay colorful arrow sign symbol falling down on blue background copy space.
Free with trial Business performance decline icon vector. Productivity drop and process efficiency loss symbol. Decrease graph symbol vectors Business performance decline icon. Productivity drop and process efficiency loss symbol
Free with trial A vivid red arrow signifies a downward trend or negative movement. This impactful graphic represents decline loss decrease and is ideal for illustrating financial reports or data trends. Decrease graph symbol illustrations Bold red arrow points downward showing decline loss decrease trend direction. A vivid red arrow signifies a downward trend or negative movement. This impactful graphic represents decline loss decrease and is ideal for illustrating financial reports or data trends