Free with trial A minimalist, black and white vector icon representing a bar chart or graph. The icon features a series of vertical bars of varying heights, set against a base of horizontal lines. This clean and modern design is ideal for representing data, statistics, progress, growth, or financial information in digital and print media. Its simple aesthetic makes it versatile for use in presentations, websites, apps, and infographics. Decrease graph symbol vectors Abstract Bar Chart Icon. A minimalist, black and white vector icon representing a bar chart or graph. The icon features a series of vertical bars of varying heights, set against a base of horizontal lines. This clean and modern design is ideal for representing data, statistics, progress, growth, or financial information in digital and print media. Its simple aesthetic makes it versatile for use in presentations, websites, apps, and infographics.
Free with trial A conceptual image depicting a downward trend in the global economy and stock market, featuring a globe, gold coins, and a red declining graph line. Decrease graph symbol illustrations Global economy and stock market decline concept. A conceptual image depicting a downward trend in the global economy and stock market, featuring a globe, gold coins, and a red declining graph line
Free with trial Red candlestick chart with ruble currency symbol, dark background, digital screen texture, concept of market crash and economic recession, 3D Rendering. Decrease graph symbol illustrations Russian ruble crisis symbol with falling candlestick chart and red market crash indicators on dark screen background representing. Red candlestick chart with ruble currency symbol, dark background, digital screen texture, concept of market crash and economic recession, 3D Rendering
Free with trial A visual representation of market fluctuations and business performance, with a red downward arrow indicating a decrease and a green upward arrow signifying growth and positive trends. Decrease graph symbol illustrations Red down arrow and green up arrow symbols representing financial market trends and business growth. A visual representation of market fluctuations and business performance, with a red downward arrow indicating a decrease and a green upward arrow signifying growth and positive trends
Free with trial A bold, black arrow pointing diagonally downwards against a clean white background. The arrow is stylized with broken lines suggesting rapid decline or disruption. This versatile graphic can represent economic downturn, market crash, failure, decrease, or negative trends. It's suitable for business presentations, financial reports, and website design. Decrease graph symbol illustrations Downward Trend Arrow Icon. A bold, black arrow pointing diagonally downwards against a clean white background. The arrow is stylized with broken lines suggesting rapid decline or disruption. This versatile graphic can represent economic downturn, market crash, failure, decrease, or negative trends. It's suitable for business presentations, financial reports, and website design.
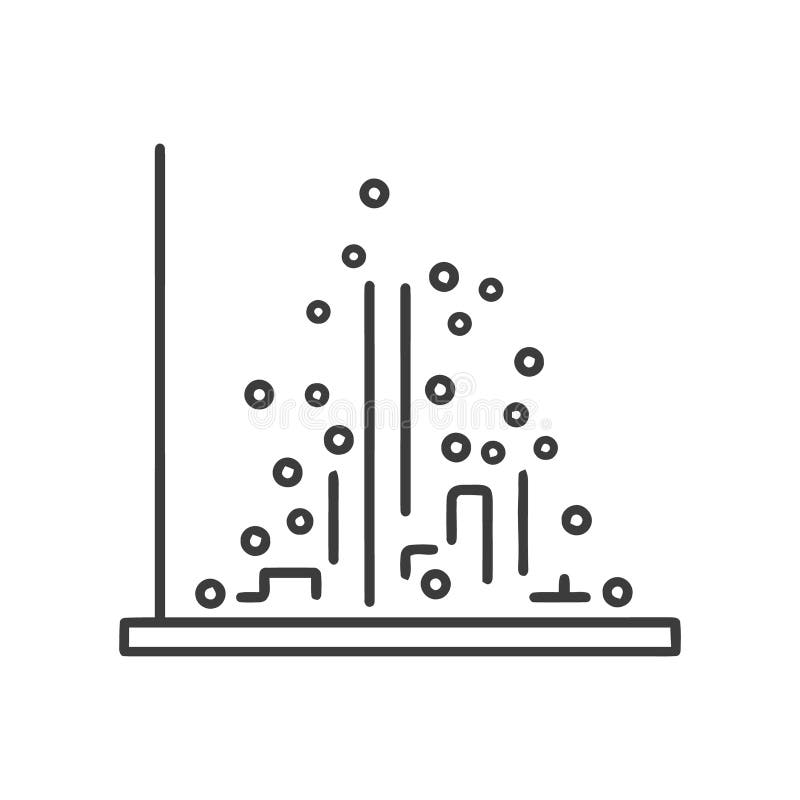
Free with trial Description: Simple line art illustration of a scatter plot graph showing an uneven distribution of data points. Perfect for presentations or reports. Decrease graph symbol vectors Abstract Data Visualization: Scatter Plot Chart with Irregular Data Points. Description: Simple line art illustration of a scatter plot graph showing an uneven distribution of data points. Perfect for presentations or reports.
Free with trial Arrows percent icons with up and down signs and percentage symbols featuring arrow, icon, symbol with up and graphics elements for illustrations. Decrease graph symbol vectors Arrows percent icons with up and down signs and percentage symbols featuring arrow
Free with trial A sharp red jagged arrow points downwards, symbolizing a significant decrease or loss, isolated on a clean white background. Decrease graph symbol illustrations Red downward trending jagged arrow indicating a sharp decline isolated on white background. A sharp red jagged arrow points downwards, symbolizing a significant decrease or loss, isolated on a clean white background
Free with trial A set of black icons representing percentage changes, including arrows and circular symbols. The icons depict various concepts such as decrease, increase, and rotation, all incorporating percentage signs. The simple design makes them versatile for use in financial, statistical, or educational materials. Decrease graph symbol illustrations Black percentage icons set. A set of black icons representing percentage changes, including arrows and circular symbols. The icons depict various concepts such as decrease, increase, and rotation, all incorporating percentage signs. The simple design makes them versatile for use in financial, statistical, or educational materials.
Free with trial A glossy red arrow curves downwards, symbolizing a decrease or downward trend, isolated on a clean white background. Decrease graph symbol illustrations A glossy red arrow curves downwards indicating a decline or fall isolated on white background. A glossy red arrow curves downwards, symbolizing a decrease or downward trend, isolated on a clean white background
Free with trial A 3D rendered red arrow sign pointing downwards, mounted on a black circular base. The image is set against a plain white background, highlighting the contrast between the red arrow and the dark base. This image can be used to represent decline, decrease, or downward trend in various contexts such as finance, statistics, or presentations. Decrease graph symbol illustrations Red Arrow Sign on Black Base. A 3D rendered red arrow sign pointing downwards, mounted on a black circular base. The image is set against a plain white background, highlighting the contrast between the red arrow and the dark base. This image can be used to represent decline, decrease, or downward trend in various contexts such as finance, statistics, or presentations.
Free with trial Abstract illustration of a downward trending arrow chart. The arrows are depicted in varying shades of blue and green, suggesting a gradual decline. This image can be used to represent concepts such as loss, decrease, negative growth, or a downward trend in various fields like finance, sales, or performance metrics. The clean background and simple design make it versatile for presentations, reports, and infographics. Decrease graph symbol illustrations Decreasing Trend Arrow Chart. Abstract illustration of a downward trending arrow chart. The arrows are depicted in varying shades of blue and green, suggesting a gradual decline. This image can be used to represent concepts such as loss, decrease, negative growth, or a downward trend in various fields like finance, sales, or performance metrics. The clean background and simple design make it versatile for presentations, reports, and infographics.
Free with trial A vibrant red arrow points downwards, symbolizing a significant drop in stock prices, economic recession, or negative financial trends. This image captures the essence of decline and loss. Decrease graph symbol illustrations Red downward arrow signifying financial decline and economic downturn symbol white background. A vibrant red arrow points downwards, symbolizing a significant drop in stock prices, economic recession, or negative financial trends. This image captures the essence of decline and loss
Free with trial A clean, minimalist illustration featuring a combined line graph and bar chart on a white background. The line graph, with circular data points, shows an upward trend with fluctuations. It is overlaid on a series of vertical bars, alternating in black and white, representing discrete data values. The grid lines behind the charts suggest a data analysis or financial context. This graphic is ideal for presentations, reports, and websites related to statistics, business growth, market trends, and data visualization. Decrease graph symbol vectors Line and Bar Chart Combination. A clean, minimalist illustration featuring a combined line graph and bar chart on a white background. The line graph, with circular data points, shows an upward trend with fluctuations. It is overlaid on a series of vertical bars, alternating in black and white, representing discrete data values. The grid lines behind the charts suggest a data analysis or financial context. This graphic is ideal for presentations, reports, and websites related to statistics, business growth, market trends, and data visualization.
Free with trial This flat vector illustration depicts a rectangular screen displaying a red line graph with a downward pointing arrow. The design uses a clean, minimalist aesthetic with soft pastel background tones and bold outlines. It represents concepts of financial decline, market loss, or negative economic performance in a professional business context. Decrease graph symbol vectors A digital icon showing a red downward trend arrow on a screen. This flat vector illustration depicts a rectangular screen displaying a red line graph with a downward pointing arrow. The design uses a clean, minimalist aesthetic with soft pastel background tones and bold outlines. It represents concepts of financial decline, market loss, or negative economic performance in a professional business context
Free with trial A striking 3D rendering showcases a red bar chart dramatically illustrating an economic downturn and financial decline. The downward trending bar chart, emphasized by a prominent red color and a downward-pointing arrow, conveys a sense of decrease and loss within business, finance, and the global economy. This graphic effectively represents concepts such as recession, a bearish market, and. Decrease graph symbol illustrations Red bar chart depicting economic downturn or financial decline business and investment concerns. A striking 3D rendering showcases a red bar chart dramatically illustrating an economic downturn and financial decline. The downward trending bar chart, emphasized by a prominent red color and a downward-pointing arrow, conveys a sense of decrease and loss within business, finance, and the global economy. This graphic effectively represents concepts such as recession, a bearish market, and
Free with trial A dark fuel container featuring a bold red arrow pointing downward, set against a soft-focused graph indicating financial decline and market instability. Decrease graph symbol illustrations Black fuel barrel with red downward arrow symbolizing a significant drop in oil prices against a blurred financial chart. A dark fuel container featuring a bold red arrow pointing downward, set against a soft-focused graph indicating financial decline and market instability
Free with trial A 3D rendered red arrow pointing downwards, mounted on a gray circular base, isolated on a white background. The image conveys a sense of decline, decrease, or downward trend, making it suitable for various graphic design and presentation purposes. Decrease graph symbol illustrations Red Arrow Down Icon on Gray Base. A 3D rendered red arrow pointing downwards, mounted on a gray circular base, isolated on a white background. The image conveys a sense of decline, decrease, or downward trend, making it suitable for various graphic design and presentation purposes.
Free with trial A simple yet effective graphic representing a negative trend or declining business chart, perfect for illustrating downward data or economic downturn. Decrease graph symbol vectors Negative Trend Graph, Decreasing Business Chart, Downward Data Illustration. A simple yet effective graphic representing a negative trend or declining business chart, perfect for illustrating downward data or economic downturn.
Free with trial This minimalist graphic illustration features a bold red line chart indicating a significant decline. The visual composition uses a clean white background to emphasize the downward trajectory of the data points. The aesthetic is professional and modern, suitable for business presentations or financial reports. Decrease graph symbol vectors A red line graph showing a downward trend on a white background. This minimalist graphic illustration features a bold red line chart indicating a significant decline. The visual composition uses a clean white background to emphasize the downward trajectory of the data points. The aesthetic is professional and modern, suitable for business presentations or financial reports
Free with trial A simple flat icon vector illustration of two hands adjusting a simple chart with a downturn arrow, symbolizing risk mitigation in a business setting. The simple chart with a downturn arrow is orange with dark gray elements, indicating loss control. White background. Minimalist style with sharp edges and no shadows. Orange and Gray color palette. Vector graphics with rounded corners. High. Decrease graph symbol illustrations Business Downturn Graph Two Hands Hold Downward Trend Chart. A simple flat icon vector illustration of two hands adjusting a simple chart with a downturn arrow, symbolizing risk mitigation in a business setting. The simple chart with a downturn arrow is orange with dark gray elements, indicating loss control. White background. Minimalist style with sharp edges and no shadows. Orange and Gray color palette. Vector graphics with rounded corners. High
Free with trial A grid of black and white icons depicting financial charts with rising and falling trends, magnifying glasses with download arrows, and dollar signs. Decrease graph symbol vectors Collection of black and white icons representing financial charts and data analysis graph bar chart. A grid of black and white icons depicting financial charts with rising and falling trends, magnifying glasses with download arrows, and dollar signs
Free with trial Two three-dimensional orange arrows are positioned side-by-side against a clean white background. One arrow points directly upwards, while the other points directly downwards, symbolizing opposite directions or concepts like increase and decrease, or progress and decline. Decrease graph symbol illustrations Orange Up and Down Arrows on White Background up arrow direction. Two three-dimensional orange arrows are positioned side-by-side against a clean white background. One arrow points directly upwards, while the other points directly downwards, symbolizing opposite directions or concepts like increase and decrease, or progress and decline
Free with trial A vivid red zigzag arrow is depicted, pointing downwards, symbolizing a decline or decrease. Decrease graph symbol illustrations Red zigzag arrow pointing downwards. A vivid red zigzag arrow is depicted, pointing downwards, symbolizing a decline or decrease
Free with trial A 3D rendered image of a descending bar chart with teal and gray bars, each progressively lower than the previous, representing a financial or economic downturn. A bold red arrow slants downward across the bars, symbolizing decline. The graph is displayed against a dark background with white grid lines and axis labels, evoking a business or stock market concept. Isolated on a clean, dark surface. Decrease graph symbol illustrations 3D rendered bar chart with red arrow showing financial decline. A 3D rendered image of a descending bar chart with teal and gray bars, each progressively lower than the previous, representing a financial or economic downturn. A bold red arrow slants downward across the bars, symbolizing decline. The graph is displayed against a dark background with white grid lines and axis labels, evoking a business or stock market concept. Isolated on a clean, dark surface.
Free with trial A glossy, three-dimensional red arrow curves downwards, casting a subtle shadow on a clean white background. The arrow's sharp point indicates a direction of descent, making it a versatile visual metaphor for concepts like decline, loss, or negative trends. Its vibrant color and sleek design make it stand out, suitable for use in presentations, infographics, or financial reports. Decrease graph symbol illustrations Red arrow pointing downwards symbolizing a decrease or decline. A glossy, three-dimensional red arrow curves downwards, casting a subtle shadow on a clean white background. The arrow's sharp point indicates a direction of descent, making it a versatile visual metaphor for concepts like decline, loss, or negative trends. Its vibrant color and sleek design make it stand out, suitable for use in presentations, infographics, or financial reports
Free with trial Red zigzag arrow pointing downwards, symbolizing financial market decline. Decrease graph symbol vectors Red Downward Trend Graph Arrow. Red zigzag arrow pointing downwards, symbolizing financial market decline
Free with trial This minimalist vector illustration depicts a human hand holding a pen, actively drawing a downward-trending bar graph. The composition features a clean, flat design style with a neutral white background, emphasizing the red and grey bars. The visual mood is professional and analytical, representing concepts of financial loss, market decline, or negative performance metrics. Decrease graph symbol vectors A hand uses a pen to draw a declining bar chart on a white background. This minimalist vector illustration depicts a human hand holding a pen, actively drawing a downward-trending bar graph. The composition features a clean, flat design style with a neutral white background, emphasizing the red and grey bars. The visual mood is professional and analytical, representing concepts of financial loss, market decline, or negative performance metrics
Free with trial An illustration featuring two large arrows on a grid background. A green arrow curves upward to the right, symbolizing growth or increase, while a red arrow curves downward to the right, indicating decline or decrease. The contrasting arrows convey opposing trends or directions. Decrease graph symbol illustrations Contrasting Arrows on Grid Background. An illustration featuring two large arrows on a grid background. A green arrow curves upward to the right, symbolizing growth or increase, while a red arrow curves downward to the right, indicating decline or decrease. The contrasting arrows convey opposing trends or directions.
Free with trial Digital dollar symbol overlaid on red candlestick chart with sell signals on dark background. Concept of market crash and financial downturn. 3D Rendering. Decrease graph symbol illustrations Digital dollar sign with red stock market candlestick chart showing financial crisis and price drop on dark background. 3D. Digital dollar symbol overlaid on red candlestick chart with sell signals on dark background. Concept of market crash and financial downturn. 3D Rendering
Free with trial This minimalist vector illustration depicts a financial chart with a bold red arrow pointing downwards, symbolizing a significant decline or loss. The graphic features clean lines and a simple aesthetic, emphasizing the negative movement of the data points. The stark contrast between the red elements and the plain background makes it an effective visual for concepts related to economic downturns,. Decrease graph symbol vectors A red line graph showing a sharp downward trend on a white background. This minimalist vector illustration depicts a financial chart with a bold red arrow pointing downwards, symbolizing a significant decline or loss. The graphic features clean lines and a simple aesthetic, emphasizing the negative movement of the data points. The stark contrast between the red elements and the plain background makes it an effective visual for concepts related to economic downturns,
Free with trial A vibrant red arrow curves and points downwards against a clean white background. This 3D rendered illustration conveys the concept of decline, decrease, or downward trend. Its clean design makes it suitable for a variety of applications, including business presentations, financial reports, and data visualizations. The image is versatile and can be used to represent negative growth, falling prices, or other downward movements. Decrease graph symbol illustrations Red Arrow Pointing Down - Decline Concept. A vibrant red arrow curves and points downwards against a clean white background. This 3D rendered illustration conveys the concept of decline, decrease, or downward trend. Its clean design makes it suitable for a variety of applications, including business presentations, financial reports, and data visualizations. The image is versatile and can be used to represent negative growth, falling prices, or other downward movements.
Free with trial This minimalist graphic illustration features a bold red line chart indicating a significant decline. The visual composition uses clean lines and a flat design aesthetic to represent negative growth or financial loss. The stark contrast between the vibrant red color and the neutral background emphasizes the downward trajectory of the data points. Decrease graph symbol vectors A red line graph showing a downward trend on a plain white background. This minimalist graphic illustration features a bold red line chart indicating a significant decline. The visual composition uses clean lines and a flat design aesthetic to represent negative growth or financial loss. The stark contrast between the vibrant red color and the neutral background emphasizes the downward trajectory of the data points
Free with trial This graphic illustration depicts a declining financial trend using a bar chart and a line graph. The visual features red bars decreasing in height alongside a red line pointing downward, symbolizing economic loss or market contraction. Various currency symbols are positioned near arrows to emphasize the negative movement against a dark background. Decrease graph symbol vectors A financial chart showing a downward trend with red bars and arrows. This graphic illustration depicts a declining financial trend using a bar chart and a line graph. The visual features red bars decreasing in height alongside a red line pointing downward, symbolizing economic loss or market contraction. Various currency symbols are positioned near arrows to emphasize the negative movement against a dark background
Free with trial A bold, three-dimensional blue arrow is depicted pointing downwards and to the right, indicating a downward trend. The arrow has a sharp, angular design, suggesting a sharp decline or a significant drop. It is presented in isolation against a clean white background, making it a clear and direct visual representation of negative movement, loss, or a declining trend in various contexts such as. Decrease graph symbol illustrations Blue downward trending arrow on white background decline decrease. A bold, three-dimensional blue arrow is depicted pointing downwards and to the right, indicating a downward trend. The arrow has a sharp, angular design, suggesting a sharp decline or a significant drop. It is presented in isolation against a clean white background, making it a clear and direct visual representation of negative movement, loss, or a declining trend in various contexts such as
Free with trial A polished, metallic golden arrow is depicted curving downwards against a clean white background. The arrow has a sharp point and a smooth, reflective surface, suggesting a concept of decline, decrease, or a negative trend. Its isolated presentation makes it suitable for representing financial or economic downturns. Decrease graph symbol illustrations Shiny golden arrow curving downwards on a white background metallic. A polished, metallic golden arrow is depicted curving downwards against a clean white background. The arrow has a sharp point and a smooth, reflective surface, suggesting a concept of decline, decrease, or a negative trend. Its isolated presentation makes it suitable for representing financial or economic downturns
Free with trial A red arrow dramatically points downward on a flip chart displaying a sharply declining sales graph in a modern office setting. The image symbolizes business downturn, financial loss, and market recession. Ideal for illustrating negative trends, economic crisis, and failed business strategies, generated by AI. Decrease graph symbol illustrations Decreasing sales chart on flip chart in office. A red arrow dramatically points downward on a flip chart displaying a sharply declining sales graph in a modern office setting. The image symbolizes business downturn, financial loss, and market recession. Ideal for illustrating negative trends, economic crisis, and failed business strategies, generated by AI.
Free with trial Red arrow pointing down, falling concept of loss market crash, falling red arrow indicating a decrease in value, big red arrow going down, business loss financial decline economic fall recession. Decrease graph symbol vectors Red arrow pointing down, falling concept of loss market crash. Red arrow pointing down, falling concept of loss market crash, falling red arrow indicating a decrease in value, big red arrow going down, business loss financial decline economic fall recession.
Free with trial This 3D illustration features a vertical bar graph with columns of varying heights, indicating a clear decline in performance. Bright red arrows point downward, emphasizing the negative trend and loss of value. The clean, minimalist design uses a simple color palette against a neutral background, making it ideal for financial or business presentations. Decrease graph symbol vectors A three dimensional bar chart showing a downward trend with red arrows. This 3D illustration features a vertical bar graph with columns of varying heights, indicating a clear decline in performance. Bright red arrows point downward, emphasizing the negative trend and loss of value. The clean, minimalist design uses a simple color palette against a neutral background, making it ideal for financial or business presentations
Free with trial Red warning sign with white downward zigzag arrow hangs inside modern office building. Symbol indicates financial crisis, market decline, economic recession investment risk. Blurred. Decrease graph symbol illustrations Red warning sign with white downward zigzag arrow hangs inside modern office building. Symbol indicates financial crisis, market
Free with trial A clean and minimalist vector icon featuring a black zigzag line, universally recognized as a heartbeat or pulse graph. Set against a stark white background and framed by a black border, this graphic effectively symbolizes vital signs, medical monitoring, data fluctuation, or energy signals. Its simple, high-contrast design makes it versatile for healthcare applications, financial charts, technology interfaces, infographics, and any project requiring a clear representation of rhythm, change, or status. Decrease graph symbol vectors Minimalist Heartbeat Pulse Line Icon Vector. A clean and minimalist vector icon featuring a black zigzag line, universally recognized as a heartbeat or pulse graph. Set against a stark white background and framed by a black border, this graphic effectively symbolizes vital signs, medical monitoring, data fluctuation, or energy signals. Its simple, high-contrast design makes it versatile for healthcare applications, financial charts, technology interfaces, infographics, and any project requiring a clear representation of rhythm, change, or status.
Free with trial This minimalist graphic illustration depicts a red line chart trending sharply downward against a neutral background. Several small downward-pointing arrows and currency symbols are scattered below the line, emphasizing a negative economic trajectory. The clean, flat design uses a high-contrast color palette to clearly communicate concepts of loss, recession, or market decline. Decrease graph symbol vectors A red line graph showing a sharp downward trend in financial performance. This minimalist graphic illustration depicts a red line chart trending sharply downward against a neutral background. Several small downward-pointing arrows and currency symbols are scattered below the line, emphasizing a negative economic trajectory. The clean, flat design uses a high-contrast color palette to clearly communicate concepts of loss, recession, or market decline
Free with trial A vibrant collection of illustrated financial icons, including money, a piggy bank, a bank building, a safe, and a downward trend graph, perfect for finance-related projects. Decrease graph symbol vectors Playful Financial Icons Set: Savings, Banking, and Investment Concepts. A vibrant collection of illustrated financial icons, including money, a piggy bank, a bank building, a safe, and a downward trend graph, perfect for finance-related projects.
Free with trial This vibrant vector illustration showcases a collection of red and orange gradient arrows, all pointing downwards. The set includes both straight and dynamically curved arrows, effectively symbolizing various forms of decline, decrease, or negative trends. Perfect for use in business presentations, financial reports, infographics, or any design requiring a clear visual representation of falling statistics, market drops, recession, loss, or a general downward movement. The clean, modern flat design ensures versatility and impact. Decrease graph symbol vectors Downward Trend Red Gradient Arrows Vector Set. This vibrant vector illustration showcases a collection of red and orange gradient arrows, all pointing downwards. The set includes both straight and dynamically curved arrows, effectively symbolizing various forms of decline, decrease, or negative trends. Perfect for use in business presentations, financial reports, infographics, or any design requiring a clear visual representation of falling statistics, market drops, recession, loss, or a general downward movement. The clean, modern flat design ensures versatility and impact.
Free with trial A graphic illustration features several bold red arrows descending vertically against a clean white background. The arrows vary slightly in size and spacing, creating a sense of movement and direction. Abstract geometric shapes, including small squares and circles, along with dashed lines, are interspersed around the arrows, adding a modern, stylized aesthetic. The overall visual conveys a concept. Decrease graph symbol vectors Multiple red arrows pointing downwards indicating a decline or decrease. A graphic illustration features several bold red arrows descending vertically against a clean white background. The arrows vary slightly in size and spacing, creating a sense of movement and direction. Abstract geometric shapes, including small squares and circles, along with dashed lines, are interspersed around the arrows, adding a modern, stylized aesthetic. The overall visual conveys a concept
Free with trial This minimalist graphic features a bold red line forming a downward-pointing arrow shape. The design is clean and flat, set against a solid white background to emphasize the negative trend. It serves as a clear visual representation of financial loss, market decline, or decreasing performance metrics. Decrease graph symbol vectors A simple red line graph icon showing a downward trend on a white background. This minimalist graphic features a bold red line forming a downward-pointing arrow shape. The design is clean and flat, set against a solid white background to emphasize the negative trend. It serves as a clear visual representation of financial loss, market decline, or decreasing performance metrics
Free with trial A minimalist black icon depicting a business data chart. It features a bar graph with multiple vertical bars, overlaid by two distinct line graphs. One line graph shows an upward trend with data points, symbolizing growth and success, while the other illustrates a downward trend, representing decline or loss. This versatile vector illustration is ideal for conveying concepts related to financial analysis, market trends, business performance, statistics, and economic fluctuations. Perfect for web interfaces, presentations, reports, and infographics. Decrease graph symbol vectors Business Data Analysis Chart Icon with Trends. A minimalist black icon depicting a business data chart. It features a bar graph with multiple vertical bars, overlaid by two distinct line graphs. One line graph shows an upward trend with data points, symbolizing growth and success, while the other illustrates a downward trend, representing decline or loss. This versatile vector illustration is ideal for conveying concepts related to financial analysis, market trends, business performance, statistics, and economic fluctuations. Perfect for web interfaces, presentations, reports, and infographics.
Free with trial This graphic illustration features a red line chart plotted against a light gray grid background, indicating a consistent decline in value. Multiple downward-pointing arrows and currency symbols are integrated into the design to emphasize the negative economic movement. The overall aesthetic is clean, minimalist and professional, utilizing a high-contrast color palette to convey a sense of urgency. Decrease graph symbol vectors A red line graph showing a downward trend in financial performance metrics. This graphic illustration features a red line chart plotted against a light gray grid background, indicating a consistent decline in value. Multiple downward-pointing arrows and currency symbols are integrated into the design to emphasize the negative economic movement. The overall aesthetic is clean, minimalist and professional, utilizing a high-contrast color palette to convey a sense of urgency
Free with trial Flat vector illustration depicting a person adjusting a down-trending graph, representing economic decline or market downturn in a stylized way. Decrease graph symbol illustrations Declining Market Flat Illustration with Person and Arrow Indicating Downturn Economy. Flat vector illustration depicting a person adjusting a down-trending graph, representing economic decline or market downturn in a stylized way.
Free with trial A red arrow pointing downward in a jagged line on a white background, indicating a decline or decrease. Decrease graph symbol illustrations A red arrow pointing downward in a jagged line
Free with trial A bright red arrow curves downwards, indicating a decline or decrease, isolated on a clean white background. Decrease graph symbol illustrations Red downward arrow isolated on white background. A bright red arrow curves downwards, indicating a decline or decrease, isolated on a clean white background
Free with trial A versatile collection of flat vector icons illustrating concepts of decline, decrease, and loss. This set features various graphics, including downward-pointing arrows, negative trend line graphs, and falling bar charts in multiple colors. These symbols are perfect for representing financial crisis, economic recession, stock market crash, business failure, or any form of reduction. Ideal for use in infographics, presentations, financial reports, websites, and data visualization projects, these modern icons effectively communicate negative trends and downturns. Isolated on a white background for easy integration into any design. Decrease graph symbol illustrations Financial Decline and Recession Vector Icon Set. A versatile collection of flat vector icons illustrating concepts of decline, decrease, and loss. This set features various graphics, including downward-pointing arrows, negative trend line graphs, and falling bar charts in multiple colors. These symbols are perfect for representing financial crisis, economic recession, stock market crash, business failure, or any form of reduction. Ideal for use in infographics, presentations, financial reports, websites, and data visualization projects, these modern icons effectively communicate negative trends and downturns. Isolated on a white background for easy integration into any design.
Free with trial Red arrow going down stock icon on white background. Bankruptcy, financial market crash icon for your web site design, logo, app, UI. graph chart down trend symbol. chart going down sign. Decrease graph symbol vectors Red arrow going down stock icon on white background. Bankruptcy, financial market crash icon for your web site design. Red arrow going down stock icon on white background. Bankruptcy, financial market crash icon for your web site design, logo, app, UI. graph chart down trend symbol.chart going down sign.
Free with trial This graphic features a dynamic composition of overlapping line charts and arrows representing fluctuating economic data. Vibrant green and red lines indicate upward and downward trends, while blue nodes highlight specific data points. A stylized building icon and currency symbol are integrated into the design to signify banking and monetary concepts. The clean, flat aesthetic provides a clear. Decrease graph symbol vectors A colorful illustration showing financial growth and market decline trends. This graphic features a dynamic composition of overlapping line charts and arrows. This graphic features a dynamic composition of overlapping line charts and arrows representing fluctuating economic data. Vibrant green and red lines indicate upward and downward trends, while blue nodes highlight specific data points. A stylized building icon and currency symbol are integrated into the design to signify banking and monetary concepts. The clean, flat aesthetic provides a clear
Free with trial This minimalist vector illustration depicts a declining line chart against a clean background. The graphic features a prominent red arrow pointing downward, symbolizing a negative trend or financial loss. The composition uses a professional color palette of muted grays and a bold red accent to highlight the downward movement of the data points. Decrease graph symbol vectors A simple line graph showing a downward trend in business performance metrics. This minimalist vector illustration depicts a declining line chart against a clean background. The graphic features a prominent red arrow pointing downward, symbolizing a negative trend or financial loss. The composition uses a professional color palette of muted grays and a bold red accent to highlight the downward movement of the data points
Free with trial A shiny, transparent blue glass arrow curves downwards, pointing towards the bottom right of the frame. The arrow has a smooth, reflective surface and is rendered in 3D. It is presented on a clean white background, casting a subtle shadow. Decrease graph symbol illustrations Blue Glass Arrow Symbol Pointing Downward on White Background transparent. A shiny, transparent blue glass arrow curves downwards, pointing towards the bottom right of the frame. The arrow has a smooth, reflective surface and is rendered in 3D. It is presented on a clean white background, casting a subtle shadow
Free with trial This image features four distinct icons representing financial performance indicators. The top left icon shows a green percentage symbol with an upward arrow, indicating growth or increase. The top right icon displays a red percentage symbol with a downward arrow, symbolizing decline or decrease. The bottom left icon illustrates a series of green bar graphs, indicating positive trends or growth. Decrease graph symbol illustrations Financial performance indicators
Free with trial This graphic depicts a bar chart showing a progressive decline in values. Four vertical bars, rendered in shades of blue, decrease in height from left to right, symbolizing a reduction. Each bar is accompanied by a dark grey downward-pointing arrow, reinforcing the concept of a negative trend or decrease. The clean, minimalist composition on a white background provides a clear and easily. Decrease graph symbol vectors A bar chart illustrates a clear downward trend with multiple decreasing values. This graphic depicts a bar chart showing a progressive decline in values. Four vertical bars, rendered in shades of blue, decrease in height from left to right, symbolizing a reduction. Each bar is accompanied by a dark grey downward-pointing arrow, reinforcing the concept of a negative trend or decrease. The clean, minimalist composition on a white background provides a clear and easily
Free with trial Economic crisis icon of economy depreciation and business downturn, vector line symbol. Banking investment recession, stock exchange trade fall and money value inflation icon of financial crisis. Decrease graph symbol vectors Economic crisis icon economy business depreciation. Economic crisis icon of economy depreciation and business downturn, vector line symbol. Banking investment recession, stock exchange trade fall and money value inflation icon of financial crisis
Free with trial Financial decision and interest rate change concept, wooden blocks showing percentage symbol with green upward and red downward arrows. Decrease graph symbol illustrations Financial decision and interest rate change concept
Free with trial Financial decision and interest rate change concept, wooden blocks showing percentage symbol with green upward and red downward arrows. Decrease graph symbol illustrations Financial decision and interest rate change concept
Free with trial Financial decision and interest rate change concept, wooden blocks showing percentage symbol with green upward and red downward arrows. Decrease graph symbol illustrations Financial decision and interest rate change concept
Free with trial Financial decision and interest rate change concept, wooden blocks showing percentage symbol with green upward and red downward arrows. Decrease graph symbol illustrations Financial decision and interest rate change concept
Free with trial Unemployment line icon of unemployed man on labor market, vector symbol. Economic crisis, global financial downturn and bankruptcy icon of economy recession and unemployment problem. Decrease graph symbol vectors Unemployment line icon, economic financial crisis. Unemployment line icon of unemployed man on labor market, vector symbol. Economic crisis, global financial downturn and bankruptcy icon of economy recession and unemployment problem
Free with trial A large, three-dimensional arrow constructed from yellow wooden planks is depicted pointing downwards against a clean white background. The arrow has a sharp, defined shape, with visible wood grain and panel lines, suggesting a concept of decline, decrease, or a negative trend. Decrease graph symbol illustrations Large Yellow Wooden Arrow Pointing Downward on a White Background image photo. A large, three-dimensional arrow constructed from yellow wooden planks is depicted pointing downwards against a clean white background. The arrow has a sharp, defined shape, with visible wood grain and panel lines, suggesting a concept of decline, decrease, or a negative trend
Free with trial Symbolic representation of negative financial trends. Red and green arrows pointing downwards, signifying market downturn, loss, or reduction in value. Decrease graph symbol vectors Red and green down arrows symbolizing decrease and loss. Symbolic representation of negative financial trends. Red and green arrows pointing downwards, signifying market downturn, loss, or reduction in value
Free with trial Set of six black percent symbols combined with up and down arrows in flat vector style representing increase decrease and adjustment concepts. Generative AI. Decrease graph symbol vectors Black percent symbols with up and down arrows flat vector icons. Set of six black percent symbols combined with up and down arrows in flat vector style representing increase decrease and adjustment concepts. Generative AI
Free with trial This minimalist graphic illustration features a bold red line chart trending downwards against a clean background. Several small downward-pointing arrows are positioned along the slope to emphasize the decline. The composition uses a flat design aesthetic with high contrast, conveying a clear message of loss, reduction, or negative performance in a professional context. Decrease graph symbol vectors A red line graph showing a sharp downward trend with multiple directional arrows. This minimalist graphic illustration features a bold red line chart trending downwards against a clean background. Several small downward-pointing arrows are positioned along the slope to emphasize the decline. The composition uses a flat design aesthetic with high contrast, conveying a clear message of loss, reduction, or negative performance in a professional context
Free with trial A simple line icon of a computer screen displaying a jagged downward arrow, symbolizing financial loss, economic downturn, business failure, or a decrease in performance. Decrease graph symbol vectors Downward trend arrow on computer monitor screen icon. A simple line icon of a computer screen displaying a jagged downward arrow, symbolizing financial loss, economic downturn, business failure, or a decrease in performance
Free with trial The image features a striking red downward arrow with a jagged, zigzag pattern. The arrow is bold and prominent, indicating a significant decline or decrease in a clear and impactful manner. Decrease graph symbol illustrations A bold red downward arrow with a jagged, zigzag pattern. The image features a striking red downward arrow with a jagged, zigzag pattern. The arrow is bold and prominent, indicating a significant decline or decrease in a clear and impactful manner
Free with trial Three blue apple icons are depicted. The top apple stands alone, and the two below have arrows beside them. The left apple has a downward arrow, indicating a decrease, while the right apple is paired with an upward arrow, suggesting an increase. Each apple is solid blue with a small leaf, symbolizing fruit-related data or trends. The arrangement is simple and symmetrical on a white background, with the icons representing changes in quantity or direction. Decrease graph symbol vectors Apples with up and down arrows with fruit icon with directional arrows. Three blue apple icons are depicted. The top apple stands alone, and the two below have arrows beside them. The left apple has a downward arrow, indicating a decrease, while the right apple is paired with an upward arrow, suggesting an increase. Each apple is solid blue with a small leaf, symbolizing fruit-related data or trends. The arrangement is simple and symmetrical on a white background, with the icons representing changes in quantity or direction.
Free with trial This image features a series of red downward arrows, each containing a percentage symbol. The arrows are evenly spaced and all point downward, indicating a consistent direction. Decrease graph symbol illustrations Series of red downward arrows with percentage symbols. This image features a series of red downward arrows, each containing a percentage symbol. The arrows are evenly spaced and all point downward, indicating a consistent direction
Free with trial A colorful, hand-drawn illustration depicting a large percentage symbol surrounded by various financial and statistical icons. This doodle-style artwork includes bar graphs, pie charts, stacks of coins, dollar signs, and arrows indicating growth and decline. The sketch effectively visualizes concepts like interest rates, economic trends, business analytics, investment returns, and market data. Isolated on a white background, this versatile image is perfect for presentations, infographics, financial reports, and educational materials related to business, finance, and statistics. Decrease graph symbol illustrations Hand Drawn Finance and Percentage Concept Illustration. A colorful, hand-drawn illustration depicting a large percentage symbol surrounded by various financial and statistical icons. This doodle-style artwork includes bar graphs, pie charts, stacks of coins, dollar signs, and arrows indicating growth and decline. The sketch effectively visualizes concepts like interest rates, economic trends, business analytics, investment returns, and market data. Isolated on a white background, this versatile image is perfect for presentations, infographics, financial reports, and educational materials related to business, finance, and statistics.
Free with trial Economic crisis line icon of savings depreciation, economy downturn and bankruptcy, vector symbol. Banking business and money savings depreciation icon of piggy bank and arrow down of financial crisis. Decrease graph symbol vectors Economic crisis line icon of savings depreciation
Free with trial A chart showing a decrease with an arrow pointing down, isolated on a white background, representing a decline in data or performance. Decrease graph symbol illustrations Decreasing chart with arrow isolated on white background. A chart showing a decrease with an arrow pointing down, isolated on a white background, representing a decline in data or performance
Free with trial A 3D render of a red thermometer with a white liquid column indicating a low temperature, positioned next to a blue square icon featuring three white downward-pointing arrows. The objects are isolated on a clean white background, suggesting a concept of decreasing temperature or a negative trend. Decrease graph symbol illustrations Red Thermometer Icon With Down Arrow Symbol On White Background temperature cold. A 3D render of a red thermometer with a white liquid column indicating a low temperature, positioned next to a blue square icon featuring three white downward-pointing arrows. The objects are isolated on a clean white background, suggesting a concept of decreasing temperature or a negative trend
Free with trial Conceptual image depicting the decline of the music industry. Decrease graph symbol illustrations Music Industry Decline Magnifying Glass, Graph, Note Icon. Conceptual image depicting the decline of the music industry.
Free with trial Up Down Arrow Icon Scale Arrowhead Point Pointer Lift Elevator Accend Decend Upload Download Shape Outline Vector Graphic Progress Bar Graph Black Line. Decrease graph symbol vectors Up Down Arrow Icon Scale Arrowhead Point Pointer Lift Elevator Accend Decend Upload Download Shape Outline Vector Graphic Progress