Free with trial Percentage arrow down vector icon. filled flat sign for mobile concept and web design. Discount arrow simple solid icon. Symbol, logo illustration. Pixel perfect vector graphics. Decrease illustration vectors Percentage arrow down vector icon
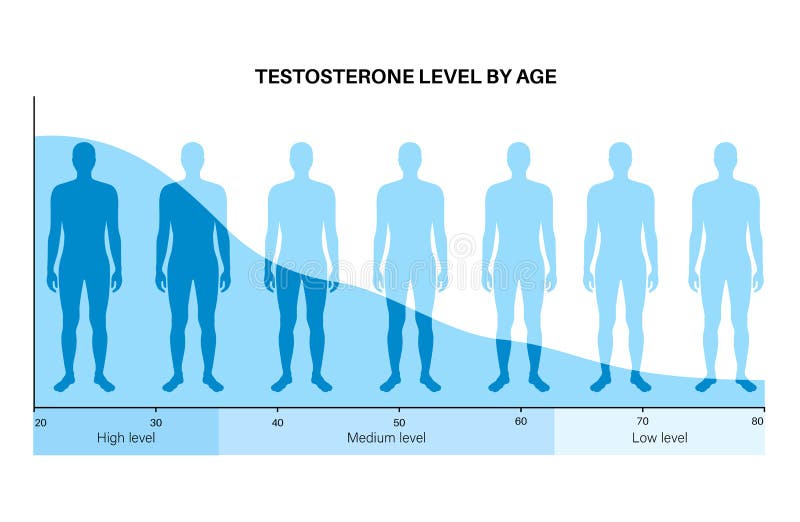
Free with trial Testosterone level color chart. Sex hormone production by age, isolated flat vector infographic. Diagram with low and high balance of hormones in male body. Adult man silhouette medical illustration. Decrease illustration vectors Testosterone level chart. Testosterone level color chart. Sex hormone production by age, isolated flat vector infographic. Diagram with low and high balance of hormones in male body. Adult man silhouette medical illustration
Free with trial Chemical molecular formula of the hormone estradiol. Female sex hormone. Decrease and increase of estradiol. Infographics Vector illustration. Decrease illustration illustrations Chemical molecular formula of the hormone estradiol. Female sex hormone. Decrease and increase of estradiol. Infographics Vector i
Free with trial Secure Shopping Online during Covid19 Pandemic and Coronavirus Quarantine. Clothes Purchase Distantly to Prevent and Decrease Virus Infection Risk. Shop Assistant Courier in Facemask, Protective Glove. Decrease illustration vectors Secure Shopping Online during Covid19 Pandemic
Free with trial 3D render illustration of the concept of governmental fiscal relaxation cutting taxes. The composition is isolated on a white background with shadows. Decrease illustration illustrations Governmental fiscal relaxation
Free with trial Up and Down with Arrows Typography. vector illustration. Decrease illustration vectors Up and Down with Arrows Typography.
Free with trial A computer generated illustration image of a three dimensional view of a chart with colorful bars against a white backdrop. Decrease illustration illustrations A three dimensional view of a chart with colorful bars
Free with trial Buy 2 Get 1 Free 12569 × 5000 pixel Banner Vector Illustration. Decrease illustration vectors Buy 2 Get 1 Free 12569 × 5000 pixel Banner Vector
Free with trial Water preservation to save wildlife and fresh water outline hands concept. Drinkable liquid conservation with sustainable and environmental practices vector illustration. Clean water awareness. Decrease illustration vectors Water preservation to save wildlife and fresh water outline hands concept
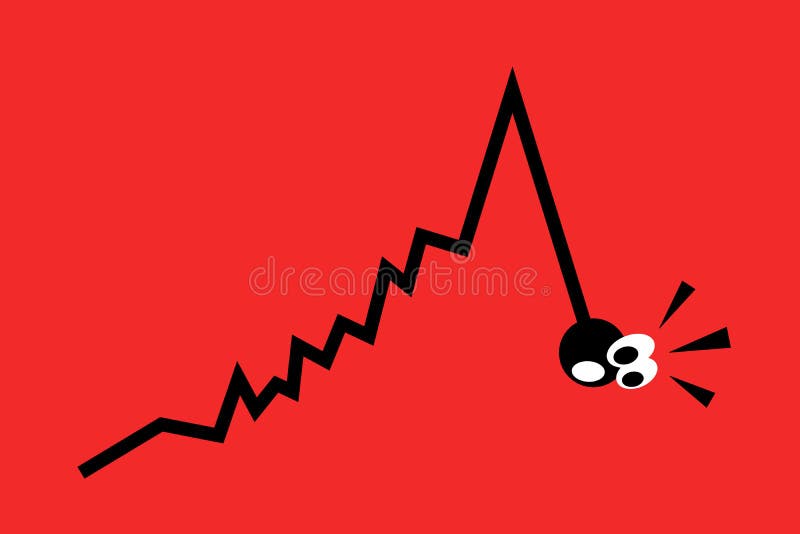
Free with trial Chart is going up and then is falling down - downfall, donwgrade and decline of value. Negative comic and cartoon expression of fright and threat. Vector illustration. Decrease illustration vectors Fall and downfall of chart and diagram. Chart is going up and then is falling down - downfall, donwgrade and decline of value. Negative comic and cartoon expression of fright and threat. Vector illustration
Free with trial Green and red 3D glossy arrow with shines and shadow - vector illustration. Decrease illustration vectors Green and red 3D glossy arrow
Free with trial Joint pain from infected or injury female body. A girl running vector illustration. Decrease illustration vectors Joint pain from infected or injury female body
Free with trial Digital illustration of graph in colour background. Decrease illustration illustrations Graph
Free with trial Digital illustration of graph in colour background. Decrease illustration illustrations Graph
Free with trial Businessman On Falling red down graph - illustration. Decrease illustration vectors Businessman On Falling red down graph -
Free with trial Set Woman practicing yoga poses for back pain relief. Flat vector cartoon illustration. Decrease illustration vectors Set 6 yoga poses for back pain relief. Set Woman practicing yoga poses for back pain relief. Flat vector cartoon illustration
Free with trial Modern non volatile autonomous house with a lawn and a swimming pool. Vector isometric illustration. Decrease illustration vectors Modern non volatile autonomous house. Modern non volatile autonomous house with a lawn and a swimming pool. Vector isometric illustration.
Free with trial Stock market app on mobile phone. Investors, traders analyzing chart, candle bars, candlestick graph, investing money with smartphone application. Flat vector illustration isolated on white background. Decrease illustration vectors Stock market app on mobile phone. Investors, traders analyzing chart, candle bars, candlestick graph, investing money
Free with trial Carbon capture and CO2 toxic emission storage underground outline concept. Sustainable dioxide collection and catching control for pollution reduction and smoke effect removal vector illustration. Decrease illustration vectors Carbon capture and CO2 toxic emission storage underground outline concept
Free with trial Oil price fall graph with red down arrow. vector illustration. Decrease illustration vectors Oil price fall graph with red down arrow
Free with trial Testosterone level by age as hormone production reduction outline diagram. Labeled educational measurement scheme with age and amount axis vector illustration. Libido and sexual health stages by aging. Decrease illustration vectors Testosterone level by age and hormone production reduction outline diagram. Testosterone level by age as hormone production reduction outline diagram. Labeled educational measurement scheme with age and amount axis vector illustration. Libido and sexual health stages by aging
Free with trial Two broken trend lines with arrows are going up and down, 3d illustration with cloudy sky photo background. Decrease illustration illustrations Two trend lines with arrows are going up and down. Two broken trend lines with arrows are going up and down, 3d illustration with cloudy sky photo background
Free with trial A scared businessman standing in a sinking boat and asking for help on the background of arrows moving down vector flat design illustration. Square layout. Decrease illustration vectors Businessman standing in sinking boat. A scared businessman standing in a sinking boat and asking for help on the background of arrows moving down vector flat design illustration. Square layout.
Free with trial One continuous line drawing of young male employee get call from his manager and asking to explain sales dropped. Sales decrease problem concept single line draw design vector illustration. Decrease illustration illustrations One continuous line drawing of young male employee get call from his manager and asking to explain sales dropped
Free with trial Computer screens with green and red 3D arrow and abstract business background - on white. Vector illustration. Decrease illustration vectors Computer screens with green and red 3D arrow
Free with trial Bankruptcy and Financial Crisis Website Landing Page Set. Businesspeople Trying to Rise Up Decline Red Arrow. Management Failed Achieve Profit, Risk Web Page Banner. Cartoon Flat Vector Illustration. Decrease illustration vectors Bankruptcy and Financial Crisis Website Landing Page Set. Businesspeople Trying to Rise Up Decline Red Arrow
Free with trial A black businessman with falling down chart is confused. Bankruptcy concept. Vector line design illustration. Horizontal layout with a text space. Decrease illustration vectors Bankruptcy
Free with trial Abstract chart with 3D glossy red arrow - vector illustration. Decrease illustration vectors Abstract chart with 3D glossy red arrow
Free with trial Bankrupt concept. People trying to keep downward financial trend arrow economic risk crisis, money lost business vector. Financial arrow increase, turnover orientation way after downward illustration. Decrease illustration vectors Bankrupt concept. People trying to keep downward financial trend arrow economic risk and crisis, money lost business. Bankrupt concept. People trying to keep downward financial trend arrow economic risk crisis, money lost business vector. Financial arrow increase, turnover orientation way after downward illustration
Free with trial Business Man Falling In Cliff Gap Problem Finance Bankruptcy Concept Flat Vector Illustration. Decrease illustration vectors Business Man Falling In Cliff Gap Problem Finance Bankruptcy Concept
Free with trial Summer sale letter in round grunge orange circle vector illustration. Decrease illustration vectors Summer sale letter in round grunge orange circle vector illustration
Free with trial Dollar coin running fast. Money, finance, currency, economic, savings, investment, exchange rate, panic, crisis and rallying concept. EPS 8 vector illustration, no transparency. Decrease illustration vectors Dollar coin running
Free with trial Modern vector illustration of world financial crisis. Oil price drop. ollapse of the economy. Bankruptcy. Down arrow stocks graph. Helping in financial crisis. Stock Market - Arrow Graph Going Down. Decrease illustration vectors Modern vector illustration of world financial crisis. Oil price drop. ollapse of the economy. Bankruptcy. Down arrow. Modern vector illustration of world financial crisis. Oil price drop. ollapse of the economy. Bankruptcy. Down arrow stocks graph. Helping in financial crisis. Stock Market - Arrow Graph Going Down
Free with trial Multicolor glossy bar chart showing decrease, with two black axis, standing on gray background, front view. Decrease illustration illustrations Bar chart with axis. Multicolor glossy bar chart showing decrease, with two black axis, standing on gray background, front view
Free with trial Ozone layer degradation is one of the most acute global environmental problems. Sketch style drawing isolated on a white background. EPS10 vector illustration. Decrease illustration vectors Ozone layer degradation is one of the most acute global environmental problems. Sketch style drawing isolated on a white
Free with trial The chemical molecular formula of the hormone testosterone. Male sex hormone. Decrease and increase of testosterone. Infographics Vector illustration. Decrease illustration illustrations The chemical molecular formula of the hormone testosterone. Male sex hormone. Decrease and increase of testosterone. Infographics
Free with trial Timeline chart infographic template elements. Flat vector illustration of business development steps. Isolated infographics arrow symbols for web, internet, print, presentations, social networks. Decrease illustration vectors Timeline infographic vector template elements. Business development steps arrows chart. Timeline chart infographic template elements. Flat vector illustration of business development steps. Isolated infographics arrow symbols for web, internet, print, presentations, social networks.
Free with trial Line arrows up and down. Vector illustration. Decrease illustration vectors Arrows up and down
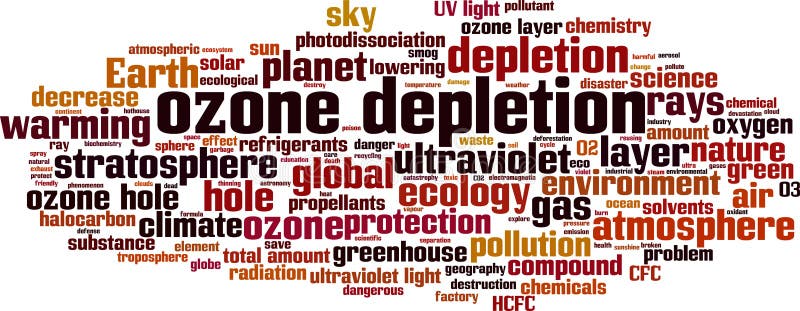
Free with trial Ozone depletion word cloud concept. Collage made of words about ozone depletion. Vector illustration. Decrease illustration vectors Ozone depletion word cloud
Free with trial Vector Cartoon illustration of comet with golden bitcoin symbol flying in open galaxy space. Bitcoin falling going down. Decrease illustration vectors Vector Cartoon illustration of comet with golden bitcoin symbol flying in open galaxy space. Bitcoin falling going down.
Free with trial Tractor and negative chart - agriculture / farming as descending and decreasing industry. Problem and troubles of agricultural farmers. Vector illustration. Decrease illustration vectors Agriculture / farming as descending and decreasing industry
Free with trial Falling Red Arrow Chart on White Background 3D Illustration. Decrease illustration illustrations Falling Arrow Chart. Falling Red Arrow Chart on White Background 3D Illustration
Free with trial Business man standing in sinking boat and asking for help. Business man sinking and arrows behind his pointing down symbolizing business bankruptcy. Vector flat design illustration. Square layout. Decrease illustration vectors Business man standing in sinking boat. Business man standing in sinking boat and asking for help. Business man sinking and arrows behind his pointing down symbolizing business bankruptcy. Vector flat design illustration. Square layout.
Free with trial Bitcoin bubble burst or decline of the bitcoin currency. Hand pricking or bursting bitcoin balloon with a needle. vector illustration. Decrease illustration vectors Bitcoin bubble burst or decline of the bitcoin currency
Free with trial Substantia nigra in norm and in Parkinson`s disease, 3D illustration showing decrease of its volume. There is degeneration of dopaminergic neurons in the pars compacta of the substantia nigra. Decrease illustration illustrations Substantia nigra in norm and in Parkinson`s disease
Free with trial Business woman refuses to listen to colleagues expressing critical opinions that cause decrease in motivation. Confident girl stands with earplugs to avoid attempts to impose critical opinion. Decrease illustration vectors Woman refuses to listen to colleagues expressing critical opinions that cause decrease in motivation
Free with trial Money loss concept, falling sack in hole, financial expenses, budget planning, fund downfall vector illustration. Decrease illustration vectors Licking money, financial crisis, budget management, capital drop. Money loss concept, falling sack in hole, financial expenses, budget planning, fund downfall vector illustration
Free with trial No sound icon web button - vector illustration on isolated white background with reflection shadow. Decrease illustration illustrations No sound icon button. No sound icon web button - vector illustration on isolated white background with reflection shadow
Free with trial Short selling is pulling down the value and price of stock and equity. Decreased cost and undervalue of equity on the stock market. Chart of trade speculation. Vector illustration. Decrease illustration vectors Short selling is pulling down the value and price of stock and equity
Free with trial Graph going up and down sign isolated vector illustration. Graph going up and down sign isolated vector illustration on white background. Decrease illustration vectors Graph going up and down sign isolated vector illustration. Graph going up and down sign isolated vector illustration on white background
Free with trial Increase and decrease glossy arrow icon emblems isolated on white background. Decrease illustration illustrations Increase and decrease glossy arrow icon emblems
Free with trial RISK puzzle white background concept 3D illustration. Decrease illustration illustrations RISK puzzle white background concept
Free with trial Aging word cloud concept. Vector illustration. Decrease illustration illustrations Aging word cloud
Free with trial Lose weight graphics icon. Sign reduce weight isolated on white background. Symbol of healthy lifestyle. Vector illustration. Decrease illustration vectors Lose weight graphics icon
Free with trial A black businessman with falling down chart is confused. Bankruptcy concept. Vector line design illustration. Square layout. Decrease illustration vectors Bankruptcy
Free with trial An african businessman with falling down graph is confused. Bankruptcy concept. Vector line design illustration. Horizontal layout with a text space. Decrease illustration vectors Bankruptcy
Free with trial Downsize Home Icon Means Downsizing Property Due To Retirement Or Budget. Find A Tiny House Or Apartment -. Decrease illustration illustrations Downsize Home Icon Means Downsizing Property Due To Retirement Or Budget - 3d Illustration. Downsize Home Icon Means Downsizing Property Due To Retirement Or Budget. Find A Tiny House Or Apartment -
Free with trial Birth Rate and Demographic Datum Landing Page Template. Parents and Daughter Characters Hold Hand front of Decreasing Column Chart with Baby Carriage. Cartoon People. Cartoon Vector Illustration. Decrease illustration vectors Birth Rate and Demographic Datum Landing Page Template. Parents and Daughter Characters
Free with trial The price of oil is rising. Barrels of oil, dollar and infographics with a red up arrow. Rising crude oil prices concept, vector illustration isolated on white background. Decrease illustration vectors The price of oil is rising. Barrels of oil, dollar and infographics with a red up arrow. Rising crude oil prices concept, vector
Free with trial Character with big down arrow. It represents discouragement. White background. 3D illustration. Decrease illustration illustrations Character with big down arrow.
Free with trial Cost reduction icon. Price is lower sign. Symbol of price reduction. Isolated image on white background. Vector illustration. Decrease illustration vectors Green dollar. Price reduction. Cost reduction icon. Price is lower sign. Symbol of price reduction. Isolated image on white background. Vector illustration
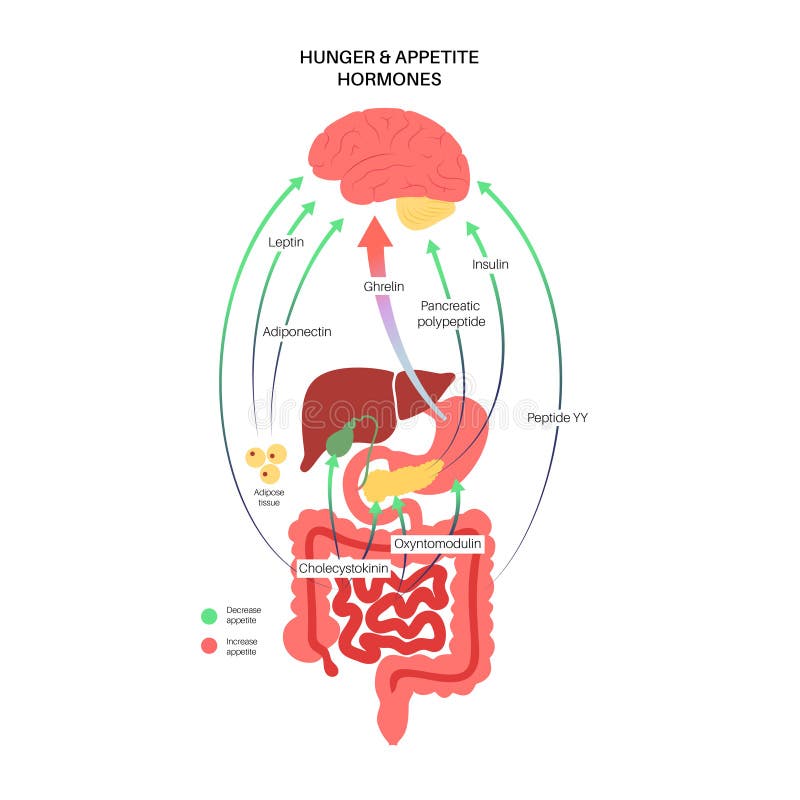
Free with trial Appetite and hunger hormones diagram. Insulin, ghrelin, incretin and leptin in the human body. Human endocrine system, metabolism. Connection between brain and internal organs flat vector illustration. Decrease illustration vectors Hunger appetite hormones. Appetite and hunger hormones diagram. Insulin, ghrelin, incretin and leptin in the human body. Human endocrine system, metabolism. Connection between brain and internal organs flat vector illustration
Free with trial Inflation concept of hamburger. Vector illustration. Decrease illustration vectors Inflation concept of hamburger
Free with trial Increasing piles of coins with going up graph. Concept for financial growth. illustration. Decrease illustration vectors Increasing piles of coins with going up graph.
Free with trial Colorful Frame With Blobs Isolated Transparent Background, Vector Illustration. Decrease illustration vectors Colorful Frame With Blobs Isolated Transparent Background
Free with trial 3d illustration, concept of economic crisis due to the coronavirus pandemic, covid 19. Decrease illustration illustrations Economic crisis due to the coronavirus pandemic, covid 19
Free with trial Black substance, basal banglia of the midbrain, in Parkinson& x27;s disease, 3D illustration showing decrease of its volume and Levy bodies inclusions in neurons in the pars compacta of black substance. Decrease illustration illustrations Substantia nigra in Parkinson& x27;s disease. Black substance, basal banglia of the midbrain, in Parkinson& x27;s disease, 3D illustration showing decrease of its volume and Levy bodies inclusions in neurons in the pars compacta of black substance
Free with trial Oral hygiene: Scaling and root planing of Periodontitis stage 2 conventional periodontal therapy. Medically accurate 3D illustration of human teeth treatment. Decrease illustration illustrations Oral hygiene: Scaling and root planing of Periodontitis stage 2 conventional periodontal therapy. Medically accurate 3D
Free with trial Crisis typography vector banner template. Economic crash and depression, global financial crisis, economic downturn, recession with high bankruptcy rate and unemployment. Decrease illustration vectors Crisis typography banner template, vector flat illustration. Crisis typography vector banner template. Economic crash and depression, global financial crisis, economic downturn, recession with high bankruptcy rate and unemployment.
Free with trial Broken trend line with arrow on the end is going down, 3d illustration with cloudy sky photo background. Decrease illustration illustrations Broken trend line with arrow on the end is going down
Free with trial Skin aging process from the 20s to the 60s, showing the decrease in collagen, elastin, and hyaluronic acid diagram hand drawn schematic vector illustration. Medical science educational illustration. Decrease illustration vectors Skin Aging Process Collagen Decline diagram. skin aging process from the 20s to the 60s, showing the decrease in collagen, elastin, and hyaluronic acid diagram hand drawn schematic vector illustration. Medical science educational illustration
Free with trial Background concept wordcloud illustration of menopause. Decrease illustration illustrations Menopause background concept. Background concept wordcloud illustration of menopause
Free with trial Green and red arrow. 3D render illustration isolated on white background. Decrease illustration illustrations Green and red arrow. 3D
Free with trial Fatigue word cloud concept. Collage made of words about fatigue. Vector illustration. Decrease illustration vectors Fatigue word cloud
Free with trial A confused asian businessman with falling down graph behind him. Bankruptcy concept. Vector line design illustration. Horizontal layout. Decrease illustration vectors Man in despair because of bankruptcy. A confused asian businessman with falling down graph behind him. Bankruptcy concept. Vector line design illustration. Horizontal layout.
Free with trial Chart graph. Black Icon growth and downward with arrow isolated on background. Hologram positive, fall percentage. Design business concept direction growth, recession. Analysis. Vector illustration. Decrease illustration vectors Chart graph. Black Icon growth and downward with arrow. Hologram positive, fall percentage. Design business. Vector illustration. Chart graph. Black Icon growth and downward with arrow isolated on background. Hologram positive, fall percentage. Design business concept direction growth, recession. Analysis. Vector illustration
Free with trial Continuous one single line drawing Business chart loss schedule icon vector illustration concept. Decrease illustration vectors One line drawing Business chart loss concept. Continuous one single line drawing Business chart loss schedule icon vector illustration concept
Free with trial Swelling of the feet and ankles from infected or injury vector illustration. Decrease illustration vectors Swelling of the feet and ankles from infected or injury
Free with trial Declining graph vector icon. Business decline chart filled flat sign for mobile concept and web design. Negative graph statistics glyph icon. Symbol, logo illustration. Vector graphics. Decrease illustration vectors Declining graph vector icon
Free with trial Business Hand Hold Placard From Hole Businessman Fail Bankruptcy Crisis Concept Flat Vector Illustration. Decrease illustration vectors Business Hand Hold Placard From Hole Businessman Fail Bankruptcy Crisis Concept