Free with trial A minimalist 3D rendered white graph depicting a sharp downward trend with jagged peaks and valleys. The graph is isolated on a white background, casting a subtle shadow. The visual represents a decline or decrease, suitable for concepts related to finance, economics, or data analysis. Decrease line illustrations White 3D Jagged Line Graph Showing Decline Isolated on White Background chart decrease. A minimalist 3D rendered white graph depicting a sharp downward trend. A minimalist 3D rendered white graph depicting a sharp downward trend with jagged peaks and valleys. The graph is isolated on a white background, casting a subtle shadow. The visual represents a decline or decrease, suitable for concepts related to finance, economics, or data analysis
Free with trial The image features a red zigzag line that starts from the top left and extends diagonally towards the bottom right. The line alternates between peaks and valleys, creating a series of sharp angles. At the end of the line, there is a downward-pointing arrow, indicating a decline or decrease. The entire image is set against a plain white background, which makes the red line and arrow stand out. Decrease line illustrations Red zigzag line with downward arrow on white background. The image features a red zigzag line that starts from the top left and extends diagonally towards the. The image features a red zigzag line that starts from the top left and extends diagonally towards the bottom right. The line alternates between peaks and valleys, creating a series of sharp angles. At the end of the line, there is a downward-pointing arrow, indicating a decline or decrease. The entire image is set against a plain white background, which makes the red line and arrow stand out
Free with trial The image depicts a combination of bar and line charts. The bar chart shows three descending bars in orange, yellow, and a lighter shade, indicating a decline in values. Overlaid on this is a downward-sloping line chart, reinforcing the trend of decrease. The overall design suggests a visual representation of a downward market trend or decline in performance metrics over time. Decrease line illustrations Graphic illustration of declining market trends with bar and line chart combination. The image depicts a combination of bar and line charts. The bar chart shows. The image depicts a combination of bar and line charts. The bar chart shows three descending bars in orange, yellow, and a lighter shade, indicating a decline in values. Overlaid on this is a downward-sloping line chart, reinforcing the trend of decrease. The overall design suggests a visual representation of a downward market trend or decline in performance metrics over time
Free with trial The image features a black and white graphic of a dollar sign within a circle, intersected by a diagonal line and accompanied by a downward-pointing arrow. The dollar sign is prominently displayed in the center, while the circle and arrow create a sense of movement and prohibition. The overall design suggests a concept related to finance, economics, or currency, possibly indicating a decrease or. Decrease line vectors A black and white image of a dollar sign with a line through it. The image features a black and white graphic of a dollar sign within a circle, intersected by a. The image features a black and white graphic of a dollar sign within a circle, intersected by a diagonal line and accompanied by a downward-pointing arrow. The dollar sign is prominently displayed in the center, while the circle and arrow create a sense of movement and prohibition. The overall design suggests a concept related to finance, economics, or currency, possibly indicating a decrease or
Free with trial World map with a red declining line graph overlay, illustrating a decrease or economic downturn. The graph features sharp declines across various data points, reflecting a downward trend. Red bar chart at the bottom represents additional numerical data against a black background. The map uses a dotted pattern for continents, highlighting regions globally. The image conveys financial analysis, market trends, or economic statistics. Decrease line illustrations World map with a red declining line graph overlay,. Illustrating a decrease or economic downturn. The graph features sharp declines across various data points. World map with a red declining line graph overlay, illustrating a decrease or economic downturn. The graph features sharp declines across various data points, reflecting a downward trend. Red bar chart at the bottom represents additional numerical data against a black background. The map uses a dotted pattern for continents, highlighting regions globally. The image conveys financial analysis, market trends, or economic statistics.
Free with trial A clear vector illustration of a declining line graph, symbolizing market downturn, economic challenges, and negative trends. Ideal for financial reports, business analysis, and risk assessment. Represents a decrease in performance and a need for strategic adjustments, vector design Generative AI. Decrease line vectors Declining Line Graph for Market Downturn and Economic Challenges, vector design Generative AI. A clear vector illustration of a declining line graph, symbolizing. A clear vector illustration of a declining line graph, symbolizing market downturn, economic challenges, and negative trends. Ideal for financial reports, business analysis, and risk assessment. Represents a decrease in performance and a need for strategic adjustments, vector design Generative AI
Free with trial Smooth, dark pebbles are arranged in a vertical line on a coarse-textured surface. They gradually decrease in size from top to bottom, surrounded by smaller pebbles scattered around them. The overall color scheme is a muted gray, providing a soothing, naturalistic appearance resembling a Zen garden or riverbed. The composition emphasizes simplicity and harmony. Decrease line illustrations Smooth, dark pebbles are arranged in a vertical line on a coarse-textured surface. They gradually decrease in size from top to bottom, surrounded by smaller
Free with trial A line graph illustrating the gradual decrease in energy consumption over several months, with lightning bolt icons transitioning to leaf icons, symbolizing a shift from high energy usage to sustainable, cost-effective practices. The x-axis represents time in months, and the y-axis shows energy consumption in kWh, clearly indicating a downward trend in energy use and associated costs. Decrease line illustrations Energy Consumption Decrease Over Time Leading to Cost Reduction. A line graph illustrating the gradual decrease in energy consumption over several months, with. A line graph illustrating the gradual decrease in energy consumption over several months, with lightning bolt icons transitioning to leaf icons, symbolizing a shift from high energy usage to sustainable, cost-effective practices. The x-axis represents time in months, and the y-axis shows energy consumption in kWh, clearly indicating a downward trend in energy use and associated costs
Free with trial A vector icon of a descending line graph on a green base, illustrating a downward trend, decrease, or decline in data. Represents financial loss, reduced performance, or negative growth. Suitable for business reports, statistical analysis, and economic presentations, vector design Generative AI. Decrease line vectors Descending Line Graph Decline Trend Chart Icon, vector design Generative AI. A vector icon of a descending line graph on a green base, illustrating a downward. A vector icon of a descending line graph on a green base, illustrating a downward trend, decrease, or decline in data. Represents financial loss, reduced performance, or negative growth. Suitable for business reports, statistical analysis, and economic presentations, vector design Generative AI
Free with trial Unexpected financial loss doodle line illustration concept. Sales decrease. Market downturn. Crying businessman beside declining bar graph 2D outline character isolated. Hand drawn metaphor monochrome. Decrease line vectors Unexpected financial loss doodle line illustration concept. Sales decrease. Market downturn. Crying businessman beside declining bar graph 2D outline character
Free with trial A horizontal line composed of black dots of varying sizes against a white background. The dots gradually increase in size towards the center, forming a focal point, and then decrease in size towards the edges, creating a subtle gradient effect. Decrease line illustrations Black dots line graphic with increasing and decreasing size dot line graphic element. A horizontal line composed of black dots of varying sizes against a white. A horizontal line composed of black dots of varying sizes against a white background. The dots gradually increase in size towards the center, forming a focal point, and then decrease in size towards the edges, creating a subtle gradient effect
Free with trial Speaker Volume Adjustment Up Down Radio Sound Adjust Dial Increase Decrease Plus Minus Black Outline Line Sign. Symbol Audio Button Control Graphic. Decrease line vectors Speaker Volume Adjustment Up Down Radio Sound Adjust Dial Increase Decrease Plus Minus Black Outline Line Sign. Symbol Audio Button Control Graphic
Free with trial The image features a bold, red zigzag line that descends diagonally from the top left to the bottom right, culminating in a pointed arrowhead. The zigzag pattern consists of sharp, connected peaks and troughs, giving it a dynamic and attention-grabbing appearance. The arrow's downward trajectory suggests a decrease, decline, or negative trend. The simple, white background ensures the red zigzag. Decrease line illustrations A red zigzag arrow pointing downwards indicates a decline or decrease. The image features a bold, red zigzag line that descends diagonally from the top left to. The image features a bold, red zigzag line that descends diagonally from the top left to the bottom right, culminating in a pointed arrowhead. The zigzag pattern consists of sharp, connected peaks and troughs, giving it a dynamic and attention-grabbing appearance. The arrow's downward trajectory suggests a decrease, decline, or negative trend. The simple, white background ensures the red zigzag
Free with trial Downward arrow with percent sign icon set. Line, solid and filled outline style. Finance symbol for decrease, loss, or declining interest icon. Decrease line vectors Arrow down percent icon set in line, solid and filled outline style. Downward arrow with percent sign icon set. Line, solid and filled outline style. Finance. Downward arrow with percent sign icon set. Line, solid and filled outline style. Finance symbol for decrease, loss, or declining interest icon.
Free with trial A black percentage sign is followed by a horizontal line on a white background, suggesting a decrease. Decrease line illustrations Percentage sign and horizontal line on a white background symbol discount. A black percentage sign is followed by a horizontal line on a white background. A black percentage sign is followed by a horizontal line on a white background, suggesting a decrease
Free with trial Set line Dollar rate decrease, Burning dollar bill and Stop delivery cargo truck on seamless pattern. Vector. Decrease line vectors Set line Dollar rate decrease, Burning dollar bill and Stop delivery cargo truck on seamless pattern. Vector.
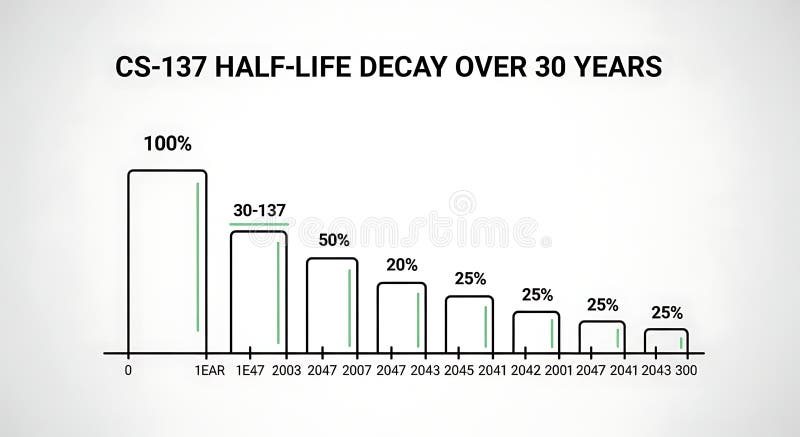
Free with trial A line graph illustrating the decrease in half-life over 30 years with bars representing percentage decay at different years, demonstrating long-term decline suitable for scientific, educational, or research presentations. Decrease line illustrations Half-life Decay Over 30 Years Chart Showing Decrease in Value or Effectiveness. A line graph illustrating the decrease in half-life over 30 years with bars. A line graph illustrating the decrease in half-life over 30 years with bars representing percentage decay at different years, demonstrating long-term decline suitable for scientific, educational, or research presentations
Free with trial Black silhouette of a jagged line graph showing a decrease over time on a white background. Decrease line illustrations Black silhouette of a jagged line graph decreasing over time chart economics. Black silhouette of a jagged line graph showing a decrease over time on a white. Black silhouette of a jagged line graph showing a decrease over time on a white background
Free with trial A simple icon of a downward arrow line, symbolizing decline, decrease, negative trends, and falling metrics. Ideal for business, finance, performance analytics, or warning indicators. This clear vector illustration is perfect for websites, apps, and presentations, conveying negative progress or caution, vector design Generative AI. Decrease line vectors Downward Trend Arrow Icon: Decline, Decrease Negative Trend, vector design Generative AI. A simple icon of a downward arrow line, symbolizing decline, decrease. A simple icon of a downward arrow line, symbolizing decline, decrease, negative trends, and falling metrics. Ideal for business, finance, performance analytics, or warning indicators. This clear vector illustration is perfect for websites, apps, and presentations, conveying negative progress or caution, vector design Generative AI
Free with trial Set line Drop in crude oil price, , Mobile stock trading and Dollar rate decrease. Glowing neon icon. Vector. Decrease line vectors Set line Drop in crude oil price, , Mobile stock trading and Dollar rate decrease. Glowing neon icon. Vector.
Free with trial Set line icons of diabetes. Isolated on black. Thirst, patient card, libido decrease, blood test, insulin injection, medical accessories. Vector illustration. Decrease line vectors Set line icons of diabetes. Isolated on black. Thirst, patient card, libido decrease, blood test, insulin injection, medical accessories. Vector illustration
Free with trial World map backdrop with a downward-trending red line graph and red bar graph, set against a black background. The bar graph features various heights, indicating statistical data points, while the line graph suggests a decrease. The map includes continents like Africa, Europe, Asia, and the Americas, with numerous small white dots representing data or illumination. The dramatic red color emphasizes the negative trend, possibly symbolizing economic or market decline on a global scale. Decrease line illustrations World map backdrop with a downward-trending red line graph and red bar graph. Set against a black background. The bar graph features various heights. World map backdrop with a downward-trending red line graph and red bar graph, set against a black background. The bar graph features various heights, indicating statistical data points, while the line graph suggests a decrease. The map includes continents like Africa, Europe, Asia, and the Americas, with numerous small white dots representing data or illumination. The dramatic red color emphasizes the negative trend, possibly symbolizing economic or market decline on a global scale.
Free with trial A critical flat vector icon showing a downward trending line graph, symbolizing business decline, negative statistics, and falling values. Essential for financial warnings, market analysis, risk assessment, or performance reviews. It clearly visualizes a decrease in metrics and potential challenges, vector design Generative AI. Decrease line vectors Downward Trending Line Graph Icon for Business Decline, vector design Generative AI. A critical flat vector icon showing a downward trending line graph. A critical flat vector icon showing a downward trending line graph, symbolizing business decline, negative statistics, and falling values. Essential for financial warnings, market analysis, risk assessment, or performance reviews. It clearly visualizes a decrease in metrics and potential challenges, vector design Generative AI
Free with trial Volume Decrease Button Line icon Sound Reduce Reduction Arrow Pointing Point Down Soft Softer Quiet Level Media Multimedia. Control Outline Shape Music. Decrease line vectors Volume Decrease Button Line icon Sound Reduce Reduction Arrow Pointing Point Down Soft Softer Quiet Level Media Multimedia. Control Outline Shape Music
Free with trial Simple line graph illustrating a negative trend, representing a decrease or decline in data. Perfect for presentations, reports, or website design. Decrease line vectors Downward Trending Line Graph, Showing Negative Growth or Decline. Simple line graph illustrating a negative trend, representing a decrease or decline in data. Simple line graph illustrating a negative trend, representing a decrease or decline in data. Perfect for presentations, reports, or website design.
Free with trial A series of black dots of varying sizes forms a wavy line across a white background. Numbers, including "10," "110," and "100," are placed intermittently above the dots. The sequence and arrangement suggest a pattern, potentially representing a concept in data visualization or coding. The dots gradually increase and decrease in size, emphasizing the wave-like shape. Decrease line illustrations Dots gradually increase and decrease in size, emphasizing the wave-like. A series of black dots of varying sizes forms a wavy line across a white background. A series of black dots of varying sizes forms a wavy line across a white background. Numbers, including "10," "110," and "100," are placed intermittently above the dots. The sequence and arrangement suggest a pattern, potentially representing a concept in data visualization or coding. The dots gradually increase and decrease in size, emphasizing the wave-like shape.
Free with trial Set Isometric line Drop in crude oil price, Mobile stock trading, Worker and Dollar rate decrease icon. Vector. Decrease line illustrations Set Isometric line Drop in crude oil price, Mobile stock trading, Worker and Dollar rate decrease icon. Vector.
Free with trial Line art illustration of a bar chart depicting financial decrease for business analysis. AI generated. Decrease line vectors Line art illustration of a bar chart depicting financial decrease for business analysis. AI generated
Free with trial Business graph data in a bar chart showing increase and decrease with blue line illustration on plain background. AI generated. Decrease line vectors Business graph data in a bar chart showing increase and decrease with blue line illustration on plain background. AI generated
Free with trial The image shows a 3D-rendered easel holding a canvas with a bar and line chart. The bar chart illustrates a declining trend in growth, with the first bar being the tallest and each subsequent bar progressively shorter. Overlaid on the bars is a red downward-sloping line, emphasizing the decrease. The scene is set against a plain white background, highlighting the chart's elements clearly. Decrease line illustrations Easing economic growth depicted through a declining bar and line chart on an easel. The image shows a 3D-rendered easel holding a canvas with a bar and line. The image shows a 3D-rendered easel holding a canvas with a bar and line chart. The bar chart illustrates a declining trend in growth, with the first bar being the tallest and each subsequent bar progressively shorter. Overlaid on the bars is a red downward-sloping line, emphasizing the decrease. The scene is set against a plain white background, highlighting the chart's elements clearly
Free with trial Trend melting line graph illustration analysis visualization, ice decrease, plot statistics trend melting line graph. Decrease line illustrations Trend melting line graph. Illustration analysis visualization, ice decrease, plot statistics AI generated. trend melting line graph illustration analysis visualization, ice decrease, plot statistics trend melting line graph
Free with trial A stark bar graph illustrates a clear downward trend, symbolized by a descending arrow. This image represents decline, decrease, or negative progression in data. Decrease line vectors Vector art of bar graph with a downward trend line indicating decline or decrease in data. A stark bar graph illustrates a clear downward trend, symbolized by a. A stark bar graph illustrates a clear downward trend, symbolized by a descending arrow. This image represents decline, decrease, or negative progression in data
Free with trial A simple yet impactful vector illustration of an orange line graph showing a downward trend, representing a decrease or negative performance. This graphic is perfect for financial dashboards, stock market analysis, business presentations, or statistical reports. It clearly conveys declining metrics and critical data points, vector design Generative AI. Decrease line vectors Orange Decreasing Line Graph Vector. Financial Market Drop Graphic, vector design Generative AI. A simple yet impactful vector illustration of an orange line. A simple yet impactful vector illustration of an orange line graph showing a downward trend, representing a decrease or negative performance. This graphic is perfect for financial dashboards, stock market analysis, business presentations, or statistical reports. It clearly conveys declining metrics and critical data points, vector design Generative AI
Free with trial Black and white line drawing of a mountain range with multiple peaks. The central peak is the tallest and most prominent, with jagged lines accentuating the rugged terrain. Peaks on either side gradually decrease in height, creating a balanced composition. Simplistic style emphasizes the natural contours and slopes of the mountains. Clean lines and absence of shading give a minimalist, stylized appearance. Decrease line illustrations On either side gradually decrease in height, creating a balanced compositio. Black and white line drawing of a mountain range with multiple peaks. The central. Black and white line drawing of a mountain range with multiple peaks. The central peak is the tallest and most prominent, with jagged lines accentuating the rugged terrain. Peaks on either side gradually decrease in height, creating a balanced composition. Simplistic style emphasizes the natural contours and slopes of the mountains. Clean lines and absence of shading give a minimalist, stylized appearance.
Free with trial Set line Worker Stop delivery cargo truck Dollar rate decrease Drop in crude oil price Mobile stock trading Gold bars Global economic crisis and icon. Vector. Decrease line vectors Set line Worker, Stop delivery cargo truck, Dollar rate decrease, Drop in crude oil price, Mobile stock trading, Gold. Set line Worker Stop delivery cargo truck. Set line Worker Stop delivery cargo truck Dollar rate decrease Drop in crude oil price Mobile stock trading Gold bars Global economic crisis and icon. Vector.
Free with trial A digital illustration of a black rectangular device with a dark blue background features a blue line graph on its screen, where an orange arrow points downward to indicate a decrease in frequency, with the x-axis representing time and the y-axis showing frequency, creating a visually striking and modern design for technology and data analysis concepts. Decrease line illustrations Digital device displaying a blue line graph with orange arrow on dark background. A digital illustration of a black rectangular device with a dark blue. A digital illustration of a black rectangular device with a dark blue background features a blue line graph on its screen, where an orange arrow points downward to indicate a decrease in frequency, with the x-axis representing time and the y-axis showing frequency, creating a visually striking and modern design for technology and data analysis concepts
Free with trial A clear vector illustration of a red downward trending line graph, symbolizing a decrease, decline, or negative performance. This icon is essential for financial reports, business presentations, data visualization, or any context indicating a reduction. Its simple, sharp design effectively communicates a downward trend in various metrics, vector design Generative AI. Decrease line vectors Red Downward Trending Graph Line Icon, vector design Generative AI. A clear vector illustration of a red downward trending line graph, symbolizing a decrease. A clear vector illustration of a red downward trending line graph, symbolizing a decrease, decline, or negative performance. This icon is essential for financial reports, business presentations, data visualization, or any context indicating a reduction. Its simple, sharp design effectively communicates a downward trend in various metrics, vector design Generative AI
Free with trial Isolated showing simple line graph showing downward trend on white background keywords: graph, chart, line graph, downward trend, decline, decrease. Decrease line illustrations Simple Line Graph Showing Downward Trend on White Background Keywords: graph, chart, line graph, downward trend. Isolated showing simple line graph showing. Isolated showing simple line graph showing downward trend on white background keywords: graph, chart, line graph, downward trend, decline, decrease
Free with trial Isolated showing simple line graph showing a downward trend on white background keywords: graph, chart, line, trend, data, decline, decrease. Decrease line illustrations Simple line graph showing a downward trend on white background Keywords: graph, chart, line, trend, data, decline. Isolated showing simple line graph showing a. Isolated showing simple line graph showing a downward trend on white background keywords: graph, chart, line, trend, data, decline, decrease
Free with trial Set line Dollar rate decrease, Pie chart infographic, Drop crude oil price and Shutdown of factory on seamless pattern. Vector. Decrease line vectors Set line Dollar rate decrease, Pie chart infographic, Drop crude oil price and Shutdown of factory on seamless pattern. Vector
Free with trial A red, zigzag arrow pointing downward is set against a plain white background. The arrow is three-dimensional with a prominent, bold design, suggesting a significant decline or decrease. In the background, a faint graph line echoes the downward trend, adding a subtle context of financial or data analysis. Decrease line illustrations A faint graph line echoes the downward trend, adding a subtle. A red, zigzag arrow pointing downward is set against a plain white background. The arrow is three. A red, zigzag arrow pointing downward is set against a plain white background. The arrow is three-dimensional with a prominent, bold design, suggesting a significant decline or decrease. In the background, a faint graph line echoes the downward trend, adding a subtle context of financial or data analysis.
Free with trial This minimalist vector illustration features two identical line graphs, presented in contrasting black and white themes. The left graph displays a black line on a white background, while the right shows a white line on a black background. Both graphs depict a clear downward trend with jagged fluctuations, symbolizing decline, loss, or negative growth over time. This versatile icon set is ideal for illustrating concepts such as economic downturns, financial losses, market crashes, business failures, or any data showing a significant decrease. Perfect for presentations, reports, infographics, and web design. Decrease line vectors Declining Line Graph Icon Set - Black and White. This minimalist vector illustration features two identical line graphs, presented in contrasting black and white. This minimalist vector illustration features two identical line graphs, presented in contrasting black and white themes. The left graph displays a black line on a white background, while the right shows a white line on a black background. Both graphs depict a clear downward trend with jagged fluctuations, symbolizing decline, loss, or negative growth over time. This versatile icon set is ideal for illustrating concepts such as economic downturns, financial losses, market crashes, business failures, or any data showing a significant decrease. Perfect for presentations, reports, infographics, and web design.
Free with trial The image features a wavy blue line composed of small dots, starting from the bottom-right corner and curving upwards before descending towards the bottom-left corner. The dots gradually decrease in density as they move away from the line, creating a sense of depth and dimensionality. In the top-left corner, the text 'Exarl 100 words' is displayed in black font, followed by 'BACKGROUND' on the. Decrease line illustrations A blue wavy line made up of small dots on a white background with text in the top left corner. The image features a wavy blue line composed of small dots. The image features a wavy blue line composed of small dots, starting from the bottom-right corner and curving upwards before descending towards the bottom-left corner. The dots gradually decrease in density as they move away from the line, creating a sense of depth and dimensionality. In the top-left corner, the text 'Exarl 100 words' is displayed in black font, followed by 'BACKGROUND' on the
Free with trial An illustration of a simple line graph showing a decline or decrease, accompanied by an exclamation mark inside a triangle, indicating a warning, danger or risk. Suitable for topics like financial loss, market crash, or economic downturn. Decrease line vectors Simple Line Decline Graph with Exclamation Mark Attention Icon Design. An illustration of a simple line graph showing a decline or decrease, accompanied by an. An illustration of a simple line graph showing a decline or decrease, accompanied by an exclamation mark inside a triangle, indicating a warning, danger or risk. Suitable for topics like financial loss, market crash, or economic downturn.
Free with trial This minimalist vector illustration depicts a retail store icon integrated into a shopping cart, positioned against a declining line graph. The visual metaphor highlights a negative economic trend or a decrease in consumer activity. The color palette uses muted tones with a bold red accent to emphasize the downward trajectory of the market performance. Decrease line vectors A line graph showing a downward trend for a retail business concept. This minimalist vector illustration depicts a retail store icon integrated into a shopping. This minimalist vector illustration depicts a retail store icon integrated into a shopping cart, positioned against a declining line graph. The visual metaphor highlights a negative economic trend or a decrease in consumer activity. The color palette uses muted tones with a bold red accent to emphasize the downward trajectory of the market performance
Free with trial A vector graphic of a line graph showing a downward trend. Represents decrease, decline, loss, or negative performance. In automotive context, could symbolize falling sales, decreasing fuel efficiency, or a system performance drop. A clear visual for illustrating negative trends, vector design Generative AI. Decrease line vectors Downtrend graph icon, decrease decline loss symbol, vector design Generative AI. A vector graphic of a line graph showing a downward trend. Represents decrease. A vector graphic of a line graph showing a downward trend. Represents decrease, decline, loss, or negative performance. In automotive context, could symbolize falling sales, decreasing fuel efficiency, or a system performance drop. A clear visual for illustrating negative trends, vector design Generative AI
Free with trial A red arrow pointing downwards with a jagged line indicating a decline or decrease in something, possibly related to finance or statistics. the arrow is pointing downwards to indicate a negative trend. Decrease line illustrations A red downward trend line with a jagged line. A red arrow pointing downwards with a jagged line indicating a decline or decrease in something, possibly related. a red arrow pointing downwards with a jagged line indicating a decline or decrease in something, possibly related to finance or statistics. the arrow is pointing downwards to indicate a negative trend
Free with trial Decrease and increase temperature of air on thermometer thin black and red symbols vector illustration. Four seasons, hot and cold weather of winter, summer and spring, autumn time line icon set. Decrease line vectors Four seasons, hot and cold weather of winter, summer and spring, autumn line icon set. Decrease and increase temperature of air on thermometer thin black and red. Decrease and increase temperature of air on thermometer thin black and red symbols vector illustration. Four seasons, hot and cold weather of winter, summer and spring, autumn time line icon set
Free with trial Red 3D bar chart with descending trend line and arrow, set against a dark gradient background. The tallest bar on the left progressively declines toward the right, illustrating a decrease. The entire structure has a glossy finish, emphasizing the downward movement indicated by the arrowhead at the end of the line. The chart appears suspended centrally, providing a clear visual representation of a downward trend, often used in financial or analytical contexts to denote loss or decline. Decrease line illustrations Red 3D bar chart with descending trend line and arrow, set against a dark gradient. Background. The tallest bar on the left progressively declines toward the. Red 3D bar chart with descending trend line and arrow, set against a dark gradient background. The tallest bar on the left progressively declines toward the right, illustrating a decrease. The entire structure has a glossy finish, emphasizing the downward movement indicated by the arrowhead at the end of the line. The chart appears suspended centrally, providing a clear visual representation of a downward trend, often used in financial or analytical contexts to denote loss or decline.
Free with trial A simple icon of an arrow pointing downwards at a dashed line. This can represent a destination, a specific point on a map, a download action, or a decrease in value. A versatile and clear graphic for various uses, vector design Generative AI. Decrease line vectors An arrow pointing down onto a dashed line or road vector design Generative AI. A simple icon of an arrow pointing downwards at a dashed line. This can represent. A simple icon of an arrow pointing downwards at a dashed line. This can represent a destination, a specific point on a map, a download action, or a decrease in value. A versatile and clear graphic for various uses, vector design Generative AI
Free with trial A minimalist black down arrow icon, isolated on a clean white background. The design features a solid rectangular top block transitioning into a sharp triangular arrowhead, subtly divided by a thin white line for a modern, stylized look. This versatile graphic is ideal for indicating download, decrease, downward direction, or negative trends in user interfaces, web design, mobile applications, presentations, and data visualization. Decrease line vectors Black Down Arrow Icon for Download and Decrease. A minimalist black down arrow icon, isolated on a clean white background. The design features a solid. A minimalist black down arrow icon, isolated on a clean white background. The design features a solid rectangular top block transitioning into a sharp triangular arrowhead, subtly divided by a thin white line for a modern, stylized look. This versatile graphic is ideal for indicating download, decrease, downward direction, or negative trends in user interfaces, web design, mobile applications, presentations, and data visualization.
Free with trial A red line with a jagged pattern trending downward, indicating a decrease or decline, with a large arrowhead at the end pointing downwards. Decrease line illustrations A red downward trend line with a jagged pattern. A red line with a jagged pattern trending downward, indicating a decrease or decline, with a large arrowhead at. a red line with a jagged pattern trending downward, indicating a decrease or decline, with a large arrowhead at the end pointing downwards
Free with trial A red arrow with a jagged line pattern pointing downwards, indicating a decline or decrease in something, possibly related to finance or statistics. Decrease line illustrations A red arrow pointing downwards in a jagged line. A red arrow with a jagged line pattern pointing downwards, indicating a decline or decrease in something. A red arrow with a jagged line pattern pointing downwards, indicating a decline or decrease in something, possibly related to finance or statistics
Free with trial A simple line graph icon showing a downward trend, representing statistics, data, or a decline in performance. Useful for financial reports, market analysis, or educational materials. Its clear visual direction conveys negative momentum or a decrease, vector design Generative AI. Decrease line vectors Downward Trend Line Graph Icon for Statistics and Data, vector design Generative AI. A simple line graph icon showing a downward trend, representing statistics. A simple line graph icon showing a downward trend, representing statistics, data, or a decline in performance. Useful for financial reports, market analysis, or educational materials. Its clear visual direction conveys negative momentum or a decrease, vector design Generative AI
Free with trial A red arrow with a jagged line pattern pointing downwards, indicating a decline or decrease in something, possibly related to finance or statistics. Decrease line illustrations A red arrow pointing downwards in a jagged line. A red arrow with a jagged line pattern pointing downwards, indicating a decline or decrease in something. A red arrow with a jagged line pattern pointing downwards, indicating a decline or decrease in something, possibly related to finance or statistics
Free with trial Stylized Christmas tree design with a transparent background. The tree is formed by a green spiral line adorned with star-shaped decorations. Larger green stars decrease in size as they ascend the spiral, leading to a prominent red star at the top. The tree appears to float, casting a subtle shadow beneath. The use of simple geometric shapes gives the image a minimalist and modern festive look. Decrease line vectors Creative abstract Christmas tree line art with green stars and red star topper isolated on transparent background for holidays. Stylized Christmas tree design. Stylized Christmas tree design with a transparent background. The tree is formed by a green spiral line adorned with star-shaped decorations. Larger green stars decrease in size as they ascend the spiral, leading to a prominent red star at the top. The tree appears to float, casting a subtle shadow beneath. The use of simple geometric shapes gives the image a minimalist and modern festive look.
Free with trial An detailed line art icon of gear inside security shield with decrease arrow. Decrease line vectors Gear inside security shield with decrease arrow. An AI generated detailed line art icon of gear inside security shield with decrease arrow. An detailed line art icon of gear inside security shield with decrease arrow
Free with trial Simple line art illustration of a dollar coin with a downward arrow, symbolizing decrease, loss, or negative financial trend. Represents economic decline, deflation, or a reduction in value. Decrease line vectors Line Art Dollar Coin Decrease Arrow Simple Finance Icon. Simple line art illustration of a dollar coin with a downward arrow, symbolizing decrease, loss, or. Simple line art illustration of a dollar coin with a downward arrow, symbolizing decrease, loss, or negative financial trend. Represents economic decline, deflation, or a reduction in value.
Free with trial Blood loss, anemia symptom, physical disease line icon, vector hematology, medicine science. Man with drops and downward arrows outline sign of bleeding, red blood cells production decrease, anemia. Decrease line vectors Blood loss, anemia symptom line icon, hematology. Blood loss, anemia symptom, physical disease line icon, vector hematology, medicine science. Man with drops and. Blood loss, anemia symptom, physical disease line icon, vector hematology, medicine science. Man with drops and downward arrows outline sign of bleeding, red blood cells production decrease, anemia
Free with trial A graph illustrates a downward trend with a blue line marked by circular data points on a grid. A large red arrow emphasizes the decline moving from top left to bottom right. The graph has thick dark axes suggesting a significant decrease over time. The grid is evenly spaced providing a clear backdrop for the data representation. This visual might represent decreasing performance revenue or another measurable factor. Decrease line illustrations Illustrates a downward trend with a blue line marked by circular data points. A graph illustrates a downward trend with a blue line marked by circular data. A graph illustrates a downward trend with a blue line marked by circular data points on a grid. A large red arrow emphasizes the decline moving from top left to bottom right. The graph has thick dark axes suggesting a significant decrease over time. The grid is evenly spaced providing a clear backdrop for the data representation. This visual might represent decreasing performance revenue or another measurable factor.
Free with trial Price and discount, cost reduction, profit growth financial strategy line icon set. Increase and decrease, optimization of price, competition thin black and red outline symbols vector illustration. Decrease line vectors Price and discount, cost reduction, profit growth financial strategy line icon set. Increase and decrease, optimization of price, competition thin black and
Free with trial Depreciation color line icon with decline bar graph and percent vector symbol. Inflation, economic crisis, business and finance recession, money loss and bankruptcy outline sign with decrease chart. Decrease line vectors Depreciation color line icon with decline graph. Depreciation color line icon with decline bar graph and percent vector symbol. Inflation, economic crisis. Depreciation color line icon with decline bar graph and percent vector symbol. Inflation, economic crisis, business and finance recession, money loss and bankruptcy outline sign with decrease chart
Free with trial A flat vector icon of a line graph showing a downward trend. Represents financial loss, market decline, negative statistics, or decreasing performance. Suitable for business reports, financial news, or graphics illustrating economic downturns, vector design Generative AI. Decrease line vectors Downward trending line graph icon financial market decrease, vector design Generative AI. A flat vector icon of a line graph showing a downward trend. Represents. A flat vector icon of a line graph showing a downward trend. Represents financial loss, market decline, negative statistics, or decreasing performance. Suitable for business reports, financial news, or graphics illustrating economic downturns, vector design Generative AI
Free with trial Increase and decrease, optimization of price, competition thin black and red outline symbols vector illustration Price and discount, cost reduction, profit growth financial strategy line icon set. Decrease line vectors Price and discount, cost reduction, profit growth financial strategy line icon set. Increase and decrease, optimization of price, competition thin black and red. Increase and decrease, optimization of price, competition thin black and red outline symbols vector illustration Price and discount, cost reduction, profit growth financial strategy line icon set.
Free with trial A flat vector icon showing a line graph with a distinct downward trend. Represents decline, decrease, negative growth, or falling performance. Suitable for business analysis, financial reports, or graphics illustrating negative progress or statistics, vector design Generative AI. Decrease line vectors Downward line graph icon representing negative trend decline, vector design Generative AI. A flat vector icon showing a line graph with a distinct downward trend. A flat vector icon showing a line graph with a distinct downward trend. Represents decline, decrease, negative growth, or falling performance. Suitable for business analysis, financial reports, or graphics illustrating negative progress or statistics, vector design Generative AI
Free with trial A stark pink line graph shows a dramatic downward trend against a dark green grid, symbolizing a significant loss or decrease. Decrease line illustrations Sharp decline illustrated by a jagged pink line graph on a dark green grid background. A stark pink line graph shows a dramatic downward trend against a dark. A stark pink line graph shows a dramatic downward trend against a dark green grid, symbolizing a significant loss or decrease
Free with trial An abstract icon featuring a line moving downwards, symbolizing a decline, negative trend, or decrease in value or performance. Useful in interfaces and graphics where a simple indicator of negative movement is needed without a full chart context, vector design Generative AI. Decrease line vectors Abstract Downtrend Line Icon, Representing Negative Performance, vector design Generative AI. An abstract icon featuring a line moving downwards, symbolizing a. An abstract icon featuring a line moving downwards, symbolizing a decline, negative trend, or decrease in value or performance. Useful in interfaces and graphics where a simple indicator of negative movement is needed without a full chart context, vector design Generative AI
Free with trial Coin value decrease RGB color icon. Revenue income. Currency management, business. Profit, investment. Wealth, control. Isolated vector illustration. Simple filled line drawing. Editable stroke. Decrease line vectors Coin value decrease RGB color icon. Revenue income. Currency management, business. Profit, investment. Wealth, control. Isolated vector illustration. Simple
Free with trial A blue line graph displays a sharp decrease in data points, isolated on a clean white background. Decrease line illustrations Line graph showing a steep decline in values over time isolated on white background. A blue line graph displays a sharp decrease in data points, isolated on a. A blue line graph displays a sharp decrease in data points, isolated on a clean white background
Free with trial Set line Casino chips dealer signboard Lottery ticket Online poker table game Dart arrow and Financial growth decrease icon. Vector. Decrease line illustrations Set line Casino chips, dealer, signboard, Lottery ticket, Online poker table game, Dart arrow, and Financial growth. Set line Casino chips dealer signboard. Set line Casino chips dealer signboard Lottery ticket Online poker table game Dart arrow and Financial growth decrease icon. Vector.
Free with trial A line art illustration of a man presenting a whiteboard with a large downward-pointing arrow. This graphic effectively represents a decrease, decline, or negative trend in sales, finance, or other data. Useful for business reports. vector design Generative AI. Decrease line vectors Businessman Presenting a Chart with a Downward Arrow. Decrease. vector design Generative AI. A line art illustration of a man presenting a whiteboard with a. A line art illustration of a man presenting a whiteboard with a large downward-pointing arrow. This graphic effectively represents a decrease, decline, or negative trend in sales, finance, or other data. Useful for business reports. vector design Generative AI
Free with trial A visual representation of declining data points connected by a red line. This graphic effectively illustrates a negative trend or decrease over time, suitable for financial or performance reports. Decrease line illustrations Data trend analysis showing downward trajectory with red dots and connecting line vector. A visual representation of declining data points connected by a red. A visual representation of declining data points connected by a red line. This graphic effectively illustrates a negative trend or decrease over time, suitable for financial or performance reports
Free with trial A series of concentric circles arranged in a horizontal line on a white background. The circles start large on the left and gradually decrease in size to the right. The sequence creates a sense of motion or progression. The black, minimalistic design emphasizes simplicity and geometric precision. Decrease line illustrations Start large on the left and gradually decrease in size to the. A series of concentric circles arranged in a horizontal line on a white background. The circles. A series of concentric circles arranged in a horizontal line on a white background. The circles start large on the left and gradually decrease in size to the right. The sequence creates a sense of motion or progression. The black, minimalistic design emphasizes simplicity and geometric precision.
Free with trial A vector icon depicting a line chart with a downward trend. Represents decline, decrease, negative trend, or falling statistics. Useful for finance apps, business reports, stock market monitoring, or visualizing negative data changes, vector design Generative AI. Decrease line vectors Decreasing Line Chart Icon Vector Illustration, vector design Generative AI. A vector icon depicting a line chart with a downward trend. Represents decline. A vector icon depicting a line chart with a downward trend. Represents decline, decrease, negative trend, or falling statistics. Useful for finance apps, business reports, stock market monitoring, or visualizing negative data changes, vector design Generative AI
Free with trial A simple graphic featuring a purple downward,pointing arrow with a horizontal line above it, symbolizing direction, download, decrease, or movement in a user interface or diagram , vector design Generative AI. Decrease line vectors Down arrow with line, indicating direction , vector design Generative AI. A simple graphic featuring a purple downward,pointing arrow with a horizontal line. A simple graphic featuring a purple downward,pointing arrow with a horizontal line above it, symbolizing direction, download, decrease, or movement in a user interface or diagram , vector design Generative AI
Free with trial Cloud storage scaling concept with dynamic size adjustment arrows showing capacity increase and decrease in isometric. Line contour vector illustration. Decrease line vectors Cloud storage scaling concept with dynamic size adjustment arrows showing capacity increase and decrease in isometric. Line contour vector illustration
Free with trial Line graph illustrating "Burn Rate Calculation" with a starting cash reserve of $1,000,000. The graph displays a declining cash reserve over 12 months, with an average monthly burn rate of $83,333. The y-axis shows cash reserve figures, while the x-axis represents months remaining. Various data points and markers track the decrease, emphasizing the "Burn Rate," depicted with colored sections under the line for visual clarity. Background includes financial icons and charts for context. Decrease line illustrations Track the decrease, emphasizing the Burn Rate, depicted with colored. Line graph illustrating 'Burn Rate Calculation' with a starting cash reserve of $1,000,000. Line graph illustrating "Burn Rate Calculation" with a starting cash reserve of $1,000,000. The graph displays a declining cash reserve over 12 months, with an average monthly burn rate of $83,333. The y-axis shows cash reserve figures, while the x-axis represents months remaining. Various data points and markers track the decrease, emphasizing the "Burn Rate," depicted with colored sections under the line for visual clarity. Background includes financial icons and charts for context.
Free with trial Growth and reduction arrow, up and down, line icon set. Rise and fall, increase and decrease. Graphic signs. Vector flat illustration. Decrease line illustrations Growth and reduction arrow, up and down, line icon set. Rise and fall, increase and decrease. Graphic signs. Vector illustration. Growth and reduction arrow, up. Growth and reduction arrow, up and down, line icon set. Rise and fall, increase and decrease. Graphic signs. Vector flat illustration
Free with trial A simple line art icon illustration showing a decreasing bar chart with an arrow pointing downward. This minimalist design is suitable for presentations, websites, and other visuals related to financial loss, economic downturn, or market decline. Decrease line vectors Simple Line Art Decrease Chart Icon Illustration for Financial Report. A simple line art icon illustration showing a decreasing bar chart with an arrow pointing. A simple line art icon illustration showing a decreasing bar chart with an arrow pointing downward. This minimalist design is suitable for presentations, websites, and other visuals related to financial loss, economic downturn, or market decline.
Free with trial Five smooth stones stacked in a tower formation are depicted in the line drawing. Each stone is adorned with patches of intricate lichen-like patterns. The stones decrease in size from the bottom to the top, resembling a traditional cairn. The image is monochromatic, emphasizing texture and detail, with the organic shapes of the lichen contrasting against the smooth surfaces of the stones. The arrangement suggests balance and stability. Decrease line illustrations Decrease in size from the bottom to the top, resembling a traditional. Five smooth stones stacked in a tower formation are depicted in the line drawing. Each. Five smooth stones stacked in a tower formation are depicted in the line drawing. Each stone is adorned with patches of intricate lichen-like patterns. The stones decrease in size from the bottom to the top, resembling a traditional cairn. The image is monochromatic, emphasizing texture and detail, with the organic shapes of the lichen contrasting against the smooth surfaces of the stones. The arrangement suggests balance and stability.
 Sign in