Free with trial A bold red down arrow vector icon, signifying decline, decrease, or a negative trend indicator. Ideal for financial reports, data visualization, warning signs, or content highlighting reductions and downward movement. Immediately conveys negative change or direction in various contexts, vector design Generative AI. Decrease line vectors Red Down Arrow: Decline, Decrease Negative Trend Indicator, vector design Generative AI. A bold red down arrow vector icon, signifying decline, decrease, or a. A bold red down arrow vector icon, signifying decline, decrease, or a negative trend indicator. Ideal for financial reports, data visualization, warning signs, or content highlighting reductions and downward movement. Immediately conveys negative change or direction in various contexts, vector design Generative AI
Free with trial The image depicts a red line graph that shows a downward trend. The graph has a prominent red arrow pointing downwards, indicating a significant decline. The background is dark, which makes the red line and arrow stand out prominently. Decrease line illustrations A vivid red downward trending line graph with a prominent arrow pointing downwards. The image depicts a red line graph that shows a downward trend. The graph has. The image depicts a red line graph that shows a downward trend. The graph has a prominent red arrow pointing downwards, indicating a significant decline. The background is dark, which makes the red line and arrow stand out prominently
Free with trial Simple Line Graph with Connected Dots Representing Data Points. Decrease line vectors A simplified black and white line graph icon showing a trend with four connected circular data points, indicating progress or. Simple Line Graph with Connected. Simple Line Graph with Connected Dots Representing Data Points
Free with trial Conceptual line art depicting a decrease in gold prices. Decrease line illustrations Gold Price Drop Magnifying Glass Showing Decreasing Value. Conceptual line art depicting a decrease in gold prices. Conceptual line art depicting a decrease in gold prices.
Free with trial Pyramid chart line icon. Halftone dotted pattern. Gradient icon with grain shadow. Analytics graph sign. Market analytics symbol. Line pyramid chart icon. Various designs. Vector. Decrease line vectors Pyramid chart line icon. Analytics graph sign. Halftone dotted pattern. Vector. Pyramid chart line icon. Halftone dotted pattern. Gradient icon with grain shadow. Pyramid chart line icon. Halftone dotted pattern. Gradient icon with grain shadow. Analytics graph sign. Market analytics symbol. Line pyramid chart icon. Various designs. Vector
Free with trial This image depicts an abstract symbol consisting of a horizontal line segment followed by a downward vertical line segment, forming an L shape that ends with a triangular arrowhead pointing downwards. The design is minimalistic and uses a single continuous line. Decrease line illustrations A simple downward arrow symbol with a horizontal line at the top forming an l shape. This image depicts an abstract symbol consisting of a horizontal line. This image depicts an abstract symbol consisting of a horizontal line segment followed by a downward vertical line segment, forming an L shape that ends with a triangular arrowhead pointing downwards. The design is minimalistic and uses a single continuous line
Free with trial Minimalist Volume Down Line Icon. A simple and clear line icon representing the action of turning the volume down. Decrease line vectors Minimalist Volume Down Line Icon. A simple and clear line icon representing the action of turning the volume down
Free with trial Black silhouette of a downward pointing arrow with horizontal lines and dotted line Macro view of bright green moss covered with numerous clear water droplets reflecting light, creating a sparkling texture. Decrease line illustrations Black silhouette of a downward pointing arrow with horizontal lines and dotted line. Macro view of bright green moss covered with numerous clear water droplets. Black silhouette of a downward pointing arrow with horizontal lines and dotted line Macro view of bright green moss covered with numerous clear water droplets reflecting light, creating a sparkling texture
Free with trial Green arrow pointing downward on financial graph. Business chart with falling trend line. Digital stock market data visualization for investment analysis. Decrease line illustrations Green arrow pointing downward on financial graph. Business chart with falling trend line. Digital stock market data visualization for investment analysis
Free with trial The image shows four wooden figures standing in a line, each progressively smaller than the one before it. Above them, a large red arrow points downward, indicating a decrease or reduction in size. Decrease line illustrations Wooden figures decreasing in size with a red arrow pointing downwards. The image shows four wooden figures standing in a line, each progressively smaller than. The image shows four wooden figures standing in a line, each progressively smaller than the one before it. Above them, a large red arrow points downward, indicating a decrease or reduction in size
Free with trial Decreasing graph line icon. Neumorphic, Flat shadow, 3d buttons. Column chart sign. Crisis diagram symbol. Line decreasing graph icon. Social media icons. Vector. Decrease line vectors Decreasing graph line icon. Crisis chart sign. Neumorphic buttons. Vector. Decreasing graph line icon. Neumorphic, Flat shadow, 3d buttons. Column chart sign. Decreasing graph line icon. Neumorphic, Flat shadow, 3d buttons. Column chart sign. Crisis diagram symbol. Line decreasing graph icon. Social media icons. Vector
Free with trial Simple Handdrawn Line Graph Icon with Data Points and Axis. Decrease line vectors A minimalist, hand-drawn icon representing a line graph with clearly marked data points on a simple horizontal and vertical axis,. Simple Handdrawn Line Graph. Simple Handdrawn Line Graph Icon with Data Points and Axis
Free with trial The image shows a white easel holding a chart with a combination of blue vertical bars and a red downward-sloping line, symbolizing a decline in data, likely representing economic downturn or falling trends. The easel is set against a plain background with a small decorative golden pyramid at the top. Decrease line illustrations Economic decline illustrated by a downward trending bar and line chart on an easel. The image shows a white easel holding a chart with a combination of blue. The image shows a white easel holding a chart with a combination of blue vertical bars and a red downward-sloping line, symbolizing a decline in data, likely representing economic downturn or falling trends. The easel is set against a plain background with a small decorative golden pyramid at the top
Free with trial A 3D rendering of a downward-trending yellow line graph on a dark red grid background. The line sharply drops, indicating a significant decline or negative performance, which suggests concepts such as economic recession, market crash, or business failure, possibly related to a global crisis or pandemic, as indicated by the blurred red circular shapes in the background. AI generates this image. Decrease line illustrations A yellow line graph dramatically declines on a red grid background, symbolizing a financial crisis or market downturn. A 3D rendering of a downward-trending. A 3D rendering of a downward-trending yellow line graph on a dark red grid background. The line sharply drops, indicating a significant decline or negative performance, which suggests concepts such as economic recession, market crash, or business failure, possibly related to a global crisis or pandemic, as indicated by the blurred red circular shapes in the background. AI generates this image.
Free with trial Black icon of a jagged downward trend line within a circle on a white background. Clear details and vibrant co. Decrease line illustrations Circular Icon With Downward Jagged Trend Line graph chart. Black icon of a jagged downward trend line within a circle on a white background. Clear details and. Black icon of a jagged downward trend line within a circle on a white background. Clear details and vibrant co
Free with trial A simple and clean line art icon of a graph, isolated on a white background. This vector illustration features a line chart with axes, showing a fluctuating trend with distinct data points. The minimalist design makes it perfect for various applications related to business, finance, and data analysis. Ideal for use in presentations, infographics, websites, mobile apps, and user interfaces to represent concepts like statistics, growth, market trends, performance reports, and financial analytics. A versatile symbol for progress and data visualization. Decrease line illustrations Analytics Line Graph Vector Icon. A simple and clean line art icon of a graph, isolated on a white background. This vector illustration features a line chart. A simple and clean line art icon of a graph, isolated on a white background. This vector illustration features a line chart with axes, showing a fluctuating trend with distinct data points. The minimalist design makes it perfect for various applications related to business, finance, and data analysis. Ideal for use in presentations, infographics, websites, mobile apps, and user interfaces to represent concepts like statistics, growth, market trends, performance reports, and financial analytics. A versatile symbol for progress and data visualization.
Free with trial The image depicts a graph with a prominent downward trend. The graph features a thick black line sloping downwards from left to right, indicating a decline. Alongside this line, there are several vertical bars representing data points. The bars vary in height, with some being taller and others shorter, suggesting fluctuations in the data. The overall visual representation suggests a decrease in. Decrease line vectors Graph displaying downward trend with multiple data points. The image depicts a graph with a prominent downward trend. The graph features a thick black line. The image depicts a graph with a prominent downward trend. The graph features a thick black line sloping downwards from left to right, indicating a decline. Alongside this line, there are several vertical bars representing data points. The bars vary in height, with some being taller and others shorter, suggesting fluctuations in the data. The overall visual representation suggests a decrease in
Free with trial Black icon of a rising line graph with an arrow pointing down on a white background. Decrease line illustrations Black icon of a rising line graph with arrow pointing down on white background chart. Black icon of a rising line graph with an arrow pointing down on a white. Black icon of a rising line graph with an arrow pointing down on a white background
Free with trial Red 3D bar graph against a black background, featuring an upward-sloping horizontal line that sharply declines, ending in a downward-pointing arrow. The bars decrease in height from left to right, visually representing a decline or loss. The red color contrasts with the dark background, emphasizing the downward trend. The composition suggests financial or business decline, often used in economic or market analysis. Decrease line illustrations Red 3D bar graph against a black background, featuring an upward-sloping. Horizontal line that sharply declines, ending in a downward-pointing arrow. The bars. Red 3D bar graph against a black background, featuring an upward-sloping horizontal line that sharply declines, ending in a downward-pointing arrow. The bars decrease in height from left to right, visually representing a decline or loss. The red color contrasts with the dark background, emphasizing the downward trend. The composition suggests financial or business decline, often used in economic or market analysis.
Free with trial Graph line icon. Neumorphic, Flat shadow, 3d buttons. Column chart sign. Growth diagram symbol. Line graph chart icon. Social media icons. Vector. Decrease line vectors Graph line icon. Column chart sign. Neumorphic buttons. Vector. Graph line icon. Neumorphic, Flat shadow, 3d buttons. Column chart sign. Growth diagram symbol. Graph line icon. Neumorphic, Flat shadow, 3d buttons. Column chart sign. Growth diagram symbol. Line graph chart icon. Social media icons. Vector
Free with trial The image depicts a downward trending line against a dark blue, starry background. the line itself is light blue and appears to be made of or surrounded by tiny particles, giving it a glowing effect. the line zigzags downwards, indicating a decline or loss, and ends with an arrow pointing further down. the overall impression is one of negative growth or a market downturn. Decrease line illustrations Falling trend line with starry background. The image depicts a downward trending line against a dark blue, starry background. the line itself is light blue and. the image depicts a downward trending line against a dark blue, starry background. the line itself is light blue and appears to be made of or surrounded by tiny particles, giving it a glowing effect. the line zigzags downwards, indicating a decline or loss, and ends with an arrow pointing further down. the overall impression is one of negative growth or a market downturn.
Free with trial Outline Line Business Financial Downward Trend Bar Chart Graph with Decreasing Arrow Icon. Decrease line illustrations A simple outline line icon depicting a bar chart showing a significant downward trend, indicating financial decline, business loss. Outline Line Business. Outline Line Business Financial Downward Trend Bar Chart Graph with Decreasing Arrow Icon
Free with trial A hand-drawn bar chart shows a downward trend with a line graph indicating a significant decrease in value over time. Decrease line vectors Downturn graph illustrating declining trends and financial loss. A hand-drawn bar chart shows a downward trend with a line graph indicating a significant. A hand-drawn bar chart shows a downward trend with a line graph indicating a significant decrease in value over time
Free with trial The image depicts a stylized, dark green forest with a bright green, fluctuating line superimposed over it. the line starts high on the left and trends downward to the right, ending with an arrow indicating a continued decline. the forest is composed of many trees with rounded canopies, creating a dense and somewhat mystical atmosphere. the overall impression is one of environmental or economic decline. Decrease line illustrations Declining trend line in a forest landscape. The image depicts a stylized, dark green forest with a bright green, fluctuating line superimposed over it. the line. the image depicts a stylized, dark green forest with a bright green, fluctuating line superimposed over it. the line starts high on the left and trends downward to the right, ending with an arrow indicating a continued decline. the forest is composed of many trees with rounded canopies, creating a dense and somewhat mystical atmosphere. the overall impression is one of environmental or economic decline.
Free with trial Solid Graph Line Chart With Thermometer Indicator Symbol. Decrease line vectors A simple black and white icon illustrating a line chart alongside a thermometer, symbolizing temperature tracking or data analysis. Solid Graph Line Chart With. Solid Graph Line Chart With Thermometer Indicator Symbol
Free with trial A black zigzag declining trend line with arrow on a white background. Scalable format print and digital media. Decrease line vectors Black zigzag declining trend line with arrow white background. A black zigzag declining trend line with arrow on a white background. Scalable format print and. A black zigzag declining trend line with arrow on a white background. Scalable format print and digital media
Free with trial Outline Handdrawn Wave Line With Connected Dots Graph Icon. Decrease line illustrations A simple, hand-drawn black outline icon depicting a wavy line with several connected circular dots, representing a graph or data. Outline Handdrawn Wave Line. Outline Handdrawn Wave Line With Connected Dots Graph Icon
Free with trial A set of line icons related to net zero. Carbon, neutral, green, energy, conservation, recycle, carbon dioxide, fresh, environment, and so on. Vector editable stroke. Decrease line vectors A set of line icons related to net zero. Carbon, neutral, green, energy, conservation, recycle, carbon dioxide, fresh, environment, and so on. Vector editable
Free with trial The image depicts a downward trend using a combination of bar and line chart elements. The yellow bars gradually decrease in height from left to right, indicating a consistent decline. A red line overlays the bars, further emphasizing the downward trajectory, ending with a large red arrow pointing downwards to signify a significant drop. This visual representation is often used to show reductions. Decrease line illustrations Declining trend illustrated through bar and line chart visualization isolated on white background. The image depicts a downward trend using a combination of bar. The image depicts a downward trend using a combination of bar and line chart elements. The yellow bars gradually decrease in height from left to right, indicating a consistent decline. A red line overlays the bars, further emphasizing the downward trajectory, ending with a large red arrow pointing downwards to signify a significant drop. This visual representation is often used to show reductions
Free with trial Line chart tracks data trends over time, with a downward arrow implying decline and a globe representing global impact. Ideal for analytics, performance, global strategy, tracking, economics, market. Decrease line illustrations Line Chart with Data Points, Downward Arrow, and Globe for Analysis and Global Trends. Line chart tracks data trends over time, with a downward arrow implying. Line chart tracks data trends over time, with a downward arrow implying decline and a globe representing global impact. Ideal for analytics, performance, global strategy, tracking, economics, market
Free with trial Flat design illustration showing colorful bar graph combined with a line chart, both displaying data trends against a simple black background. Decrease line vectors Colorful Bar Graph and Line Chart on Black Background Illustrating Data Analysis and Trends. Flat design illustration showing colorful bar graph combined with a. Flat design illustration showing colorful bar graph combined with a line chart, both displaying data trends against a simple black background.
Free with trial Outline Handdrawn Line Graph with Data Points Chart Icon. Decrease line vectors A simple, stylized line graph icon with distinct data points indicated by circles, presented in a hand-drawn outline style against. Outline Handdrawn Line Graph. Outline Handdrawn Line Graph with Data Points Chart Icon
Free with trial This is a cartoon illustration of a blue flower pot. the pot has a tiered design, with three distinct sections that decrease in size from top to bottom. each tier is separated by a black line, adding definition to the shape. the pot is empty, suggesting it's ready to be filled with soil and plants. the overall style is simple and clean, making it suitable for various design purposes. Decrease line illustrations Blue tiered flower pot cartoon illustration. This is a cartoon illustration of a blue flower pot. the pot has a tiered design, with three distinct sections that. this is a cartoon illustration of a blue flower pot. the pot has a tiered design, with three distinct sections that decrease in size from top to bottom. each tier is separated by a black line, adding definition to the shape. the pot is empty, suggesting it's ready to be filled with soil and plants. the overall style is simple and clean, making it suitable for various design purposes.
Free with trial Climate change, sustainability, carbon tracking, CO2 emissions reduction, environmental impact, data visualization. Line graph tracking data. Climate change and sustainability concepts. Decrease line vectors Carbon Footprint Reduction Concept with Line Graph, CO2 Symbol, and Decreasing Temperature Indicator. Climate change, sustainability, carbon tracking, CO2. Climate change, sustainability, carbon tracking, CO2 emissions reduction, environmental impact, data visualization. Line graph tracking data. Climate change and sustainability concepts
Free with trial Abstract image featuring a dense line on the left, gradually dissipating into various shapes like circles, squares, and triangles on a white background. The shapes decrease in size as they move right, creating a sense of dispersion or flow. The arrangement and fading effect provide a sense of movement and transition from order to chaos, with a subtle gradient of pastel colors. The composition suggests themes of data, technology, or transformation. Decrease line illustrations Into various shapes like circles, squares, and triangles on a. Abstract image featuring a dense line on the left, gradually dissipating into various shapes like. Abstract image featuring a dense line on the left, gradually dissipating into various shapes like circles, squares, and triangles on a white background. The shapes decrease in size as they move right, creating a sense of dispersion or flow. The arrangement and fading effect provide a sense of movement and transition from order to chaos, with a subtle gradient of pastel colors. The composition suggests themes of data, technology, or transformation.
Free with trial A circular icon containing a stylized representation of financial data. The icon features a series of black vertical bars of varying heights, suggesting a bar chart. Overlaid on the bars are two thin lines, one black and one grey, depicting line graphs with peaks and troughs, indicating fluctuating trends. The overall design is minimalist and symbolic, suitable for representing business analytics. Decrease line illustrations Circular Graph Icon with Bar and Line Charts Representing Financial Data and Trends business. A circular icon containing a stylized representation of financial. A circular icon containing a stylized representation of financial data. The icon features a series of black vertical bars of varying heights, suggesting a bar chart. Overlaid on the bars are two thin lines, one black and one grey, depicting line graphs with peaks and troughs, indicating fluctuating trends. The overall design is minimalist and symbolic, suitable for representing business analytics
Free with trial Displaying jagged red line chart declining on trading screen, with numeric labels and lens-flare. Financial, technology, analytics, investment, data visualization, digital, modern. Decrease line illustrations Displaying jagged red line chart declining on trading screen, with numeric labels and lens-flare. Financial, technology, analytics, investment, data
Free with trial Red zigzag line graph with broken arrows pointing up and down. Business metaphor for market volatility and financial crisis. Handdrawn zig zag arrows. Decrease line vectors Red zigzag line graph with broken arrows pointing up and down. Market volatility and financial crisis. Zig zag arrows. Red zigzag line graph with broken arrows. Red zigzag line graph with broken arrows pointing up and down. Business metaphor for market volatility and financial crisis. Handdrawn zig zag arrows
Free with trial Candlestick chart line icon. Neumorphic, Flat shadow, 3d buttons. Analytics graph sign. Market analytics symbol. Line candlestick chart icon. Social media icons. Vector. Decrease line vectors Candlestick chart line icon. Analytics graph sign. Neumorphic buttons. Vector. Candlestick chart line icon. Neumorphic, Flat shadow, 3d buttons. Analytics graph. Candlestick chart line icon. Neumorphic, Flat shadow, 3d buttons. Analytics graph sign. Market analytics symbol. Line candlestick chart icon. Social media icons. Vector
Free with trial One Line Art Thermometer Icon with Circle Arrows Indicating Temperature Change Illustration. AI generated. Decrease line vectors One Line Art Thermometer Icon with Circle Arrows Indicating Temperature Change Illustration. AI generated
Free with trial Displaying financial chart at digital interface, with blue bars, two line graphs, red decline arrow. Finance, data, analytics, dashboard, technology, investment, digital. Decrease line illustrations Displaying financial chart at digital interface, with blue bars, two line graphs, red decline arrow. Finance, data, analytics, dashboard, technology
Free with trial A minimalist black outline icon representing volume decrease, featuring a speaker symbol next to a minus sign, isolated on a white background for web and app UI. Decrease line vectors Volume down icon simple black line art for user interface design. A minimalist black outline icon representing volume decrease, featuring a speaker symbol next. A minimalist black outline icon representing volume decrease, featuring a speaker symbol next to a minus sign, isolated on a white background for web and app UI
Free with trial Graph line icon. Continuous line with share plane. Column chart sign. Ab test diagram symbol. 3d star in speech bubble. Graph chart single line ribbon. Loop curve pattern. Vector. Decrease line vectors Graph line icon. Column chart sign. Continuous line with plane. Vector. Graph line icon. Continuous line with share plane. Column chart sign. Ab test diagram. Graph line icon. Continuous line with share plane. Column chart sign. Ab test diagram symbol. 3d star in speech bubble. Graph chart single line ribbon. Loop curve pattern. Vector
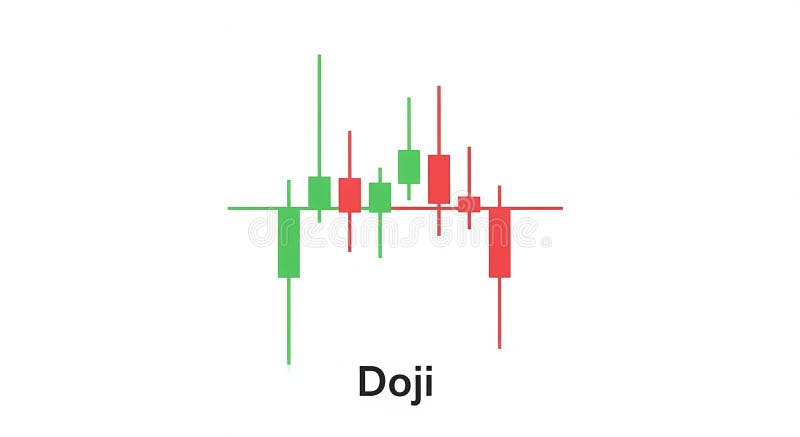
Free with trial The image depicts a candlestick chart pattern, specifically showcasing the "doji" formation. the chart consists of several candlesticks, some green (indicating a price increase) and some red (indicating a price decrease). a horizontal line runs through the center of the candlesticks, representing the opening and closing prices being nearly equal. the candlesticks have wicks or shadows extending above and below the body, showing the high and low prices for the period. the overall pattern suggests indecision in the market, where buyers and sellers are in equilibrium. Decrease line illustrations Candlestick chart pattern: doji formation. The image depicts a candlestick chart pattern, specifically showcasing the 'doji' formation. the chart consists of. the image depicts a candlestick chart pattern, specifically showcasing the "doji" formation. the chart consists of several candlesticks, some green (indicating a price increase) and some red (indicating a price decrease). a horizontal line runs through the center of the candlesticks, representing the opening and closing prices being nearly equal. the candlesticks have wicks or shadows extending above and below the body, showing the high and low prices for the period. the overall pattern suggests indecision in the market, where buyers and sellers are in equilibrium.
Free with trial A downward-trending red line graph overlays a dark screen displaying financial data with glowing red and green numbers. Image. Decrease line illustrations Stock Market Ticker with Red Decline Line. A downward-trending red line graph overlays a dark screen displaying financial data with glowing red and green numbers. A downward-trending red line graph overlays a dark screen displaying financial data with glowing red and green numbers. Image
Free with trial Graph line icon. Halftone dotted pattern. Gradient icon with grain shadow. Column chart sign. Ab test diagram symbol. Line graph chart icon. Various designs. Vector. Decrease line vectors Graph line icon. Column chart sign. Halftone dotted pattern. Vector. Graph line icon. Halftone dotted pattern. Gradient icon with grain shadow. Column chart sign. Graph line icon. Halftone dotted pattern. Gradient icon with grain shadow. Column chart sign. Ab test diagram symbol. Line graph chart icon. Various designs. Vector
Free with trial Cost Reduction Icons Set with Editable Line Style. Vector Outline Illustration Collection. Decrease line vectors Cost Reduction Icons Set with Editable Line Style. Vector Outline Illustration Collection. Cost Reduction Icons Set with Editable Line Style
Free with trial The image shows a conference room with a long wooden table and black leather chairs. a silver line graph depicting a downward trend is placed on the table. the graph starts high on the left and gradually declines towards the right, indicating a loss or decrease. the room is well-lit with ceiling lights. the background is blurred, focusing attention on the graph and the table. a painting is visible on the wall. Decrease line illustrations Decreasing graph on conference room table view. The image shows a conference room with a long wooden table and black leather chairs. a silver line graph. the image shows a conference room with a long wooden table and black leather chairs. a silver line graph depicting a downward trend is placed on the table. the graph starts high on the left and gradually declines towards the right, indicating a loss or decrease. the room is well-lit with ceiling lights. the background is blurred, focusing attention on the graph and the table. a painting is visible on the wall.
Free with trial Graph with a green line and a red dot. Line graph with a green line and a red dot on top. The red dot is located at the top left corner of the graph AI generated. Decrease line illustrations Graph with a green line and a red dot. Line graph with a green line and a red dot on top. The red dot is located at the top left corner of the graph AI generated
Free with trial Clipboard Review and Analysis Line Icon. A minimalist line icon representing a detailed review or audit. Decrease line vectors Clipboard Review and Analysis Line Icon. A minimalist line icon representing a detailed review or audit
Free with trial A simple vector icon of a horizontal line, representing a minus button or subtraction function. Ideal for quantity adjustments, removing items, scaling down, or decreasing values in digital interfaces. Provides an intuitive control for reduction, enhancing user interaction with precise adjustments, vector design Generative AI. Decrease line vectors Subtract Button Icon, Quantity Decrease, vector design Generative AI. A simple vector icon of a horizontal line, representing a minus button or subtraction. A simple vector icon of a horizontal line, representing a minus button or subtraction function. Ideal for quantity adjustments, removing items, scaling down, or decreasing values in digital interfaces. Provides an intuitive control for reduction, enhancing user interaction with precise adjustments, vector design Generative AI
Free with trial The image features a neon white line graph depicting a downward trend, suggesting a decline in value or performance. the graph is set against a dark background, creating a stark contrast that emphasizes the neon light. the presence of shimmering particles around the line adds a sense of movement. a reflective surface below mirrors the graph, enhancing the visual impact and creating a sense of depth. Decrease line illustrations Neon downward trend line with reflection effect. The image features a neon white line graph depicting a downward trend, suggesting a decline in value or. the image features a neon white line graph depicting a downward trend, suggesting a decline in value or performance. the graph is set against a dark background, creating a stark contrast that emphasizes the neon light. the presence of shimmering particles around the line adds a sense of movement. a reflective surface below mirrors the graph, enhancing the visual impact and creating a sense of depth.
Free with trial A digital illustration of a declining line graph with a large downward arrow and a coin at the bottom, representing financial decline or market loss, suitable for economic and business contexts. Decrease line illustrations Downward Trending Graph with Falling Line Chart and Coin Illustration. A digital illustration of a declining line graph with a large downward arrow and a coin at. A digital illustration of a declining line graph with a large downward arrow and a coin at the bottom, representing financial decline or market loss, suitable for economic and business contexts
Free with trial Displaying financial chart on dark grid screen, with red trend line and multicolored waveform lines. Analytics, financial, investment, stockmarket, data visualization, digital, technology. Decrease line illustrations Displaying financial chart on dark grid screen, with red trend line and multicolored waveform lines. Analytics, financial, investment, stockmarket, data
Free with trial A 3D rendered red bar chart and line graph show a downward trend against a white grid background. The graph reflects a decline with a red arrow pointing down. Decrease line illustrations Red downward trending bar chart and line graph on white grid image. A 3D rendered red bar chart and line graph show a downward trend against a white grid. A 3D rendered red bar chart and line graph show a downward trend against a white grid background. The graph reflects a decline with a red arrow pointing down
Free with trial Graph line icon. Halftone dotted pattern. Gradient icon with grain shadow. Column chart sign. Growth diagram symbol. Line graph chart icon. Various designs. Vector. Decrease line vectors Graph line icon. Column chart sign. Halftone dotted pattern. Vector. Graph line icon. Halftone dotted pattern. Gradient icon with grain shadow. Column chart sign. Graph line icon. Halftone dotted pattern. Gradient icon with grain shadow. Column chart sign. Growth diagram symbol. Line graph chart icon. Various designs. Vector
Free with trial Presentation board line icon. Halftone dotted pattern. Gradient icon with grain shadow. Column graph sign. Growth diagram symbol. Line presentation board icon. Various designs. Vector. Decrease line vectors Presentation board line icon. Column graph sign. Halftone dotted pattern. Vector. Presentation board line icon. Halftone dotted pattern. Gradient icon with grain. Presentation board line icon. Halftone dotted pattern. Gradient icon with grain shadow. Column graph sign. Growth diagram symbol. Line presentation board icon. Various designs. Vector
Free with trial Pie chart line icon. Halftone dotted pattern. Gradient icon with grain shadow. Presentation 3d graph sign. Market analytics symbol. Line pie chart icon. Various designs. Vector. Decrease line vectors Pie chart line icon. Presentation 3d graph sign. Halftone dotted pattern. Vector. Pie chart line icon. Halftone dotted pattern. Gradient icon with grain shadow. Pie chart line icon. Halftone dotted pattern. Gradient icon with grain shadow. Presentation 3d graph sign. Market analytics symbol. Line pie chart icon. Various designs. Vector
Free with trial An exponential decay function graph displayed on a black background features a prominent orange curved line that starts at the top left and gradually decreases toward the bottom right, with the x-axis labeled X and y-axis labeled 10X indicating logarithmic scaling, while four distinct numerical values 3, 2, 0, and 1 are displayed in crisp white text along the left side corresponding to different. Decrease line illustrations Exponential decay curve graph on black background showing mathematical function with orange line and numerical values. An exponential decay function graph. An exponential decay function graph displayed on a black background features a prominent orange curved line that starts at the top left and gradually decreases toward the bottom right, with the x-axis labeled X and y-axis labeled 10X indicating logarithmic scaling, while four distinct numerical values 3, 2, 0, and 1 are displayed in crisp white text along the left side corresponding to different
Free with trial The image displays a conceptual representation of saving for a house. stacks of coins, varying in height, are arranged in a line leading towards a miniature house. the stacks of coins gradually decrease in size as they approach the house, symbolizing the accumulation of funds needed for a down payment or mortgage. the house is a small, detailed model with a gray roof, white walls, and a tiny fence, representing the ultimate goal of homeownership. the background is a solid, dark blue color, which helps to emphasize the coins and the house. the arrangement suggests a journey or progression towards achieving the dream of owning a home, highlighting the importance of saving and financial planning. Decrease line illustrations Coins leading to a house: home investment path. The image displays a conceptual representation of saving for a house. stacks of coins, varying in height, are. the image displays a conceptual representation of saving for a house. stacks of coins, varying in height, are arranged in a line leading towards a miniature house. the stacks of coins gradually decrease in size as they approach the house, symbolizing the accumulation of funds needed for a down payment or mortgage. the house is a small, detailed model with a gray roof, white walls, and a tiny fence, representing the ultimate goal of homeownership. the background is a solid, dark blue color, which helps to emphasize the coins and the house. the arrangement suggests a journey or progression towards achieving the dream of owning a home, highlighting the importance of saving and financial planning.
Free with trial Financial Crisis Icons Set with Editable Line Style. Vector Outline Illustration Collection. Decrease line vectors Financial Crisis Icons Set with Editable Line Style. Vector Outline Illustration Collection. Financial Crisis Icons Set with Editable Line Style
Free with trial This image displays a 3D bar graph with five vertical bars of decreasing height, rendered in a vibrant pink color. A pink line graph with a sharp downward trajectory originates from the top of the tallest bar and descends across the bars, ending at the base of the shortest bar. The entire composition is isolated on a clean white background, clearly illustrating a negative trend or decline. Decrease line illustrations A pink 3D bar graph with a descending line graph on a white background chart. This image displays a 3D bar graph with five vertical bars of decreasing height. This image displays a 3D bar graph with five vertical bars of decreasing height, rendered in a vibrant pink color. A pink line graph with a sharp downward trajectory originates from the top of the tallest bar and descends across the bars, ending at the base of the shortest bar. The entire composition is isolated on a clean white background, clearly illustrating a negative trend or decline
Free with trial Professional 3d bar chart showing decreasing market results with trend line indicator representing economic recession financial analysis and negative outcomes. Decrease line illustrations Declining performance chart with trend line illustrating business market downturn analysis. Professional 3d bar chart showing decreasing market results with. Professional 3d bar chart showing decreasing market results with trend line indicator representing economic recession financial analysis and negative outcomes
Free with trial Abstract digital illustration of a financial chart. A glowing white line graph rises and falls against a blue background with a grid pattern made of dots. The image conveys concepts of market trends, stock analysis, investment, and economic fluctuations. Suitable for illustrating financial reports, business presentations, and technology-related articles. Decrease line illustrations Abstract Financial Chart with Glowing Line. Abstract digital illustration of a financial chart. A glowing white line graph rises and falls against a blue. Abstract digital illustration of a financial chart. A glowing white line graph rises and falls against a blue background with a grid pattern made of dots. The image conveys concepts of market trends, stock analysis, investment, and economic fluctuations. Suitable for illustrating financial reports, business presentations, and technology-related articles.
Free with trial Colorful line graph illustrating growth and decline over time, with variously colored data points on a dark background, visualizing financial performance and trends. Decrease line vectors Colorful line graph illustrating growth and decline over time, with variously colored data points on a dark background. Visualizing financial performance and
Free with trial Red bar graph with a descending line and arrow on a white background. The graph features four bars of varying heights, depicting a decline in values from left to right. The red line starts at the top of the first bar, dips below the second, rises over the third, then slopes downward with a pronounced arrow pointing to the right, indicating a decrease in data or performance. The image suggests themes of loss or negative financial trends. Decrease line vectors Red bar graph with a descending line and arrow on a white background. The graph features four bars of varying heights, depicting a decline in values from left
Free with trial Line graph with downward trend alongside sad face. Ideal for performance loss, business challenges, failure, analysis, recession, disappointment, frustration. Simple flat metaphor. Decrease line vectors Declining Line Graph with Sad Face Representing Negative Trend and Disappointment. Line graph with downward trend alongside sad face. Ideal for performance loss. Line graph with downward trend alongside sad face. Ideal for performance loss, business challenges, failure, analysis, recession, disappointment, frustration. Simple flat metaphor
Free with trial Black line graph with upward and downward trends and arrows chart data. Black line graph showing upward and downward trends with arrows on a white background. Decrease line illustrations Black line graph with upward and downward trends and arrows chart data. Black line graph showing upward and downward trends with arrows on a white background
Free with trial A black downward-pointing triangle symbol with a horizontal line positioned directly beneath it, set against a white background. Decrease line illustrations Black Downward Triangle Icon with Horizontal Line Below on White Background down arrow symbol. A black downward-pointing triangle symbol with a horizontal line. A black downward-pointing triangle symbol with a horizontal line positioned directly beneath it, set against a white background
Free with trial This image features a bar chart with orange bars representing performance metrics that steadily decrease over time, accompanied by a downward-sloping line graph that tracks the same trend against a blurred office background. Decrease line illustrations A bar chart showing a steady decline in performance metrics over a series of sequential periods. This image features a bar chart with orange bars representing. This image features a bar chart with orange bars representing performance metrics that steadily decrease over time, accompanied by a downward-sloping line graph that tracks the same trend against a blurred office background
Free with trial Aesthetic pastel style diminishing line graph illustration soft gradient, design minimal, subtle smooth aesthetic pastel style diminishing line graph. Decrease line illustrations Aesthetic pastel style diminishing line graph. Illustration soft gradient, design minimal, subtle smooth AI generated. aesthetic pastel style diminishing line graph illustration soft gradient, design minimal, subtle smooth aesthetic pastel style diminishing line graph
Free with trial Icon showing a laptop with a downward zigzag arrow on the screen, symbolizing a decline or decrease. Black outline design with a shadow extending to the left on a white background. Minimalistic and modern style. Decrease line vectors Icon showing a laptop with a downward zigzag arrow on the screen, symbolizing a decline or decrease. Black outline design with a shadow extending to the left
Free with trial Analysis shifting line chart illustration visualization movement, axis series, dynamic fluctuation analysis shifting line chart. Decrease line illustrations Analysis shifting line chart. Illustration visualization movement, axis series, dynamic fluctuation AI generated. analysis shifting line chart illustration visualization movement, axis series, dynamic fluctuation analysis shifting line chart
Free with trial The image depicts a financial chart, specifically a downward trending line graph, suggesting a stock market crash or economic downturn. the line is orange and jagged, indicating volatility and a significant decrease in value. the background features a dark blue grid with vertical lines, possibly representing data points or time intervals. the overall aesthetic is modern and digital, reinforcing the theme of financial technology and market analysis. the color scheme is dominated by blues and oranges, creating a sense of urgency and concern. Decrease line illustrations Stock market crash illustration with downward trend. The image depicts a financial chart, specifically a downward trending line graph, suggesting a stock market. the image depicts a financial chart, specifically a downward trending line graph, suggesting a stock market crash or economic downturn. the line is orange and jagged, indicating volatility and a significant decrease in value. the background features a dark blue grid with vertical lines, possibly representing data points or time intervals. the overall aesthetic is modern and digital, reinforcing the theme of financial technology and market analysis. the color scheme is dominated by blues and oranges, creating a sense of urgency and concern.
Free with trial This infographic displays a bar graph illustrating a sharp negative trend. The red line clearly depicts a significant decrease, showcasing concepts like downturn, recession, and loss within a business or financial context. Ideal for presentations, reports, and analyses highlighting negative market trends or economic decline, generated by AI. Decrease line illustrations Decreasing bar graph showing negative trend decline. This infographic displays a bar graph illustrating a sharp negative trend. The red line clearly depicts a. This infographic displays a bar graph illustrating a sharp negative trend. The red line clearly depicts a significant decrease, showcasing concepts like downturn, recession, and loss within a business or financial context. Ideal for presentations, reports, and analyses highlighting negative market trends or economic decline, generated by AI.
Free with trial Line art financial icons set featuring a businessman with money and a decrease in funds for financial management. AI generated. Decrease line vectors Line art financial icons set featuring a businessman with money and a decrease in funds for financial management. AI generated
Free with trial A vector graphic of a line graph showing a downward trend with an arrow. Represents decline, loss, decrease, negative progress, or recession. Useful graphic for financial reports, statistics, or negative outcomes. Illustrating a drop in value, vector design Generative AI. Decrease line vectors Downward Trend Arrow Vector Graphic, Decline and Loss Icon, vector design Generative AI. A vector graphic of a line graph showing a downward trend with an arrow. A vector graphic of a line graph showing a downward trend with an arrow. Represents decline, loss, decrease, negative progress, or recession. Useful graphic for financial reports, statistics, or negative outcomes. Illustrating a drop in value, vector design Generative AI
Free with trial A versatile collection of flat vector icons illustrating concepts of decline, decrease, and loss. This set features various graphics, including downward-pointing arrows, negative trend line graphs, and falling bar charts in multiple colors. These symbols are perfect for representing financial crisis, economic recession, stock market crash, business failure, or any form of reduction. Ideal for use in infographics, presentations, financial reports, websites, and data visualization projects, these modern icons effectively communicate negative trends and downturns. Isolated on a white background for easy integration into any design. Decrease line illustrations Financial Decline and Recession Vector Icon Set. A versatile collection of flat vector icons illustrating concepts of decline, decrease, and loss. This set. A versatile collection of flat vector icons illustrating concepts of decline, decrease, and loss. This set features various graphics, including downward-pointing arrows, negative trend line graphs, and falling bar charts in multiple colors. These symbols are perfect for representing financial crisis, economic recession, stock market crash, business failure, or any form of reduction. Ideal for use in infographics, presentations, financial reports, websites, and data visualization projects, these modern icons effectively communicate negative trends and downturns. Isolated on a white background for easy integration into any design.
Free with trial A stark black and white photograph features deeply cracked, uneven ground as its textured backdrop, with a prominent red line graph positioned centrally that displays a clear downward trend symbolizing decreasing cancer diagnosis rates, accompanied by a small but vivid red blood splatter in the top right corner acting as a potent symbol, all set against a solid black background to create a somber. Decrease line illustrations Black and white photograph of cracked ground with red declining line graph representing decreasing cancer diagnosis rates with. A stark black and white. A stark black and white photograph features deeply cracked, uneven ground as its textured backdrop, with a prominent red line graph positioned centrally that displays a clear downward trend symbolizing decreasing cancer diagnosis rates, accompanied by a small but vivid red blood splatter in the top right corner acting as a potent symbol, all set against a solid black background to create a somber
Free with trial A bright red line charts a steep downward trend against a blurred, abstract blue background with horizontal lines. Decrease line illustrations Red downward trending graph line against abstract blue background chart. A bright red line charts a steep downward trend against a blurred, abstract blue. A bright red line charts a steep downward trend against a blurred, abstract blue background with horizontal lines
 Sign in