Free with trial Percent arrow down and up icon on circle line. Percentage decline and growth sign symbol. Vector. Decrease line vectors Percent arrow down and up icon on circle line. Percentage decline and growth sign symbol. Vector
Free with trial Business Graphs and Charts Line Icon Set featuring analytics, statistics, data visualization, bar charts, line graphs, pie charts, performance reports, trends, metrics, and business intelligence symbols. Ideal for projects related to data analysis, financial reporting, market research, business performance, statistics, forecasting, and decision-making. Clean line-style icons with a transparent background, suitable for websites, mobile apps, dashboards, presentations, infographics, reports, and digital media. Decrease line illustrations Business Graphs and Charts Line Icon Set, Analytics Statistics Vector white Background. Business Graphs and Charts Line Icon Set featuring analytics, statistics. Business Graphs and Charts Line Icon Set featuring analytics, statistics, data visualization, bar charts, line graphs, pie charts, performance reports, trends, metrics, and business intelligence symbols. Ideal for projects related to data analysis, financial reporting, market research, business performance, statistics, forecasting, and decision-making. Clean line-style icons with a transparent background, suitable for websites, mobile apps, dashboards, presentations, infographics, reports, and digital media.
Free with trial This minimalist graphic features a bold red line forming a downward-pointing arrow shape. The design is clean and flat, set against a solid white background to emphasize the negative trend. It serves as a clear visual representation of financial loss, market decline, or decreasing performance metrics. Decrease line vectors A simple red line graph icon showing a downward trend on a white background. This minimalist graphic features a bold red line forming a downward-pointing arrow. This minimalist graphic features a bold red line forming a downward-pointing arrow shape. The design is clean and flat, set against a solid white background to emphasize the negative trend. It serves as a clear visual representation of financial loss, market decline, or decreasing performance metrics
Free with trial A wooden easel displaying a combined bar and line chart illustrating growth followed by a sharp decline, emphasizing downward trend. Decrease line illustrations Easel with bar and line chart showing decline. A wooden easel displaying a combined bar and line chart illustrating growth followed by a sharp decline. A wooden easel displaying a combined bar and line chart illustrating growth followed by a sharp decline, emphasizing downward trend
Free with trial Set of minimalist line icons representing population growth, demographics, human statistics, migration, society, birth rate, and urban density isolated on a white background. Decrease line vectors Population & Demographics Line Icon Set Vector Illustration. Set of minimalist line icons representing population growth, demographics, human statistics. Set of minimalist line icons representing population growth, demographics, human statistics, migration, society, birth rate, and urban density isolated on a white background.
Free with trial A series of seven vibrant red hearts arranged in a straight line on a plain white background. The hearts are evenly spaced and decrease slightly in size from left to right, creating a sense of depth and perspective. Decrease line illustrations Line of red hearts isolated on white background. A series of seven vibrant red hearts arranged in a straight line on a plain white background. The hearts are. A series of seven vibrant red hearts arranged in a straight line on a plain white background. The hearts are evenly spaced and decrease slightly in size from left to right, creating a sense of depth and perspective
Free with trial A comprehensive collection of flat line design icons representing key concepts in business, finance, and data analytics. The set includes various charts (bar, line, pie), a speedometer, a magnifying glass with a graph, financial documents with checkmarks, a target with an arrow, a dollar sign, a percentage symbol, and directional arrows for growth and decline. These versatile vector elements are ideal for presentations, reports, websites, and applications focused on statistics, performance, strategy, and financial insights. Decrease line illustrations Business and Data Analytics Flat Line Icons Set. A comprehensive collection of flat line design icons representing key concepts in business, finance, and data. A comprehensive collection of flat line design icons representing key concepts in business, finance, and data analytics. The set includes various charts (bar, line, pie), a speedometer, a magnifying glass with a graph, financial documents with checkmarks, a target with an arrow, a dollar sign, a percentage symbol, and directional arrows for growth and decline. These versatile vector elements are ideal for presentations, reports, websites, and applications focused on statistics, performance, strategy, and financial insights.
Free with trial This graphic illustration features a red line chart plotted against a light gray grid background, indicating a consistent decline in value. Multiple downward-pointing arrows and currency symbols are integrated into the design to emphasize the negative economic movement. The overall aesthetic is clean, minimalist and professional, utilizing a high-contrast color palette to convey a sense of urgency. Decrease line vectors A red line graph showing a downward trend in financial performance metrics. This graphic illustration features a red line chart plotted against a light gray grid. This graphic illustration features a red line chart plotted against a light gray grid background, indicating a consistent decline in value. Multiple downward-pointing arrows and currency symbols are integrated into the design to emphasize the negative economic movement. The overall aesthetic is clean, minimalist and professional, utilizing a high-contrast color palette to convey a sense of urgency
Free with trial One line drawing Business chart loss concept. Continuous one single line drawing Business chart loss schedule icon vector illustration concept. Decrease line vectors One line drawing Business chart loss concept. Continuous one single line drawing Business chart loss schedule icon vector illustration concept
Free with trial An isolated graphic illustration featuring a red downward-trending jagged arrow overlapping an outlined Indian Rupee symbol and a decreasing line graph, symbolizing financial loss, market decline, and currency depreciation. Delivered with an alpha transparent background. Decrease line vectors Red Downward Arrow with Indian Rupee Symbol and Declining Line Graph Alpha Transparent. An isolated graphic illustration featuring a red downward-trending jagged. An isolated graphic illustration featuring a red downward-trending jagged arrow overlapping an outlined Indian Rupee symbol and a decreasing line graph, symbolizing financial loss, market decline, and currency depreciation. Delivered with an alpha transparent background.
Free with trial Irregular heartbeat anemia symptom line icon of hematology, physical disease, medicine science. Vector outline heart with arrhythmia heartbeat rate, tachycardia or bradycardia beat isolated sign. Decrease line vectors Irregular heartbeat anemia symptom line icon. Of hematology, physical disease, medicine science. Vector outline heart with arrhythmia heartbeat rate. Irregular heartbeat anemia symptom line icon of hematology, physical disease, medicine science. Vector outline heart with arrhythmia heartbeat rate, tachycardia or bradycardia beat isolated sign
Free with trial This illustration features a minimalist hand-drawn line graph depicting a clear downward trajectory. The blue line connects several circular data points, ending in a distinct red circle that highlights a final decline. The background is clean and white, emphasizing the simple sketch style used to represent financial or statistical loss. Decrease line vectors A simple hand drawn line graph showing a downward trend on a white background. This illustration features a minimalist hand-drawn line graph depicting a clear. This illustration features a minimalist hand-drawn line graph depicting a clear downward trajectory. The blue line connects several circular data points, ending in a distinct red circle that highlights a final decline. The background is clean and white, emphasizing the simple sketch style used to represent financial or statistical loss
Free with trial Money loan line icon set. Credit score, low interest, discount card, mortgage percent, tax minimal vector illustration. Simple outline signs for bank application. Blue color, Editable Stroke. Decrease line vectors Money loan line icon set. Credit score, low interest, discount card, mortgage percent, tax minimal vector illustration. Simple outline signs for bank
Free with trial Black line graph with downward trend and markers. Simple vector line graph showing a downward trend with circular markers on each data point. Decrease line vectors Black line graph with downward trend and markers. Simple vector line graph showing a downward trend with circular markers on each data point
Free with trial Chart animating as red arrow entering top-left, data line moving right, bars fading, showing drop. Infographic, visualization, metrics, performance, urban, skyline, sunset. Decrease line illustrations Chart animating as red arrow entering top-left, data line moving right, bars fading, showing drop. Infographic, visualization, metrics, performance, urban
Free with trial Chart animating as red arrow entering top-left, data line moving right, bars fading, showing drop. Infographic, visualization, metrics, performance, urban, skyline, sunset. Decrease line illustrations Chart animating as red arrow entering top-left, data line moving right, bars fading, showing drop. Infographic, visualization, metrics, performance, urban
Free with trial This minimalist vector illustration depicts a declining line chart against a clean background. The graphic features a prominent red arrow pointing downward, symbolizing a negative trend or financial loss. The composition uses a professional color palette of muted grays and a bold red accent to highlight the downward movement of the data points. Decrease line vectors A simple line graph showing a downward trend in business performance metrics. This minimalist vector illustration depicts a declining line chart against a clean. This minimalist vector illustration depicts a declining line chart against a clean background. The graphic features a prominent red arrow pointing downward, symbolizing a negative trend or financial loss. The composition uses a professional color palette of muted grays and a bold red accent to highlight the downward movement of the data points
Free with trial Graph and diagram from planes with decrease. Finance and business concept. Vector. Illustration. Decrease line vectors Graph and diagram from planes with decrease. Finance and business concept. Vector. Illustration
Free with trial Simple line drawing of a man and a woman in suits, a set of of the yen depreciation and appreciation exchange rate fluctuations of investments and the increase and decrease of savings balances, Vector Illustration. Decrease line vectors Simple line drawing of a man and a woman in suits, a set of of the yen depreciation and appreciation exchange. Rate fluctuations of investments and the increase. Simple line drawing of a man and a woman in suits, a set of of the yen depreciation and appreciation exchange rate fluctuations of investments and the increase and decrease of savings balances, Vector Illustration
Free with trial Consumer purchasing power and consumption down color line icon, vector economic crisis and inflation. Finance and business recession, bankruptcy outline symbol with shopping cart and down arrow graph. Decrease line vectors Consumer purchasing power down color line icon. Consumer purchasing power and consumption down color line icon, vector economic crisis and inflation. Finance and. Consumer purchasing power and consumption down color line icon, vector economic crisis and inflation. Finance and business recession, bankruptcy outline symbol with shopping cart and down arrow graph
Free with trial This 3D illustration features a series of vertical bars arranged in a descending sequence, representing a decline in data. A smooth, continuous line graph follows the top of the bars, emphasizing the negative trajectory. The color palette uses shades of blue and light gray against a clean white background, creating a professional and minimalist aesthetic suitable for financial or analytical. Decrease line vectors A three dimensional bar chart showing a downward trend with a line graph overlay. This 3D illustration features a series of vertical bars arranged in a. This 3D illustration features a series of vertical bars arranged in a descending sequence, representing a decline in data. A smooth, continuous line graph follows the top of the bars, emphasizing the negative trajectory. The color palette uses shades of blue and light gray against a clean white background, creating a professional and minimalist aesthetic suitable for financial or analytical
Free with trial Visualization fading line chart illustration dec statistics, metrics performance, report comparison visualization fading line chart. Decrease line illustrations Visualization fading line chart. Illustration dec statistics, metrics performance, report comparison AI generated. visualization fading line chart illustration dec statistics, metrics performance, report comparison visualization fading line chart
Free with trial Visualization melting line chart illustration trend graph, temperature plot, axis series visualization melting line chart. Decrease line illustrations Visualization melting line chart. Illustration trend graph, temperature plot, axis series AI generated. visualization melting line chart illustration trend graph, temperature plot, axis series visualization melting line chart
Free with trial This minimalist graphic illustration features a bold red line chart indicating a significant decline in value. The visual includes a currency symbol and bar segments set against a clean background to represent economic loss or market downturn. The sharp downward arrow emphasizes a negative trajectory in fiscal data and business analytics. Decrease line vectors A red line graph showing a downward trend in financial performance. This minimalist graphic illustration features a bold red line chart indicating a significant. This minimalist graphic illustration features a bold red line chart indicating a significant decline in value. The visual includes a currency symbol and bar segments set against a clean background to represent economic loss or market downturn. The sharp downward arrow emphasizes a negative trajectory in fiscal data and business analytics
Free with trial A simple, minimalist black line icon showing a downward trending graph with a declining arrow, representing negative growth, market loss, or decreasing statistics. Decrease line vectors Minimalist Black Line Downward Trend Graph Arrow Icon. A simple, minimalist black line icon showing a downward trending graph with a declining arrow. A simple, minimalist black line icon showing a downward trending graph with a declining arrow, representing negative growth, market loss, or decreasing statistics
Free with trial Simple line drawing of a man and a woman in suits, a set of of the exchange rate fluctuations between a weaker and stronger dollar for investments and an increase or decrease in savings balance, Vector Illustration. Decrease line vectors Simple line drawing of a man and a woman in suits, a set of of the exchange rate fluctuations between a weaker. And stronger dollar for investments and an. Simple line drawing of a man and a woman in suits, a set of of the exchange rate fluctuations between a weaker and stronger dollar for investments and an increase or decrease in savings balance, Vector Illustration
Free with trial Graph laptop line icon. Neumorphic, Flat shadow, 3d buttons. Column chart sign. Growth diagram symbol. Line graph laptop icon. Social media icons. Vector. Decrease line illustrations Graph laptop line icon. Column chart sign. Neumorphic buttons. Vector. Graph laptop line icon. Neumorphic, Flat shadow, 3d buttons. Column chart sign. Growth. Graph laptop line icon. Neumorphic, Flat shadow, 3d buttons. Column chart sign. Growth diagram symbol. Line graph laptop icon. Social media icons. Vector
Free with trial The image depicts a bar chart with six yellow bars progressively decreasing in height from left to right, indicating a downward trend. A red line graph overlays the bars, showing a consistent decline with sharp drops at intervals, emphasizing the reduction trend visually. The combination of the bar chart and line graph highlights a significant decrease over a series of intervals or time periods. Decrease line illustrations Decline in bar chart with downward trend line overlay. The image depicts a bar chart with six yellow bars progressively decreasing in height from left to right. The image depicts a bar chart with six yellow bars progressively decreasing in height from left to right, indicating a downward trend. A red line graph overlays the bars, showing a consistent decline with sharp drops at intervals, emphasizing the reduction trend visually. The combination of the bar chart and line graph highlights a significant decrease over a series of intervals or time periods
Free with trial A series of white circles of varying sizes and brightness arranged in a straight line against a black background. The circles decrease in size and brightness from left to right, creating a gradient effect. This visual representation mimics celestial bodies like planets or stars, illustrating a transition in scale and luminosity. ai generative. Decrease line illustrations Celestial Bodies in a Gradual Scale of Brightness and Size. A series of white circles of varying sizes and brightness arranged in a straight line against a black. A series of white circles of varying sizes and brightness arranged in a straight line against a black background. The circles decrease in size and brightness from left to right, creating a gradient effect. This visual representation mimics celestial bodies like planets or stars, illustrating a transition in scale and luminosity. ai generative
Free with trial Hematology, anemia disease weakness symptom color line icon. Cardiology disease, hematology symptom or anemia diagnose linear vector symbol. Health care line icon or pictogram with weak and tired man. Decrease line vectors Hematology, anemia weakness symptom line icon. Hematology, anemia disease weakness symptom color line icon. Cardiology disease, hematology symptom or anemia. Hematology, anemia disease weakness symptom color line icon. Cardiology disease, hematology symptom or anemia diagnose linear vector symbol. Health care line icon or pictogram with weak and tired man
Free with trial Vector of thick red arrow pointing downward right in zigzag shape, symbolizing decline or decrease. Perfect for business, chart, and creative design themes. Decrease line vectors Vector of thick red arrow pointing downward right in zigzag shape, symbolizing decline or decrease. Perfect for business, chart, and creative design themes
Free with trial Gray bar chart with red line graph and downward arrow, illustrating decline, decrease, loss, and negative trend. Decrease line vectors Bar chart with downward red arrow, symbolizing decline. Gray bar chart with red line graph and downward arrow, illustrating decline, decrease, loss, and negative. Gray bar chart with red line graph and downward arrow, illustrating decline, decrease, loss, and negative trend
Free with trial Inefficient decrease like operational metric icon. flat linear trend modern sla logotype graphic stroke art design isolated on white. concept of easy business strategy or flexible crisis methodology. Decrease line vectors Inefficient decrease like operational metric icon. Flat linear trend modern sla logotype graphic stroke art design isolated on white. concept of easy business
Free with trial Bar chart and line graph showing financial data and trends. Generative AI. Decrease line illustrations Bar chart and line graph showing financial data and trends. Generative AI
Free with trial A set of three simple black arrows pointing down in a straight vertical row, ideal for direction or decrease symbols. Decrease line illustrations Three black downward arrows stacked in a vertical line. A set of three simple black arrows pointing down in a straight vertical row, ideal for direction or. A set of three simple black arrows pointing down in a straight vertical row, ideal for direction or decrease symbols
Free with trial Graph and diagram from planes with decrease. Finance and business concept. Vector Illustration. Decrease line vectors Graph and diagram from planes with decrease. Finance and business concept. Vector Illustration
Free with trial Line icons about arrows. Interface elements. Contains such icons as refresh, reload, loop, corner, turn, synchronize, resize, transfer and return. Editable stroke. Vector - 64 pixel perfect grid. Decrease line vectors Line icons about arrow. Interface elements. Pixel perfect 64x64 and editable stroke. Line icons about arrows. Interface elements. Contains such icons as refresh. Line icons about arrows. Interface elements. Contains such icons as refresh, reload, loop, corner, turn, synchronize, resize, transfer and return. Editable stroke. Vector - 64 pixel perfect grid
Free with trial A versatile vector line art set of medical mercury-in-glass thermometers. Includes detailed outlines of the thermometer body, a clear Celsius scale with a red 37-degree marker, and a collection of mercury columns at various heights. Perfect for creating custom temperature readings in medical manuals, educational infographics, and minimalist healthcare branding. Decrease line vectors Medical Mercury Thermometer Line Art and Construction Set. A versatile vector line art set of medical mercury-in-glass thermometers. Includes detailed outlines. A versatile vector line art set of medical mercury-in-glass thermometers. Includes detailed outlines of the thermometer body, a clear Celsius scale with a red 37-degree marker, and a collection of mercury columns at various heights. Perfect for creating custom temperature readings in medical manuals, educational infographics, and minimalist healthcare branding.
Free with trial Calendar graph line icon. Neumorphic, Flat shadow, 3d buttons. Column chart sign. Growth diagram symbol. Line calendar graph icon. Social media icons. Vector. Decrease line vectors Calendar graph line icon. Column chart sign. Neumorphic buttons. Vector. Calendar graph line icon. Neumorphic, Flat shadow, 3d buttons. Column chart sign. Growth. Calendar graph line icon. Neumorphic, Flat shadow, 3d buttons. Column chart sign. Growth diagram symbol. Line calendar graph icon. Social media icons. Vector
Free with trial This is an isometric 3D illustration depicting a dynamic data visualization. It features a combination of bar charts and a line graph, showcasing rising trends and fluctuating data points. The color palette includes shades of blue, teal, and coral, creating a modern and professional aesthetic. This graphic is ideal for representing financial reports, business analytics, market trends, growth, and performance metrics in a visually engaging and easy-to-understand format. Decrease line illustrations Isometric 3D Bar and Line Graph with Data Visualization. This is an isometric 3D illustration depicting a dynamic data visualization. It features a combination. This is an isometric 3D illustration depicting a dynamic data visualization. It features a combination of bar charts and a line graph, showcasing rising trends and fluctuating data points. The color palette includes shades of blue, teal, and coral, creating a modern and professional aesthetic. This graphic is ideal for representing financial reports, business analytics, market trends, growth, and performance metrics in a visually engaging and easy-to-understand format.
Free with trial Decreasing graph line icon. Neumorphic, Flat shadow, 3d buttons. Column chart sign. Market analytics symbol. Line decreasing graph icon. Social media icons. Vector. Decrease line vectors Decreasing graph line icon. Column chart sign. Neumorphic buttons. Vector. Decreasing graph line icon. Neumorphic, Flat shadow, 3d buttons. Column chart sign. Decreasing graph line icon. Neumorphic, Flat shadow, 3d buttons. Column chart sign. Market analytics symbol. Line decreasing graph icon. Social media icons. Vector
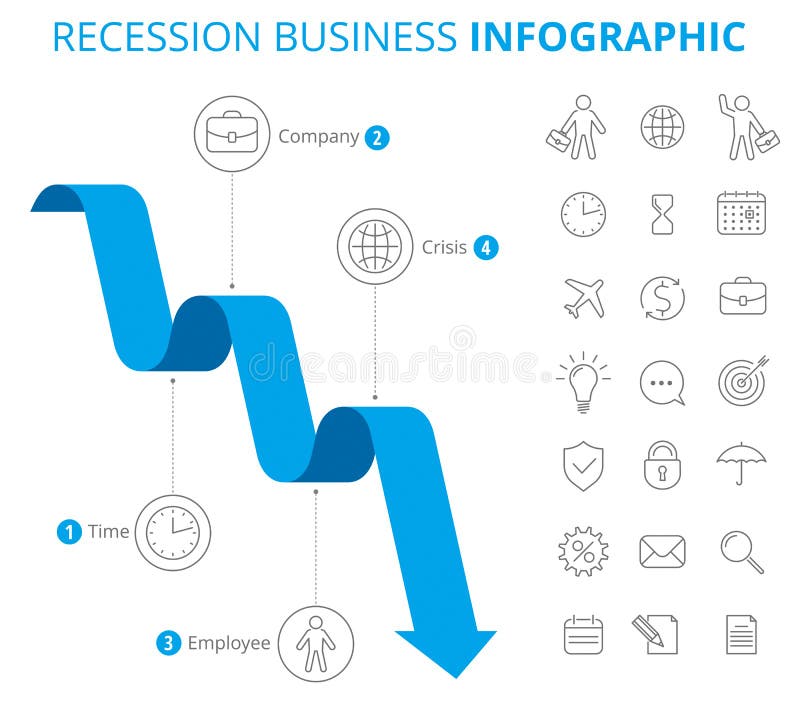
Free with trial Vector flat line infographic elements. Downward blue arrow and icons represent process of recession business. Vector illustration of decrease arrow and business icon set on white background. Decrease line vectors Recession Business Infographic Concept. Vector flat line infographic elements. Downward blue arrow and icons represent process of recession business. Vector. Vector flat line infographic elements. Downward blue arrow and icons represent process of recession business. Vector illustration of decrease arrow and business icon set on white background.
Free with trial Money loan line icon set. Credit score, low interest, discount card, mortgage percent, tax minimal vector illustration. Simple outline signs for bank application. 30x30 Pixel Perfect Editable Strokes. Decrease line vectors Money loan line icon set. Credit score, low interest, discount card, mortgage percent, tax minimal vector illustration. Simple outline signs for bank
Free with trial Line icons about finance. Financial concept. Contains such icons as piggy bank, bank, stock market, investment and accounts. Editable stroke. Vector - 64 pixel perfect grid. Decrease line vectors Line icons about finance. Financial concept. Pixel perfect 64x64 and editable stroke. Line icons about finance. Financial concept. Contains such icons as piggy. Line icons about finance. Financial concept. Contains such icons as piggy bank, bank, stock market, investment and accounts. Editable stroke. Vector - 64 pixel perfect grid
Free with trial Full screen and exit full screen icon set featuring maximize and minimize symbols, line-style directional arrows, resizing indicators, scalability concepts, and screen expansion controls. Clean suitable for websites, mobile applications, video players, software interfaces, dashboards, UI UX design, digital platforms, and responsive technology projects. Decrease line illustrations Full screen and exit full screen set icons, maximize and minimize line arrows sign, scalability, resizing in line style. Full screen and exit full screen icon. Full screen and exit full screen icon set featuring maximize and minimize symbols, line-style directional arrows, resizing indicators, scalability concepts, and screen expansion controls. Clean suitable for websites, mobile applications, video players, software interfaces, dashboards, UI UX design, digital platforms, and responsive technology projects.
Free with trial Web report line icon. Halftone dotted pattern. Gradient icon with grain shadow. Column graph sign. Growth diagram symbol. Line web report icon. Various designs. Vector. Decrease line illustrations Web report line icon. Column graph sign. Halftone dotted pattern. Vector. Web report line icon. Halftone dotted pattern. Gradient icon with grain shadow. Column. Web report line icon. Halftone dotted pattern. Gradient icon with grain shadow. Column graph sign. Growth diagram symbol. Line web report icon. Various designs. Vector
Free with trial Report document line icon. Neumorphic, Flat shadow, 3d buttons. Column graph sign. Growth diagram, pie chart symbol. Line report document icon. Social media icons. Vector. Decrease line vectors Report document line icon. Column graph sign. Neumorphic buttons. Vector. Report document line icon. Neumorphic, Flat shadow, 3d buttons. Column graph sign. Report document line icon. Neumorphic, Flat shadow, 3d buttons. Column graph sign. Growth diagram, pie chart symbol. Line report document icon. Social media icons. Vector
Free with trial The graph displays two lines, one green and one red. The green line is ascending, indicating growth or progress, while the red line is descending, suggesting a decline or decrease. Decrease line illustrations A graph with a green line and a red line. The graph displays two lines, one green and one red. The green line is ascending, indicating growth or progress, while. The graph displays two lines, one green and one red. The green line is ascending, indicating growth or progress, while the red line is descending, suggesting a decline or decrease
Free with trial Statistics line icon. Neumorphic, Flat shadow, 3d buttons. Column chart sign. Growth graph diagram symbol. Line graph chart icon. Social media icons. Vector. Decrease line vectors Statistics line icon. Column graph chart sign. Neumorphic buttons. Vector. Statistics line icon. Neumorphic, Flat shadow, 3d buttons. Column chart sign. Growth. Statistics line icon. Neumorphic, Flat shadow, 3d buttons. Column chart sign. Growth graph diagram symbol. Line graph chart icon. Social media icons. Vector
Free with trial Simple vector icon showing three bold black arrows pointing down in a vertical line, used for direction or decrease signs. Decrease line illustrations Three black downward arrows stacked in a row vector icon. Simple vector icon showing three bold black arrows pointing down in a vertical line, used for direction. Simple vector icon showing three bold black arrows pointing down in a vertical line, used for direction or decrease signs
Free with trial Sound control interface icons with plus and minus sign for volume adjustment. Vector thin line minimal illustrations. Decrease line vectors Sound control interface icons with plus and minus sign for volume adjustment. Vector thin line minimal illustrations
Free with trial Editable as a line illustration of a negative or downward going bar graph with a stick figure person standing on the infographic preventing the chart from going down with a rope as a small business owner in crisis. Decrease line illustrations Editable line illustration of a negative downward bar graph. Editable as a line illustration of a negative or downward going bar graph with a stick figure person. Editable as a line illustration of a negative or downward going bar graph with a stick figure person standing on the infographic preventing the chart from going down with a rope as a small business owner in crisis
Free with trial Analytics graph line icon. Continuous line big heart. Column chart sign. Growth diagram symbol. 3d hearts in heart shaped loop. Analytics graph single line ribbon. Loop curve pattern. Vector. Decrease line vectors Analytics graph line icon. Column chart sign. Continuous line big heart. Vector. Analytics graph line icon. Continuous line big heart. Column chart sign. Growth. Analytics graph line icon. Continuous line big heart. Column chart sign. Growth diagram symbol. 3d hearts in heart shaped loop. Analytics graph single line ribbon. Loop curve pattern. Vector
Free with trial Graph Declining with Arrow Line Art Minimalist Representation. AI generated. Decrease line vectors Graph Declining with Arrow Line Art Minimalist Representation. AI generated
Free with trial Up and down graph chart icon. Growth increase and decrease sign. Graph or diagram with arrow going up and down. Vector. Illustration. Decrease line vectors Up and down graph chart icon. Growth increase and decrease sign. Graph or diagram with arrow going up and down. Vector. Illustration
Free with trial Minimalist Line Art Black Outline Money Bag Sack with Downward Pointing Arrow Financial Loss Icon. Decrease line illustrations Black outline icon of a money bag with a downward arrow indicating financial loss or budget decrease. Minimalist Line Art Black Outline Money Bag Sack with. Minimalist Line Art Black Outline Money Bag Sack with Downward Pointing Arrow Financial Loss Icon
Free with trial Money loss and economic crisis, money market crash and global financial downturn, vector line icons. Economic crisis icons of bankruptcy, price decrease with money inflation and unemployment growth. Decrease line vectors Money loss and economic crisis, money market crash. And global financial downturn, vector line icons. Economic crisis icons of bankruptcy, price decrease with. Money loss and economic crisis, money market crash and global financial downturn, vector line icons. Economic crisis icons of bankruptcy, price decrease with money inflation and unemployment growth
Free with trial Money loss and economic crisis, money market crash and global financial downturn, vector line icons. Economic crisis icons of bankruptcy, price decrease with money inflation and unemployment growth. Decrease line vectors Money loss and economic crisis, money market crash. And global financial downturn, vector line icons. Economic crisis icons of bankruptcy, price decrease with. Money loss and economic crisis, money market crash and global financial downturn, vector line icons. Economic crisis icons of bankruptcy, price decrease with money inflation and unemployment growth
Free with trial Decrease icon design. Simple Vector illustrations. Decrease line vectors Decrease icon design. Simple Vector illustrations
Free with trial Decrease icon design. Simple Vector illustrations. Decrease line vectors Decrease icon design. Simple Vector illustrations
Free with trial Set of black and white line art icons featuring various chart types including pie charts, bar graphs, and zigzag trend lines in simple flat vector style. Generative AI. Decrease line vectors Black and white line art chart and graph icons set with pie and bar visuals. Set of black and white line art icons featuring various chart types including pie. Set of black and white line art icons featuring various chart types including pie charts, bar graphs, and zigzag trend lines in simple flat vector style. Generative AI
Free with trial A black declining trend line with arrow on a white background. Scalable format print and digital media. Decrease line vectors Black declining trend line with arrow white background line graph. A black declining trend line with arrow on a white background. Scalable format print and. A black declining trend line with arrow on a white background. Scalable format print and digital media
Free with trial Economic crisis icon of stock market crash and global financial downturn, line vector. Stock exchange market index fall down with money inflation and devaluation in economic crisis and trade recession. Decrease line vectors Economic crisis line icon of stock market crash. Economic crisis icon of stock market crash and global financial downturn, line vector. Stock exchange market. Economic crisis icon of stock market crash and global financial downturn, line vector. Stock exchange market index fall down with money inflation and devaluation in economic crisis and trade recession
Free with trial Down graph chart arrow drop icon. Decrease downward vector market decrease down trend. Decrease downward vector market. Decrease line vectors Down graph chart arrow drop icon. Decrease downward vector market decrease down trend. Down graph chart arrow drop icon. Decrease downward vector market
Free with trial Bar chart line graph vector icon features downward trend. Business market crisis highlights economic financial drop. eps 10. Decrease line vectors Bar chart line graph vector icon features downward trend. Business market crisis highlights economic financial drop. Eps 10
Free with trial Low water level icon vector concepts, line and silhouette style. Decrease line vectors Low water level icon vector concepts, line and silhouette style
Free with trial Presentation board line icon. Neumorphic, Flat shadow, 3d buttons. Column graph sign. Growth diagram symbol. Line presentation board icon. Social media icons. Vector. Decrease line vectors Presentation board line icon. Column graph sign. Neumorphic buttons. Vector. Presentation board line icon. Neumorphic, Flat shadow, 3d buttons. Column graph sign. Presentation board line icon. Neumorphic, Flat shadow, 3d buttons. Column graph sign. Growth diagram symbol. Line presentation board icon. Social media icons. Vector
Free with trial This image depicts a combination of line and bar graphs showing comparative data analysis over a period of time. Decrease line illustrations Comparative data analysis over time with line and bar graphs. This image depicts a combination of line and bar graphs showing comparative data analysis over a. This image depicts a combination of line and bar graphs showing comparative data analysis over a period of time
Free with trial Red zigzag arrow pointing downward. A simple red zigzag line with an arrow at the end pointing downward, indicating a downward trend or decrease. Decrease line illustrations Red zigzag arrow pointing downward. A simple red zigzag line with an arrow at the end pointing downward, indicating a downward trend or decrease
Free with trial A comprehensive collection of 15 minimalistic, black-and-white line icons designed for modern user interfaces, web applications, and wireframing projects. Featuring a clean, uniform stroke weight and flat geometric style, this vector set covers a wide range of categories. The collection includes essential symbols for: Technology & Hardware: A computer monitor, SIM memory card, software bug or malware icon, and a microphone. Navigation & Security: An entrance login door arrow, classic security key, and a download icon. Business & Law: A legal auction gavel, a declining bar chart showing financial loss, and a data Venn diagram. General Utilities: Environment trees, a smart home house icon, an abstract active user, chat speech bubbles, and a search magnifying glass. Decrease line vectors Vector line icon set featuring business analysis, legal gavel, security key, and communication symbols. A comprehensive collection of 15 minimalistic, black-and. A comprehensive collection of 15 minimalistic, black-and-white line icons designed for modern user interfaces, web applications, and wireframing projects. Featuring a clean, uniform stroke weight and flat geometric style, this vector set covers a wide range of categories. The collection includes essential symbols for: Technology & Hardware: A computer monitor, SIM memory card, software bug or malware icon, and a microphone. Navigation & Security: An entrance login door arrow, classic security key, and a download icon. Business & Law: A legal auction gavel, a declining bar chart showing financial loss, and a data Venn diagram. General Utilities: Environment trees, a smart home house icon, an abstract active user, chat speech bubbles, and a search magnifying glass.
Free with trial Financial crisis recession falling graph chart warning declining bar and line graph red exclamation coins documents cityscape abstract background Vector illustration. Decrease line illustrations Financial crisis recession falling graph chart warning declining bar and line graph red exclamation coins documents. Cityscape abstract background Vector
Free with trial A dark blue bar chart with four bars and a large blue downward arrow crossing through it, indicating a downward trend or decrease in value. Scalable format print and digital media. Decrease line vectors Bar chart with downward trend line blue arrow graph statistics. A dark blue bar chart with four bars and a large blue downward arrow crossing through it. A dark blue bar chart with four bars and a large blue downward arrow crossing through it, indicating a downward trend or decrease in value. Scalable format print and digital media
Free with trial Multiple curve line graph vector icon features data trend. Complex statistical analysis highlights market fluctuation. eps 10. Decrease line vectors Multiple curve line graph vector icon features data trend. Complex statistical analysis highlights market fluctuation. Eps 10
Free with trial Increase decrease radial arrows icon vector, expand shrink ui simple symbol, resize scale up down sign, expansion reduction element size tool, getting smaller bigger circle, maximize minimize image. Decrease line vectors Increase decrease radial arrows icon vector, expand shrink ui simple symbol, resize scale up down sign, expansion reduction. Element size tool, getting smaller. Increase decrease radial arrows icon vector, expand shrink ui simple symbol, resize scale up down sign, expansion reduction element size tool, getting smaller bigger circle, maximize minimize image
Free with trial Savings decrease and financial shortage icons set. Vector made with AI. Decrease line vectors Savings decrease and financial shortage icons set. AI generated. Vector made with AI. Savings decrease and financial shortage icons set. Vector made with AI
Free with trial Minimalist style gradient blue diagram showing downward trend line graph on black background representing economic decline or loss. Decrease line vectors Downward trend line graph on black background for infographic. Minimalist style gradient blue diagram showing downward trend line graph on black background. Minimalist style gradient blue diagram showing downward trend line graph on black background representing economic decline or loss.
Free with trial Report statistics line icon. Continuous line with share plane. Column graph sign. Growth diagram symbol. Five star rate review in speech bubble. Report statistics single line ribbon. Vector. Decrease line illustrations Report statistics line icon. Column graph sign. Continuous line with plane. Vector. Report statistics line icon. Continuous line with share plane. Column graph. Report statistics line icon. Continuous line with share plane. Column graph sign. Growth diagram symbol. Five star rate review in speech bubble. Report statistics single line ribbon. Vector
 Sign in