Free with trial Up and down profit arrows seamless pattern isolated on black background. Simple background. Decrease percentage vectors Up and down profit arrows seamless pattern isolated on black background
Free with trial Graphic visual representation of bar chart data analysis for business growth and market trends ,Generative ai. Decrease percentage illustrations Comprehensive data analysis, visualizing business growth and market trends through bar chart graphics. Graphic visual representation of bar chart data analysis for business growth and market trends ,Generative ai
Free with trial Green bar graph illustrating continuous growth or progress. Decrease percentage illustrations Green bar graph illustrating continuous growth or progress.
Free with trial Up and down profit arrows seamless pattern isolated on white background. Simple background. Decrease percentage vectors Up and down profit arrows seamless pattern isolated on white background
Free with trial A stark white line graph depicts a significant downward trend with sharp fluctuations against a dark grid. Decrease percentage illustrations Sharp downward trend illustrated by a jagged white line graph on a black grid background. A stark white line graph depicts a significant downward trend with sharp fluctuations against a dark grid
Free with trial A 3D rendered graphic featuring a large, smooth blue arrow pointing downwards. Attached to the side of the arrow is a small, round pink icon containing a white percent symbol. The entire graphic is isolated on a white background, suggesting a concept related to discounts, price reductions, or negative trends. Decrease percentage illustrations 3D Render of a Blue Downward Arrow with a Pink Circle and Percent Symbol down arrow. A 3D rendered graphic featuring a large, smooth blue arrow pointing downwards. Attached to the side of the arrow is a small, round pink icon containing a white percent symbol. The entire graphic is isolated on a white background, suggesting a concept related to discounts, price reductions, or negative trends
Free with trial A vibrant red 80% sign, perfect for sales and promotions, stands out against a clean white background, ideal for business and marketing. Decrease percentage illustrations Eye-catching 80% off sign in bold red, ideal for promotional use and sales announcements. A vibrant red 80% sign, perfect for sales and promotions, stands out against a clean white background, ideal for business and marketing
Free with trial A close-up view of a red stock market chart displaying a strong downward trend. Candlestick bars and a fluctuating line graph indicate a significant decline in stock prices. Red arrows point downwards, emphasizing the negative movement. The background is dark with a subtle grid pattern and a bright light source on the left. Decrease percentage illustrations Red Stock Market Chart Showing Downward Trend graph. A close-up view of a red stock market chart displaying a strong downward trend. Candlestick bars and a fluctuating line graph indicate a significant decline in stock prices. Red arrows point downwards, emphasizing the negative movement. The background is dark with a subtle grid pattern and a bright light source on the left
Free with trial Businessmans hands hold burning green money. Financial inflation. Recession or economy crisis. Banknotes in fire flame. Wealth loss. Currency devaluation. Blazing dollar. Cash ignition. Vector concept. Decrease percentage vectors Businessmans hands hold burning green money. Financial inflation. Recession or economy crisis. Banknotes in fire flame. Wealth
Free with trial A clean and modern isometric bar graph illustration. Three colored bars, blue, green, and yellow, represent data points with corresponding numerical values displayed above each bar. The graphic is set against a white background, making it suitable for various presentations, reports, or website designs related to data analysis, business, or education. The simple design offers a clear visual representation of data comparison. Decrease percentage illustrations Isometric Bar Graph Illustrating Data and Statistics. A clean and modern isometric bar graph illustration. Three colored bars, blue, green, and yellow, represent data points with corresponding numerical values displayed above each bar. The graphic is set against a white background, making it suitable for various presentations, reports, or website designs related to data analysis, business, or education. The simple design offers a clear visual representation of data comparison.
Free with trial Isometric business analyst professional composition with conceptual financial analysis icons and people vector illustration. Decrease percentage vectors Business Growth Arrows Composition. Isometric business analyst professional composition with conceptual financial analysis icons and people vector illustration
Free with trial Economic decline, financial loss, market trends, business analysis, payment reminder, schedule planning. Downward trend graph with sad face icon. Economic decline and financial loss. Decrease percentage vectors Economic Decline and Financial Trends with Calendar Reminder and Graph Symbols. Economic decline, financial loss, market trends, business analysis, payment reminder, schedule planning. Downward trend graph with sad face icon. Economic decline and financial loss
Free with trial A striking 3D render showcases the numbers '638' in a brushed gold metallic finish. The numbers have a substantial, three-dimensional quality with subtle highlights and shadows that emphasize their form. They are positioned against a soft, out-of-focus background of deep blue and purple hues, creating a sense of depth and sophistication. This image is ideal for representing data, statistics, financial figures, achievements, or any concept related to numerical value and success. Decrease percentage illustrations Golden 3D Numbers 638 with Metallic Texture and Soft Bokeh Background. A striking 3D render showcases the numbers '638' in a brushed gold metallic finish. The numbers have a substantial, three-dimensional quality with subtle highlights and shadows that emphasize their form. They are positioned against a soft, out-of-focus background of deep blue and purple hues, creating a sense of depth and sophistication. This image is ideal for representing data, statistics, financial figures, achievements, or any concept related to numerical value and success.
Free with trial This visually striking image depicts a futuristic financial concept. Scattered coins on a dark surface are illuminated by glowing neon percentages (1%, 10%, 20%, 30%, 50%, 100%). A subtle network of lines and lights in the background suggests a digital or abstract representation of data and growth. The composition evokes themes of investment, progress, and financial targets, suitable for business, finance, and technology-related content. Decrease percentage illustrations Digital Growth and Financial Percentages. This visually striking image depicts a futuristic financial concept. Scattered coins on a dark surface are illuminated by glowing neon percentages (1%, 10%, 20%, 30%, 50%, 100%). A subtle network of lines and lights in the background suggests a digital or abstract representation of data and growth. The composition evokes themes of investment, progress, and financial targets, suitable for business, finance, and technology-related content.
Free with trial A bold, three-dimensional red symbol representing a twenty-five percent discount is prominently displayed. The metallic, glossy surface of the numbers and the percent sign reflects light, giving it a striking appearance. The graphic is set against a stark black background, emphasizing the discount offer. Decrease percentage illustrations 3D Red Minus Twenty- Five Percent Discount Symbol with Metallic Sheen on Black Background. A bold, three-dimensional red symbol representing a twenty-five percent discount is prominently displayed. The metallic, glossy surface of the numbers and the percent sign reflects light, giving it a striking appearance. The graphic is set against a stark black background, emphasizing the discount offer
Free with trial This image presents a detailed analysis of business performance metrics, including market share, quarterly sales, and key performance indicators (KPIs. Decrease percentage illustrations Comprehensive business performance metrics and growth analysis. This image presents a detailed analysis of business performance metrics, including market share, quarterly sales, and key performance indicators (KPIs
Free with trial Simple vector design of a percent icon. Features a large diagonal slash with two hollow circles, one at the top left and one at the bottom right. The lines are bold and black, set against a white background, creating a minimalist and clean appearance. Decrease percentage vectors Percent outline icon, simple vector design. Simple vector design of a percent icon. Features a large diagonal slash with two hollow circles, one at the top left and one at the bottom right. The lines are bold and black, set against a white background, creating a minimalist and clean appearance.
Free with trial Eight battery icons showing a gradual charging process from nearly empty to full, using green and light-yellow gradients to represent charge levels. Decrease percentage illustrations Eight battery icons showing a gradual charging process from near
Free with trial 3D black sale icons with red and yellow arrows and white percent signs. Modern discount and price tag design for Black Friday promotion editable vector banner element for business and web marketing. Decrease percentage vectors 3D black sale icons with red and yellow arrows and white percent signs. Modern discount and price tag design for Black
Free with trial A clean and modern graphic featuring the number '5%' prominently displayed on a soft, golden gradient background. A bright, circular spotlight effect emanates from the right side, creating a sense of illumination and focus. This versatile image is ideal for representing discounts, sales, special offers, promotions, or any concept related to a five percent value. The minimalist design and ample negative space make it perfect for adding text overlays or integrating into various marketing materials. Decrease percentage illustrations Five Percent Discount - Clean Gradient Background with Spotlight Effect. A clean and modern graphic featuring the number '5%' prominently displayed on a soft, golden gradient background. A bright, circular spotlight effect emanates from the right side, creating a sense of illumination and focus. This versatile image is ideal for representing discounts, sales, special offers, promotions, or any concept related to a five percent value. The minimalist design and ample negative space make it perfect for adding text overlays or integrating into various marketing materials.
Free with trial Black and white line graph comparing nominal and real return over time with axes labeled. Decrease percentage illustrations Black and white line graph showing nominal and real return over time chart nominal return. Black and white line graph comparing nominal and real return over time with axes labeled
Free with trial A Close-up of a red 3D percent sign magnified by a metallic magnifying glass on a white background, symbolizing financial analysis and discounts. Decrease percentage illustrations Close-up of a red 3D percent sign magnified by a metallic magnifying glass on a white background, symbolizing financial analysis
Free with trial Collection of business growth and financial analysis icons featuring bar charts and arrows with editable line art and flat shape style. Editable vector icon set. Decrease percentage vectors Collection of business growth and financial analysis icons featuring bar charts and arrows with editable line art and flat shape
Free with trial Stylized data illustrates financial increase using dollar signs, bar graphs, and arrows. Some data trends down while other data trends up, showing potential profits and losses. Decrease percentage illustrations Stock Market Data Shows Economic Growth and Potential Loss in the Future. Stylized data illustrates financial increase using dollar signs, bar graphs, and arrows. Some data trends down while other data trends up, showing potential profits and losses.
Free with trial Displaying dashboard grid showing fluctuating blue and red line graphs with metallic green sphere. Analytics, investment, data visualization, technology, finance, bar chart, dashboard. Decrease percentage illustrations Displaying dashboard grid showing fluctuating blue and red line graphs with metallic green sphere
Free with trial Illustration of a business activities. Decrease percentage vectors Illustration of a business activities
Free with trial Illustration of a business activities. Decrease percentage vectors Illustration of a business activities
Free with trial Illustration of a business activities. Decrease percentage vectors Illustration of a business activities
Free with trial Illustration of a business activities. Decrease percentage vectors Illustration of a business activities
Free with trial Illustration of a business activities. Decrease percentage vectors Illustration of a business activities
Free with trial Illustration of a business activities. Decrease percentage vectors Illustration of a business activities
Free with trial Illustration of a business activities. Decrease percentage vectors Illustration of a business activities
Free with trial A bold, three-dimensional rendering of the number '10' followed by a percent sign, all in a vibrant, glossy orange. The digits are rounded and have a smooth, reflective surface, casting subtle shadows on a clean white background. This graphic is ideal for representing discounts, sales, percentages, financial concepts, and marketing promotions. Decrease percentage illustrations Shiny Orange 10 Percent Discount Symbol. A bold, three-dimensional rendering of the number '10' followed by a percent sign, all in a vibrant, glossy orange. The digits are rounded and have a smooth, reflective surface, casting subtle shadows on a clean white background. This graphic is ideal for representing discounts, sales, percentages, financial concepts, and marketing promotions.
Free with trial A hand in a suit jacket holds up an upward arrow for quality and a downward arrow for cost against a dark background with glowing particles. Decrease percentage illustrations Hand holding upward quality and downward cost percentages business open palm. A hand in a suit jacket holds up an upward arrow for quality and a downward arrow for cost against a dark background with glowing particles
Free with trial Fitness concept with water bottle and yellow jump rope on flatlay background,. Decrease percentage illustrations Fitness concept with water bottle and yellow jump rope on flatlay background
Free with trial Four vector icons of the percent sign are displayed on a white background. The designs include: a solid black percent sign, a percent sign with outlined circles, one with a bold diagonal line and circular elements, and one with a thin outline. Decrease percentage vectors Icon set percent sign, simple vector design. Four vector icons of the percent sign are displayed on a white background. The designs include: a solid black percent sign, a percent sign with outlined circles, one with a bold diagonal line and circular elements, and one with a thin outline.
Free with trial A person in a suit uses a stylus on a tablet displaying a quality cost checklist with upward and downward arrows. Decrease percentage illustrations Businessman using stylus on tablet with quality cost checklist and award image. A person in a suit uses a stylus on a tablet displaying a quality cost checklist with upward and downward arrows
Free with trial A collage of various hand-drawn charts and graphs in shades of blue, illustrating business growth, data analysis, and financial trends. The collection includes bar charts, line graphs, and pie charts, all rendered with a sketchy, artistic style. These visuals are perfect for presentations, reports, or any project requiring a dynamic and informative representation of data and progress. Decrease percentage illustrations Hand-Drawn Business Growth Charts and Graphs Collection. A collage of various hand-drawn charts and graphs in shades of blue, illustrating business growth, data analysis, and financial trends. The collection includes bar charts, line graphs, and pie charts, all rendered with a sketchy, artistic style. These visuals are perfect for presentations, reports, or any project requiring a dynamic and informative representation of data and progress.
Free with trial A modern business analytics dashboard showcasing key performance indicators (KPIs) with engaging charts and graphs for data visualization Ideal for presentations and reports. Generative AI. Decrease percentage illustrations Business Analytics Dashboard Graphs Charts Data Performance Growth Metrics KPI. A modern business analytics dashboard showcasing key performance indicators (KPIs) with engaging charts and graphs for data visualization Ideal for presentations and reports. Generative AI
Free with trial Graph showing radioactive decay over time. Decrease percentage illustrations Radioactive Decay Chart Half Life. Graph showing radioactive decay over time
Free with trial Cpi word block on white background. Decrease percentage illustrations Cpi word block on white
Free with trial Featuring "LOW PRICE" text on a lightbox overlaid with downward candlestick charts and percentage performance data. Decrease percentage illustrations Low price trends and market entry opportunities reflected through real-time financial metrics and volatile trading indicators. Featuring 'LOW PRICE' text on a. Featuring "LOW PRICE" text on a lightbox overlaid with downward candlestick charts and percentage performance data.
Free with trial Financial analysis scene showing colorful graphs and charts with a wooden block displaying a house icon and the year 2026, conveying real estate market growth and investment trends, ideal for finance and real estate marketing materials. Decrease percentage illustrations Financial Growth Charts with Wooden House Block and Year 2026. Financial analysis scene showing colorful graphs and charts with a wooden block displaying a house icon and the year 2026, conveying real estate market growth and investment trends, ideal for finance and real estate marketing materials
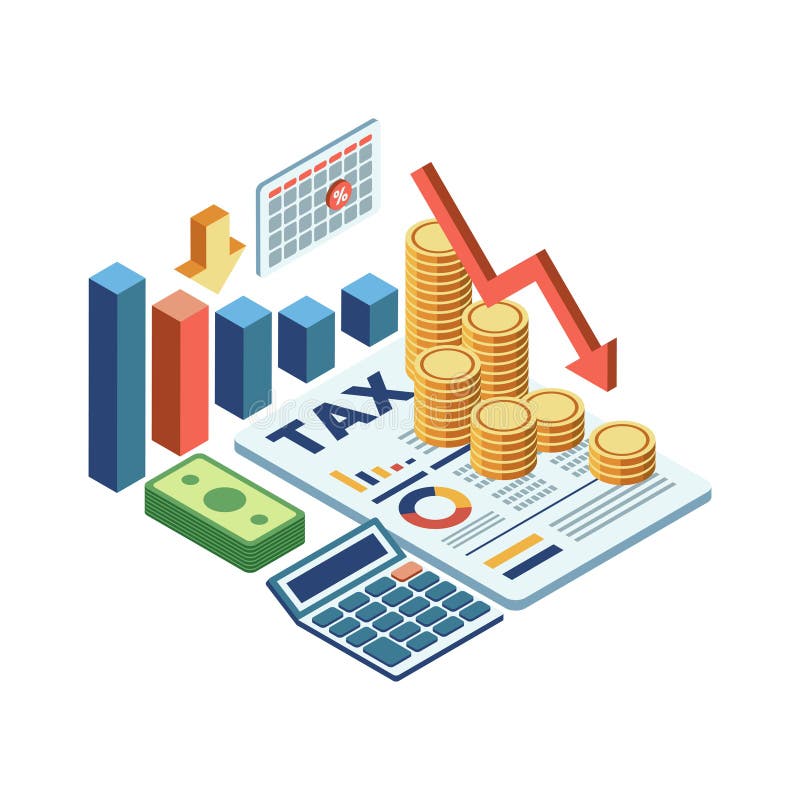
Free with trial Isometric Tax Deduction Concept with Financial Elements. Tax Deduction and Financial Management Concept. Decrease percentage vectors Isometric Tax Deduction Concept with Financial Elements
Free with trial A large, bold, three-dimensional red number six followed by a red percent symbol, isolated on a clean white background. Decrease percentage illustrations Bold red six percent symbol on white background. A large, bold, three-dimensional red number six followed by a red percent symbol, isolated on a clean white background
Free with trial Colorful Percent Symbol with Gradient Slash on White Background. Decrease percentage vectors Colorful Percent Symbol with Gradient Slash on White Background
Free with trial A black shopping basket icon displays various financial charts and graphs in blue and green, indicating business analytics. Decrease percentage illustrations Shopping basket icon with financial charts and graphs on white background cart retail. A black shopping basket icon displays various financial charts and graphs in blue and green, indicating business analytics
Free with trial Interest rate line icons on white, eps 10 file, easy to edit. Decrease percentage vectors Interest rate line icons on white
Free with trial A businessman in a suit holds a digital display showing arrows and percentages, representing the concept of reducing costs while improving quality. The image portrays business strategy and efficiency. Decrease percentage illustrations Businessman presents cost reduction and quality improvement concept. A businessman in a suit holds a digital display showing arrows and percentages, representing the concept of reducing costs while improving quality. The image portrays business strategy and efficiency
Free with trial Coins, Donation money and Decreasing graph line icons for web app. Glare of light effect. Message icon. Pack of Cashback card, Bitcoin, Salary pictogram icons. Vector. Decrease percentage vectors Coins, Donation money and Decreasing graph line icons for web app. Pictogram icon. Glare of light icons. Vector. Coins, Donation money and Decreasing graph line icons for web app. Glare of light effect. Message icon. Pack of Cashback card, Bitcoin, Salary pictogram icons. Vector
Free with trial A comprehensive set of line icons illustrating various e-commerce, retail, and shopping concepts, including payment, discounts, returns, and logistics. Rendered by Ai, this collection provides essential visual tools for web and app interfaces related to buying and selling. Decrease percentage illustrations E-commerce and Shopping Cart Icon Set. A comprehensive set of line icons illustrating various e-commerce, retail, and shopping concepts, including payment, discounts, returns, and logistics. Rendered by Ai, this collection provides essential visual tools for web and app interfaces related to buying and selling
Free with trial The image features a bold red downward-pointing arrow with a white zero percent symbol ('0%') centered inside it. This design is often used to indicate a zero percent change or a complete reduction, typically in contexts such as sales, interest rates, or financial metrics. Decrease percentage illustrations Red downward arrow with zero percent symbol. The image features a bold red downward-pointing arrow with a white zero percent symbol ('0%') centered inside it. This design is often used to indicate a zero percent change or a complete reduction, typically in contexts such as sales, interest rates, or financial metrics
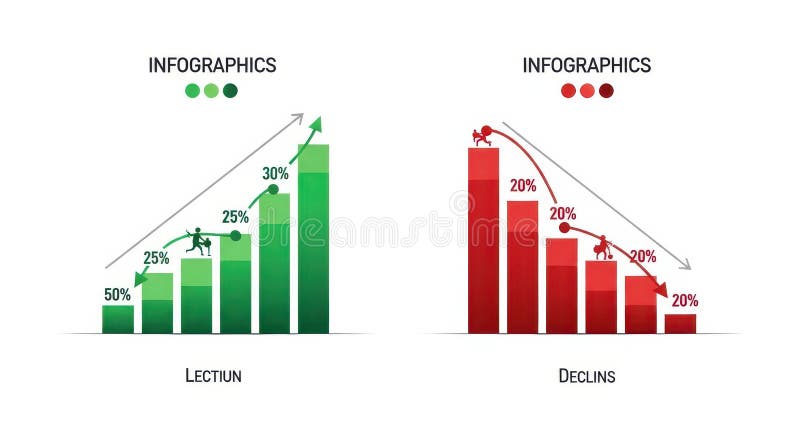
Free with trial The image displays two infographics side by side. the left infographic, titled "lection," depicts a green bar graph showing growth, starting at 50% and increasing to 30% with a figure climbing the bars. an upward-pointing arrow indicates positive growth. the right infographic, titled "declins," shows a red bar graph illustrating decline, starting at 20% and decreasing to 20% with a figure falling down the bars. a downward-pointing arrow indicates negative growth. Decrease percentage illustrations Infographics showing growth and decline charts. the image displays two infographics side by side. the left infographic, titled "lection," depicts a green bar graph showing growth, starting at 50% and increasing to 30% with a figure climbing the bars. an upward-pointing arrow indicates positive growth. the right infographic, titled "declins," shows a red bar graph illustrating decline, starting at 20% and decreasing to 20% with a figure falling down the bars. a downward-pointing arrow indicates negative growth.
Free with trial This is a 3D rendering of a light blue percent symbol, featuring soft lighting and rounded edges, set against a clean transparent backdrop. Decrease percentage vectors Light blue percent sign 3D render graphic on transparent background. This is a 3D rendering of a light blue percent symbol, featuring soft lighting and rounded edges, set against a clean transparent backdrop.
Free with trial Computer screen displaying a webinar with a presenter explaining graphs and charts, recording indicators, audio, and HD video tags. Ideal for e-learning, remote work, business, analytics. Decrease percentage vectors Online Webinar on Business Metrics with Recording and Data Analytics Representation. Computer screen displaying a webinar with a presenter explaining graphs and charts, recording indicators, audio, and HD video tags. Ideal for e-learning, remote work, business, analytics
Free with trial A symbolic representation of financial growth, illustrating the concept of zero percent interest with a plant sprouting from a coin-filled jar. Decrease percentage illustrations A small plant grows from a jar filled with coins, displaying 0 interest. A symbolic representation of financial growth, illustrating the concept of zero percent interest with a plant sprouting from a coin-filled jar
Free with trial This infographic shows business data with both an increasing chart with 20% growth and a decreasing chart with 10% decline, which can be used to illustrate business concepts. Decrease percentage illustrations Infographic Showing Business Growth and Decline. This infographic shows business data with both an increasing chart with 20% growth and a decreasing chart with 10% decline, which can be used to illustrate business concepts
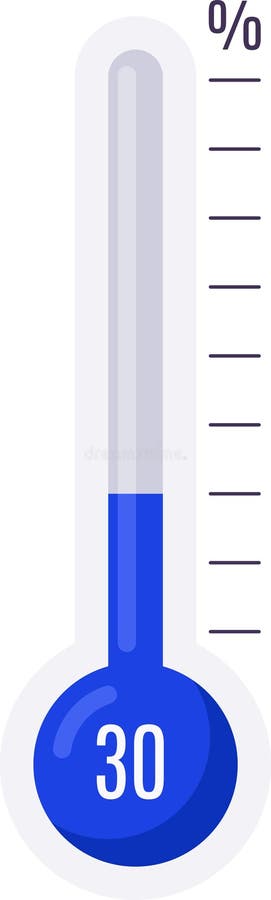
Free with trial Thermometer indicating 30 percent, symbolizing progress, achievement, temperature measurement, or goal completion within a specific range. Decrease percentage vectors Thermometer indicating 30 percent, symbolizing progress, achievement, temperature measurement, or goal completion within
Free with trial A futuristic digital infographic showcasing business strategy and growth. The scene features glowing charts, bar graphs, circular progress indicators with percentages, and stacks of gold coins, symbolizing financial success. A prominent neon arrow curves upwards, indicating a positive trend and progress. The dark, high-tech background enhances the visual impact, making it ideal for presentations on finance, business, technology, and data analysis. Decrease percentage illustrations Digital Growth Infographic with Financial Data and Upward Trend Arrow. A futuristic digital infographic showcasing business strategy and growth. The scene features glowing charts, bar graphs, circular progress indicators with percentages, and stacks of gold coins, symbolizing financial success. A prominent neon arrow curves upwards, indicating a positive trend and progress. The dark, high-tech background enhances the visual impact, making it ideal for presentations on finance, business, technology, and data analysis.
Free with trial Six red arrows with percent symbols point downward. They are arranged in two rows of three on a white background. Each arrow is three-dimensional, with a bold, white percent sign prominently displayed on the front. The arrows are uniformly spaced, creating a symmetrical and orderly pattern. Decrease percentage vectors Six red arrows with percent symbols pointing down on a black background. Six red arrows with percent symbols point downward. They are arranged in two rows of three on a white background. Each arrow is three-dimensional, with a bold, white percent sign prominently displayed on the front. The arrows are uniformly spaced, creating a symmetrical and orderly pattern.
Free with trial Week over week on white paper background. Decrease percentage illustrations Week over week on white paper
Free with trial Year over year on white paper background. Decrease percentage illustrations Year over year on white paper
Free with trial This image displays a man holding house icons with financial symbols above, illustrating real estate investment. Perfect for conveying property market, financial growth, and home ownership concepts. Ideal for finance and investment related projects. Decrease percentage illustrations Real estate investment concept with houses and financial symbols on hand. This image displays a man holding house icons with financial symbols above, illustrating real estate investment. Perfect for conveying property market, financial growth, and home ownership concepts. Ideal for finance and investment related projects
Free with trial Black square icon with octagonal corners featuring a white percent sign (%). The design is simple and minimalistic, with two circular dots and a diagonal line representing the percent symbol. Decrease percentage vectors Percent icon, simple vector design. Black square icon with octagonal corners featuring a white percent sign (%). The design is simple and minimalistic, with two circular dots and a diagonal line representing the percent symbol.
Free with trial 3D rendering of a blue "10%" symbol. It represents a ten percent discount, rate or promotion, with a modern, shiny aesthetic. Decrease percentage vectors Ten Percent Sign in Blue, Shiny and Modern Look on transparent background. 3D rendering of a blue "10%" symbol. It represents a ten percent discount, rate or promotion, with a modern, shiny aesthetic.
Free with trial Percent word block on white background. Decrease percentage illustrations Percent word block on white
Free with trial Annual growth rate on white paper background. Decrease percentage illustrations Annual growth rate on white paper
Free with trial Deposit insurance vector symbol. percent shiled icon silhouette. Decrease percentage illustrations Deposit insurance vector symbol