Free with trial Set of black and white vector icons featuring smiling percent symbols combined with upward and downward arrows and a smiling bar chart, illustrating positive and negative trends. Generative AI. Decrease percentage vectors Black and white smiling percent symbols with arrows and bar chart vector icons. Set of black and white vector icons featuring smiling percent symbols combined with upward and downward arrows and a smiling bar chart, illustrating positive and negative trends. Generative AI
Free with trial Modern laptop shows real time financial data analytics with line graphs bar charts and a pie chart. Decrease percentage illustrations Laptop Screen Displaying Live Business Data Charts and Analytics. Modern laptop shows real time financial data analytics with line graphs bar charts and a pie chart
Free with trial This image shows a circular badge with a scalloped edge and a blue gradient background. The badge prominently features the text '25% OFF' in bold, white and light blue colors, indicating a discount promotion. It is likely used for advertising sales or special offers in retail or online shopping environments. Decrease percentage illustrations A promotional badge displaying a twenty-five percent discount offer. This image shows a circular badge with a scalloped edge and a blue gradient background. The badge prominently features the text '25% OFF' in bold, white and light blue colors, indicating a discount promotion. It is likely used for advertising sales or special offers in retail or online shopping environments
Free with trial 3d illustration shopping trolley with bow and bags on white background. Decrease percentage illustrations 3d illustration shopping trolley with bow and bags
Free with trial A bold red 10% graphic signifying a discount or sale. Perfect for marketing and advertising materials. Decrease percentage illustrations Ten Percent Off Sale Discount Promotion Offer Red Bold Numbers Graphics Design. A bold red 10% graphic signifying a discount or sale. Perfect for marketing and advertising materials
Free with trial Vector shiny Orange Red 3d sign 100 percents. suitable for use on advertising banners, leaflets, posters, flyers and any promotional items. Seasonal discounts, Black Friday, the interest rate, etc. Decrease percentage illustrations Discount one hundredpercent. Isometric style. Vector shiny Orange Red 3d sign 100 percents. suitable for use on advertising banners, leaflets, posters, flyers and any promotional items. Seasonal discounts, Black Friday, the interest rate, etc.
Free with trial Dollar price up and down outline icon isolated on white background. USD coin growth and decline sign symbol vector. Decrease percentage vectors Dollar price up and down outline icon isolated on white background. USD coin growth and decline sign symbol
Free with trial 3D bar chart illustrating decline, financial loss, or negative growth. Purple bars and arrow on white. Decrease percentage illustrations Purple bar graph showing downward trend with arrow, financial concept. 3D bar chart illustrating decline, financial loss, or negative growth. Purple bars and arrow on white
Free with trial The image shows a rectangular label with a white background and a bold red border. The label prominently displays the text '20%' in a large, red font, indicating a twenty percent discount. Decrease percentage illustrations A bold red and white label displaying a twenty percent discount. The image shows a rectangular label with a white background and a bold red border. The label prominently displays the text '20%' in a large, red font, indicating a twenty percent discount
Free with trial Percent icon down on white background. Interest rate reduction sign. flat style. Decrease percentage vectors Percent icon down on white background. Interest rate reduction sign. flat style
Free with trial Wooden house with sign percent on concrete table. Business and financial success concept. 3D Rendering. Decrease percentage illustrations Wooden house with sign percent
Free with trial Model of house shot on graph depicting mortgage rates. image. Decrease percentage illustrations Model of house shot on graph depicting mortgage rates.
Free with trial Model of house shot on graph depicting mortgage rates. image. Decrease percentage illustrations Model of house shot on graph depicting mortgage rates.
Free with trial Model of house shot on graph depicting mortgage rates. image. Decrease percentage illustrations Model of house shot on graph depicting mortgage rates.
Free with trial Model of house shot on graph depicting mortgage rates. image. Decrease percentage illustrations Model of house shot on graph depicting mortgage rates.
Free with trial Model of house shot on graph depicting mortgage rates. image. Decrease percentage illustrations Model of house shot on graph depicting mortgage rates.
Free with trial Model of house shot on graph depicting mortgage rates. image. Decrease percentage illustrations Model of house shot on graph depicting mortgage rates.
Free with trial Model of house shot on graph depicting mortgage rates. image. Decrease percentage illustrations Model of house shot on graph depicting mortgage rates.
Free with trial Model of house shot on graph depicting mortgage rates. image. Decrease percentage illustrations Model of house shot on graph depicting mortgage rates.
Free with trial Model of house shot on graph depicting mortgage rates. image. Decrease percentage illustrations Model of house shot on graph depicting mortgage rates.
Free with trial Model of house shot on graph depicting mortgage rates. image. Decrease percentage illustrations Model of house shot on graph depicting mortgage rates.
Free with trial Model of house shot on graph depicting mortgage rates. image. Decrease percentage illustrations Model of house shot on graph depicting mortgage rates.
Free with trial Model of house shot on graph depicting mortgage rates. image. Decrease percentage illustrations Model of house shot on graph depicting mortgage rates.
Free with trial Model of house shot on graph depicting mortgage rates. image. Decrease percentage illustrations Model of house shot on graph depicting mortgage rates.
Free with trial Model of house shot on graph depicting mortgage rates. image. Decrease percentage illustrations Model of house shot on graph depicting mortgage rates.
Free with trial Model of house shot on graph depicting mortgage rates. image. Decrease percentage illustrations Model of house shot on graph depicting mortgage rates.
Free with trial Model of house shot on graph depicting mortgage rates. image. Decrease percentage illustrations Model of house shot on graph depicting mortgage rates.
Free with trial Model of house shot on graph depicting mortgage rates. image. Decrease percentage illustrations Model of house shot on graph depicting mortgage rates.
Free with trial Model of house shot on graph depicting mortgage rates. image. Decrease percentage illustrations Model of house shot on graph depicting mortgage rates.
Free with trial Model of house shot on graph depicting mortgage rates. image. Decrease percentage illustrations Model of house shot on graph depicting mortgage rates.
Free with trial Model of house shot on graph depicting mortgage rates. image. Decrease percentage illustrations Model of house shot on graph depicting mortgage rates.
Free with trial Model of house shot on graph depicting mortgage rates. image. Decrease percentage illustrations Model of house shot on graph depicting mortgage rates.
Free with trial Model of house shot on graph depicting mortgage rates. image. Decrease percentage illustrations Model of house shot on graph depicting mortgage rates.
Free with trial Model of house shot on graph depicting mortgage rates. image. Decrease percentage illustrations Model of house shot on graph depicting mortgage rates.
Free with trial Model of house shot on graph depicting mortgage rates. image. Decrease percentage illustrations Model of house shot on graph depicting mortgage rates.
Free with trial Model of house shot on graph depicting mortgage rates. image. Decrease percentage illustrations Model of house shot on graph depicting mortgage rates.
Free with trial House icon on wooden cube from stack block with percent and rise arrow, Real estate property investment concept. Asset management, Interest rates, inflation, loan mortgage, increase tax. 3d render. Decrease percentage illustrations House icon on wooden cube from stack block with percent and rise arrow
Free with trial Up and down percent outline icon on circle line. Lower and higher arrow sign symbol vector. Decrease percentage vectors Up and down percent outline icon on circle line. Lower and higher arrow sign symbol
Free with trial The image depicts a city map overlaid with stock market trend lines, illustrating various financial movements. Different colored lines represent upward and downward trends with percentage changes, indicating stock performance or indices across different regions. The visual juxtaposition of financial data against a geographical layout highlights how market movements correlate with specific. Decrease percentage illustrations Stock market trends and performance analysis on a city map background. The image depicts a city map overlaid with stock market trend lines, illustrating various financial movements. Different colored lines represent upward and downward trends with percentage changes, indicating stock performance or indices across different regions. The visual juxtaposition of financial data against a geographical layout highlights how market movements correlate with specific
Free with trial A set of twelve diverse and versatile vector icons depicting various types of charts commonly used in business and data analysis. These include line graphs showing upward and fluctuating trends, bar charts illustrating data comparisons, and pie charts representing proportions. Ideal for presentations, reports, websites, and infographics related to finance, marketing, and statistics. Decrease percentage vectors Collection of Line and Bar Charts & Pie Charts - Business Data Visualization Icons. A set of twelve diverse and versatile vector icons depicting various types of charts commonly used in business and data analysis. These include line graphs showing upward and fluctuating trends, bar charts illustrating data comparisons, and pie charts representing proportions. Ideal for presentations, reports, websites, and infographics related to finance, marketing, and statistics.
Free with trial A bold red downward arrow pointing to indicate a zero percent value, perfect for financial, sales, or discount graphics. Clean and modern design with a transparent background for easy integration into various projects. Decrease percentage illustrations Red downward arrow with zero percent symbol on transparent background. A bold red downward arrow pointing to indicate a zero percent value, perfect for financial. A bold red downward arrow pointing to indicate a zero percent value, perfect for financial, sales, or discount graphics. Clean and modern design with a transparent background for easy integration into various projects
Free with trial The concept of interest rate monitoring. Professionals analyze fluctuations in mortgage rates using a magnifying glass and charts, ensuring profitable financial decisions. Banking ideas. Flat vector. Decrease percentage vectors The concept of interest rate monitoring. Flat vector. The concept of interest rate monitoring. Professionals analyze fluctuations in mortgage rates using a magnifying glass and charts, ensuring profitable financial decisions. Banking ideas. Flat vector.
Free with trial Exploring real estate investment strategies. hand interacting with blocks representing financial growth, property market trends, and investment planning. a visual concept for wealth management. Decrease percentage illustrations Real estate investment strategy planning financial growth property market trends and analysis concept. exploring real estate investment strategies. hand interacting with blocks representing financial growth, property market trends, and investment planning. a visual concept for wealth management.
Free with trial A collection of simple, business and growth icons, perfect for financial reports, websites, or presentations on market trends and data. The set features a clean, minimal, thin line style. Decrease percentage vectors Simple business and growth icons set, thin line style, minimal vector illustration perfect for financial reports, websites, or pre. A collection of simple, business and growth icons, perfect for financial reports, websites, or presentations on market trends and data. The set features a clean, minimal, thin line style.
Free with trial 3D rendering of cubes with discount sign over white background. Decrease percentage illustrations 3D rendering of cubes with discount sign
Free with trial Financial graph with candlestick chart and world map on a light background. Concept of global business and finance. 3D Rendering. Decrease percentage illustrations Financial graph with candlestick chart and world map on light background. 3D Rendering. Financial graph with candlestick chart and world map on a light background. Concept of global business and finance. 3D Rendering
Free with trial The image displays a bold, three-dimensional representation of the number 30 followed by a percent sign, both in a golden hue. There is also a minus symbol attached to the left of the number, indicating a reduction or discount of thirty percent. Decrease percentage illustrations Large three-dimensional golden thirty percent sign with a minus symbol. The image displays a bold, three-dimensional representation of the number 30 followed by a percent sign, both in a golden hue. There is also a minus symbol attached to the left of the number, indicating a reduction or discount of thirty percent
Free with trial This image shows a 3D pie chart with two segments, one red and one green. Each segment has an arrow pointing outwards, indicating growth or change in the data represented by the chart. Decrease percentage illustrations A 3d pie chart with red and green segments and arrows indicating growth. This image shows a 3D pie chart with two segments, one red and one green. Each segment has an arrow pointing outwards, indicating growth or change in the data represented by the chart
Free with trial Abstract house with sign percent on wooden table. Business and financial success concept. 3D Rendering. Decrease percentage illustrations Abstract house with sign percent
Free with trial Illustration featuring financial turmoil with dramatic downward arrows and distressed figures. Symbols like dollar ($), euro (�), and pound (�) are scattered, along with words like "SELL! ", "PANIC", "CRASH! ", and "BEAR MARKET". A piggy bank breaking symbolizes losses. Bar charts and various percentages emphasize financial decline. The style is cartoonish, using black and white sketches to depict the chaotic atmosphere often associated with stock market crashes or economic downturns. Elements convey urgency and distress in an economic context. Decrease percentage vectors Stock Market Crash and Global Financial Crisis Hand Drawn Doodle Concept. Illustration featuring financial turmoil with dramatic downward arrows and distressed figures. Symbols like dollar ($), euro (�), and pound (�) are scattered, along with words like "SELL!", "PANIC", "CRASH!", and "BEAR MARKET". A piggy bank breaking symbolizes losses. Bar charts and various percentages emphasize financial decline. The style is cartoonish, using black and white sketches to depict the chaotic atmosphere often associated with stock market crashes or economic downturns. Elements convey urgency and distress in an economic context.
Free with trial Red pie chart with one slice separated showing data division and proportion. Decrease percentage vectors Red pie chart with one slice separated showing data division and proportion
Free with trial Red pie chart with one slice separated showing data division and proportion. Decrease percentage vectors Red pie chart with one slice separated showing data division and proportion
Free with trial A clean, minimalist smartphone app interface displays a spending tracker. A bar graph shows spending increase, highlighting financial growth. The design is black and white, emphasizing data clarity. Decrease percentage illustrations Smartphone App UI: Minimalist Black & White Spending Tracker with Rising Graph. A clean, minimalist smartphone app interface displays a spending tracker. A bar graph shows spending increase, highlighting financial growth. The design is black and white, emphasizing data clarity
Free with trial The image features a large, glossy, three-dimensional yellow percent sign prominently displayed against a plain, light-colored background. The percent sign appears to be made of a shiny, reflective material, giving it a vibrant and eye-catching appearance. The lighting highlights the contours and depth of the percent sign, emphasizing its three-dimensional form. Decrease percentage illustrations A large, glossy, three-dimensional yellow percent sign on a plain background. The image features a large, glossy, three-dimensional yellow percent sign prominently displayed against a plain, light-colored background. The percent sign appears to be made of a shiny, reflective material, giving it a vibrant and eye-catching appearance. The lighting highlights the contours and depth of the percent sign, emphasizing its three-dimensional form
Free with trial 3D HALF PRICE word on white background 3d rendering. Decrease percentage illustrations 3D HALF PRICE word on white background 3d rendering
Free with trial The image features a large, three-dimensional blue percent sign symbol prominently displayed against a plain white background. The symbol is slightly tilted to the right, giving it a dynamic appearance. The blue color of the percent sign is vibrant and eye-catching, standing out sharply against the white backdrop. Decrease percentage illustrations A close-up view of a large blue percent sign symbol on a white background. The image features a large, three-dimensional blue percent sign symbol prominently displayed against a plain white background. The symbol is slightly tilted to the right, giving it a dynamic appearance. The blue color of the percent sign is vibrant and eye-catching, standing out sharply against the white backdrop
Free with trial House is placed on the coin and calculator with illustration of interest concept of calculating interest payments. planning savings money of coins to buy a home concept for property, mortgage, invest. Decrease percentage illustrations House is placed on the coin and calculator with illustration of interest concept of calculating interest payments. planning
Free with trial A vibrant and detailed bar chart with a line graph overlay, showcasing financial data trends over time. The chart features a variety of colors, including shades of green, purple, and blue, with data points marked by small diamond shapes. The background is a dark blue grid, providing a stark contrast to the colorful data visualization. Decrease percentage illustrations Colorful bar chart and line graph representing financial data trends. A vibrant and detailed bar chart with a line graph overlay, showcasing financial data trends over time. The chart features a variety of colors, including shades of green, purple, and blue, with data points marked by small diamond shapes. The background is a dark blue grid, providing a stark contrast to the colorful data visualization
Free with trial Marketing. A vibrant and modern bar graph with glowing neon colors represents data and business growth. Decrease percentage illustrations Glowing Bar Graph Data Visualization, Business Growth, Statistics, marketing. marketing. A vibrant and modern bar graph with glowing neon colors represents data and business growth.
Free with trial A hand holds glowing particles with text comparing quality versus cost. Up and down arrows indicate opposite trends. Decrease percentage illustrations Hand holding quality versus cost comparison with up and down arrows image. A hand holds glowing particles with text comparing quality versus cost. Up and down arrows indicate opposite trends
Free with trial A businessperson in a blue suit holds a glowing orb with upward and downward arrows labeled and cost. Decrease percentage illustrations Businessperson holding glowing orb with and cost arrows above laptop hand. A businessperson in a blue suit holds a glowing orb with upward and downward arrows labeled and cost.
Free with trial A set of two pie chart icons, one solid black and the other an outline, presented side-by-side. These graphics are perfect for representing data, statistics, analytics, and proportions in a clear and concise manner across various design projects. Decrease percentage illustrations Pie Chart Icon Set Solid Black and Outline Version for Data Visualization. A set of two pie chart icons, one solid black and the other an outline, presented side-by-side. These graphics are perfect for representing data, statistics, analytics, and proportions in a clear and concise manner across various design projects.
Free with trial Vector shiny Orange Red 3d sign 90 percents. suitable for use on advertising banners, leaflets, posters, flyers and any promotional items. Seasonal discounts, Black Friday, the interest rate, etc. Decrease percentage illustrations Discount ninety percent. Isometric style. Vector shiny Orange Red 3d sign 90 percents. suitable for use on advertising banners, leaflets, posters, flyers and any promotional items. Seasonal discounts, Black Friday, the interest rate, etc.
Free with trial 3D Falling Arrow with Percent Icon. Decline Representation on Elegant Background. Decrease percentage illustrations 3D Falling Arrow with Percent Icon. Decline Representation on Elegant Background
Free with trial 3D Falling Arrow with Percent Icon. Decline Representation on Elegant Background. Decrease percentage illustrations 3D Falling Arrow with Percent Icon. Decline Representation on Elegant Background
Free with trial 3D Falling Arrow with Percent Icon. Decline Representation on Elegant Background. Decrease percentage illustrations 3D Falling Arrow with Percent Icon. Decline Representation on Elegant Background
Free with trial Discount Sunburst Badge Graphic Black and White Commercial Sale Announcement. Decrease percentage vectors Discount Sunburst Badge Graphic Black and White Commercial Sale Announcement
Free with trial Interest rate cuts diminish savings investment returns. Visualized impact on yields potential losses. Decrease percentage illustrations Interest Rate Cuts: Impact on Savings & Investments - Visual Representation of Decreasing Returns. Interest rate cuts diminish savings investment returns. Visualized impact on yields potential losses
Free with trial Conceptual infographic showing diesel fuel storage tanks and a distribution pathway with price indicators and labels. Decrease percentage illustrations Diesel price spike illustrated with harbor fuel storage and distribution network. Conceptual infographic showing diesel fuel storage tanks and a distribution pathway with price indicators and labels
Free with trial Dollar price up and down icon isolated on white background. USD coin growth and decline sign symbol vector. Decrease percentage vectors Dollar price up and down icon isolated on white background. USD coin growth and decline sign symbol
Free with trial Vector shiny Orange Red 3d sign 70 percents. suitable for use on advertising banners, leaflets, posters, flyers and any promotional items. Seasonal discounts, Black Friday, the interest rate, etc. Decrease percentage illustrations Discount seventy percent. Isometric style. Vector shiny Orange Red 3d sign 70 percents. suitable for use on advertising banners, leaflets, posters, flyers and any promotional items. Seasonal discounts, Black Friday, the interest rate, etc.
Free with trial Vibrant Business Data Visualization Highlighting Market Trends and Financial Metrics. Generative AI. Decrease percentage illustrations Vibrant Business Data Visualization Highlighting Market Trends and Financial Metrics
Free with trial Modern 3D render showcasing a dynamic sales promotion with various discount signs shopping bags and gift boxes for special offers. Decrease percentage illustrations Vibrant 3d Sales Promotion Display with Discount Percentages and Gift Boxes. Modern 3D render showcasing a dynamic sales promotion with various discount signs shopping bags and gift boxes for special offers
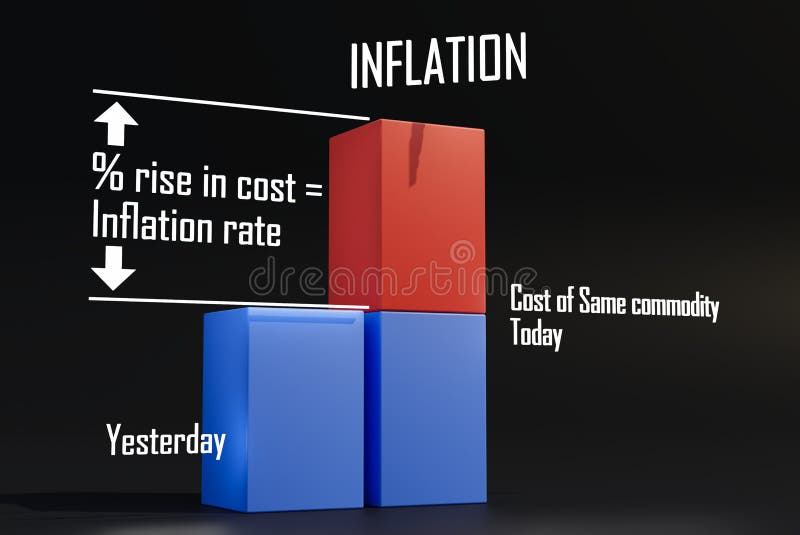
Free with trial 3D graph bar chart explains Inflation rate. 3D rendering illustration. Cost comparison chart. Decrease percentage illustrations 3D graph bar chart explains Inflation rate. 3D rendering illustration.
Free with trial A vibrant and diverse set of financial icons, including symbols for money, growth, and profit, as well as various charts and graphs. The icons are colorful and modern, making them perfect for use in business presentations, reports, and marketing materials. The white background provides a clean and neutral space for the icons to stand out, allowing for easy customization and integration into various designs. Decrease percentage vectors A collection of colorful financial icons on a white background for business use. A vibrant and diverse set of financial icons, including symbols for money, growth, and profit, as well as various charts and graphs. The icons are colorful and modern, making them perfect for use in business presentations, reports, and marketing materials. The white background provides a clean and neutral space for the icons to stand out, allowing for easy customization and integration into various designs.
Free with trial Red Bar Chart on Grunge Background Data Visualization Concept, data analysis, chart , This photo was created using generative AI. design. Decrease percentage illustrations Red Bar Chart on Grunge Background Data Visualization Concept, data analysis, chart design. Red Bar Chart on Grunge Background Data Visualization Concept, data analysis, chart , This photo was created using generative AI. design
Free with trial Modern icon set featuring financial growth and decline symbols for business analysis. Decrease percentage vectors Modern icon set featuring financial growth and decline symbols for business analysis
Free with trial Percent Symbol Circle Black and White Icon Discount Offer Price Reduction Graphic. Decrease percentage illustrations Percent Symbol Circle Black and White Icon Discount Offer Price Reduction Graphic
Free with trial New Indian Currency with Mail Box - 3D Rendered Image. Decrease percentage illustrations New Indian Currency with Mail Box