Free with trial Business Woman hands typing on laptop with digital falling bar chart and cost percentage icon. Concept of financial cost reduction, business expense management and economic crisis strategy. Decrease price illustrations Business Woman hands typing on laptop with digital falling bar chart and cost percentage icon. Concept of financial cost reduction
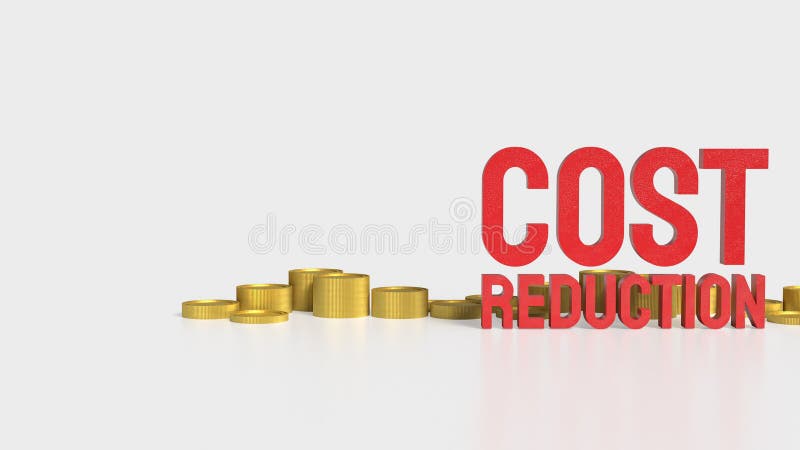
Free with trial The Cost reduction and coins for Business concept 3d rendering. Decrease price illustrations The Cost reduction and coins for Business concept 3d rendering
Free with trial The Cost reduction and coins for Business concept 3d rendering. Decrease price illustrations The Cost reduction and coins for Business concept 3d rendering
Free with trial Metallic percentage symbol resting atop financial charts. Evokes concepts of interest, discounts, growth, or decline. Great for business, finance, or sales themes. Decrease price illustrations Metallic percentage symbol resting atop financial charts. Evokes concepts of interest, discounts, growth, or decline. Great for
Free with trial Percent down icon vector logo set collection for web app ui. Decrease price vectors Percent down icon Thin line illustration set. Percent down icon vector logo set collection for web app ui
Free with trial Man holding pen making a down arrow on virtual screen. Cost reduction concept. Decrease price illustrations Man holding pen making a down arrow on virtual screen. Cost reduction concept
Free with trial Percentage with arrow up and down banking, credit, interest rate, finance and money sphere icon neon glow vector illustration concept. Decrease price vectors Percentage with arrow up and down banking, credit, interest rate, finance and money sphere icon neon glow concept. Percentage with arrow up and down banking, credit, interest rate, finance and money sphere icon neon glow vector illustration concept
Free with trial Three pink dollar signs are shown on a pink background. The dollar signs are positioned in a row, with the middle one slightly higher than the other two. Decrease price illustrations Three pink dollar signs are shown on a pink background
Free with trial This image illustrates market trends with arrows and graphs. It represents economic instability, showing both growth and decline, crucial for financial analysis. Decrease price vectors Vector art of illustration depicting fluctuating market trends with upward and downward arrows and bar graphs, , conveying. This image illustrates market trends with arrows and graphs. It represents economic instability, showing both growth and decline, crucial for financial analysis
Free with trial Dollar coin with orange arrow pointing down, representing economic downturn, financial decline, and currency depreciation concept. Decrease price vectors Declining dollar coin with downward arrow signifying currency devaluation and financial market downturn illustration. Dollar coin with orange arrow pointing down, representing economic downturn, financial decline, and currency depreciation concept
Free with trial Airdrop projects with bitcoin coin thin line icon, neural network concept. Vector graphics. Drop with connections and coin sign on white background, outline style icon for mobile or web design. Decrease price vectors Airdrop projects with bitcoin coin thin line icon, neural network concept. Vector graphics. Drop with connections and
Free with trial A close up view of golden digital currency coins on a financial candlestick chart. this image represents the volatility and trading patterns of the modern cryptocurrency market and global economy. Decrease price vectors Golden digital currency coins placed over a financial candlestick chart showing market volatility and trading trends. a close up view of golden digital currency coins on a financial candlestick chart. this image represents the volatility and trading patterns of the modern cryptocurrency market and global economy
Free with trial Black percentage symbol enclosed in a speech bubble, surrounded by financial symbols representing interest rates, investments, sales, and discounts. Decrease price vectors Black percent symbol inside a speech bubble surrounded by financial icons visualizing interest rates, investments, sales, and. Black percentage symbol enclosed in a speech bubble, surrounded by financial symbols representing interest rates, investments, sales, and discounts
Free with trial High and Low Percent arrow icon vector logo set collection for web app ui. Decrease price vectors High and Low Percent arrow icon vector set collection for web. High and Low Percent arrow icon vector logo set collection for web app ui
Free with trial Devolution, scissors cutting a banknote, financial crisis, cost or value reduction. Decrease price illustrations Devolution, scissors cutting a banknote, financial crisis, cost or value reduction
Free with trial Illustration of up and down percentage arrow line icon. Percentage arrow with percent sign. Design concept for banking, credit, interest rates, finance and financial fields. isolated white background. Decrease price illustrations Illustration of up and down percentage arrow line icon.
Free with trial Illustration of up and down percentage arrow line icon. Percentage arrow with percent sign. Design concept for banking, credit, interest rates, finance and financial fields. isolated white background. Decrease price illustrations Illustration of up and down percentage arrow line icon.
Free with trial Illustration of up and down percentage arrow line icon. Percentage arrow with percent sign. Design concept for banking, credit, interest rates, finance and financial fields. isolated white background. Decrease price illustrations Illustration of up and down percentage arrow line icon.
Free with trial Illustration of up and down percentage arrow line icon. Percentage arrow with percent sign. Design concept for banking, credit, interest rates, finance and financial fields. isolated white background. Decrease price illustrations Illustration of up and down percentage arrow line icon.
Free with trial A close-up shot of a screen displaying a red financial graph with declining trends, indicating a bearish stock market. The chart shows decreasing value, suggesting potential losses and market downturn. Decrease price illustrations Red Financial Graph Displaying Stock Market Decline and Bearish Trading Trends on a Screen. A close-up shot of a screen displaying a red financial graph with declining trends, indicating a bearish stock market. The chart shows decreasing value, suggesting potential losses and market downturn
Free with trial Up and down direction arrow icon with long shadow. Upward and downward sign symbol. Decrease price vectors Up and down direction arrow icon with long shadow
Free with trial Red arrow crashing down in supermarket aisle representing falling retail sales, inflation, and economic recession concept. Generative AI. Decrease price illustrations Red arrow crashing down in supermarket aisle representing falling retail sales inflation and economic recession concept
Free with trial This icon represents seven percent, symbolizing a discount, interest rate, or statistical value in various contexts such as finance, sales, and data analysis. Decrease price vectors Vector art of seven percent icon, representing a discount, interest rate, or statistical value in finance, sales, and data. This icon represents seven percent, symbolizing a discount, interest rate, or statistical value in various contexts such as finance, sales, and data analysis
Free with trial Deflation line icon. Economic crisis sign. Vector illustration. Decrease price vectors Deflation line icon. Economic crisis sign
Free with trial Costs optimization Icon Thin line illustration set. Decrease price vectors Costs optimization Icon Flat vector set outline. Costs optimization Icon Thin line illustration set
Free with trial This captivating 3D image portrays the intriguing concept of food inflation in a surreal and thought-provoking manner. Instead of the typical visual representation of rising prices, this unique perspective depicts shrinking food items, suggesting a decrease in cost. The imagery is not literal, but rather a symbolic representation of the economic climate. The shrinking fruits and vegetables,. Decrease price illustrations Visualizing Economic Growth 3D Food Inflation Depicts Shrinking Prices and a Booming Economy Through Surreal Imagery. This captivating 3D image portrays the intriguing concept of food inflation in a surreal and thought-provoking manner. Instead of the typical visual representation of rising prices, this unique perspective depicts shrinking food items, suggesting a decrease in cost. The imagery is not literal, but rather a symbolic representation of the economic climate. The shrinking fruits and vegetables,
Free with trial Red downward and green upward percentage-marked arrows. Three-dimensional visual graphs for discounts, interest rates, stock market changes, and economic data. Decrease price illustrations Red downward and green upward percentage-marked arrows. Three-dimensional visual graphs for discounts, interest rates, stock
Free with trial Up and Down sign with green and red arrows isolated on a blue background vector illustration. Concept of sales bar chart symbol icon with arrow moving down and sales bar chart with arrow moving up. Decrease price vectors Up and Down sign with green and red arrows vector illustration. Concept of sales bar chart symbol icon with arrows. Up and Down sign with green and red arrows isolated on a blue background vector illustration. Concept of sales bar chart symbol icon with arrow moving down and sales bar chart with arrow moving up.
Free with trial Up and Down sign with green and red arrows vector illustration. Concept of sales bar chart symbol icon with arrow moving down and sales bar chart with arrow moving up. Decrease price vectors Up and Down sign with green and red arrows vector illustration. Concept of sales bar chart symbol icon with arrows. Up and Down sign with green and red arrows vector illustration. Concept of sales bar chart symbol icon with arrow moving down and sales bar chart with arrow moving up.
Free with trial Up and Down sign with green and red arrows vector illustration. Concept of sales bar chart symbol icon with arrow moving down and sales bar chart with arrow moving up. Decrease price vectors Up and Down sign with green and red arrows vector illustration. Concept of sales bar chart symbol icon with arrows. Up and Down sign with green and red arrows vector illustration. Concept of sales bar chart symbol icon with arrow moving down and sales bar chart with arrow moving up.
Free with trial A glowing red zigzag arrow points downward, representing a decline on a digital financial chart. The surface is gridded and dark, highlighting the red of the arrow. The arrow has a neon-like appearance and reflects off the glossy surface, signaling a decrease in value. The surrounding chart includes descending graphical elements indicating fluctuating data, conveying a downturn in financial performance or market trends. Decrease price illustrations A large red arrow points downwards over a gridded financial chart showing a sharp decline in value. A glowing red zigzag arrow points downward, representing a decline on a digital financial chart. The surface is gridded and dark, highlighting the red of the arrow. The arrow has a neon-like appearance and reflects off the glossy surface, signaling a decrease in value. The surrounding chart includes descending graphical elements indicating fluctuating data, conveying a downturn in financial performance or market trends.
Free with trial A glowing red zigzag arrow points downward, representing a decline on a digital financial chart. The surface is gridded and dark, highlighting the red of the arrow. The arrow has a neon-like appearance and reflects off the glossy surface, signaling a decrease in value. The surrounding chart includes descending graphical elements indicating fluctuating data, conveying a downturn in financial performance or market trends. Decrease price illustrations A large red arrow points downwards over a gridded financial chart showing a sharp decline in value. A glowing red zigzag arrow points downward, representing a decline on a digital financial chart. The surface is gridded and dark, highlighting the red of the arrow. The arrow has a neon-like appearance and reflects off the glossy surface, signaling a decrease in value. The surrounding chart includes descending graphical elements indicating fluctuating data, conveying a downturn in financial performance or market trends.
Free with trial A glowing red zigzag arrow points downward, representing a decline on a digital financial chart. The surface is gridded and dark, highlighting the red of the arrow. The arrow has a neon-like appearance and reflects off the glossy surface, signaling a decrease in value. The surrounding chart includes descending graphical elements indicating fluctuating data, conveying a downturn in financial performance or market trends. Decrease price illustrations A large red arrow points downwards over a gridded financial chart showing a sharp decline in value. A glowing red zigzag arrow points downward, representing a decline on a digital financial chart. The surface is gridded and dark, highlighting the red of the arrow. The arrow has a neon-like appearance and reflects off the glossy surface, signaling a decrease in value. The surrounding chart includes descending graphical elements indicating fluctuating data, conveying a downturn in financial performance or market trends.
Free with trial Businessman Hunting Piggy Bank Jumping Down on Falling Stack of Gold Bars Bar Graph with Red Arrow Spear Representing Gold Market Crash Financial Loss and Asset Devaluation. Decrease price vectors Businessman Hunting Piggy Bank Jumping Down on Falling Stack of Gold Bars Bar Graph with Red Arrow Spear Representing Gold Market
Free with trial Hands holding a tablet displaying a stock market graph, illustrating finance, investment analysis, and modern digital trading. Decrease price illustrations Hands holding tablet displaying stock market graph. Hands holding a tablet displaying a stock market graph, illustrating finance, investment analysis, and modern digital trading.
Free with trial Golden bitcoin coin rests on wooden surface. Blurred red downward crypto chart in background. Digital currency investment risk, market loss financial volatility and value decrease. Decrease price illustrations Golden bitcoin coin rests on wooden surface. Blurred red downward crypto chart in background. Digital currency investment risk
Free with trial Graph going Up and Down sign with green and red arrows vector set. Flat design vector set of a concept of sales bar chart symbol icon with arrow moving down and sales bar chart with arrow moving up. Decrease price vectors Graph going Up and Down sign with green and red arrows vector set. Flat design vector set of a concept of sales bar chart arrows. Graph going Up and Down sign with green and red arrows vector set. Flat design vector set of a concept of sales bar chart symbol icon with arrow moving down and sales bar chart with arrow moving up.
Free with trial Costs optimization Icon Vector symbol or sign set collection in black and white outline. Decrease price vectors Costs optimization flat line icon set. Costs optimization Thin line illustration vector. Costs optimization Icon Vector symbol or sign set collection in black and white outline
Free with trial Business graph icon. Flat design. Vector illustration, EPS 10. Decrease price vectors Recession statistics financial failure concept. Business graph icon. Flat design. Vector illustration, EPS 10.
Free with trial Red bar chart displays a stock market decline against a dark background, representing a financial crisis or economic downturn. This image highlights negative trends and losses in the market. Decrease price illustrations Red Bar Chart Displaying Stock Market Decline on Dark Background for Financial Crisis Concept. Red bar chart displays a stock market decline against a dark background, representing a financial crisis or economic downturn. This image highlights negative trends and losses in the market
Free with trial Businessman riding piggy bank carrying gold bars escaping from red falling arrow spear representing investment loss financial crisis risk and gold price volatility concept. Decrease price vectors Businessman riding piggy bank carrying gold bars escaping from red falling arrow spear representing investment loss financial. Crisis risk and gold price
Free with trial Cost reduction concept. Quality increase and cost optimization, Hands typing on a laptop with digital icons representing business efficiency and cost reduction. Effective business, Expense reduce. Decrease price illustrations Cost reduction concept. Quality increase and cost optimization, Hands typing on a laptop with digital icons representing business
Free with trial Reduce labor costs icon Vector symbol or sign set collection in black and white outline. Decrease price vectors Worker Wage Reduction Icon Symbolizing Decrease in Labor Income. Reduce labor costs icon Vector symbol or sign set collection in black and white outline
Free with trial Costs optimization Icon vector logo set collection for web app ui. Decrease price vectors Costs optimization Icon Thin line illustration set. Costs optimization Icon vector logo set collection for web app ui
Free with trial Two adjacent panels display a line graph icon with dual zigzagging lines and circular data points. On the left, the icon is black on a white background. On the right, it's white on a dark background. Both icons feature the line graph at a 45-degree angle, suggesting an increase in data points, with round nodes indicating specific values along the line. The simplistic design focuses on contrast and clarity, ideal for visual representation in data analysis or presentation templates. Decrease price vectors Increase Icon. Solid glyph series icon. Two adjacent panels display a line graph icon with dual zigzagging lines and circular data points. On the left, the icon is black on a white background. On the right, it's white on a dark background. Both icons feature the line graph at a 45-degree angle, suggesting an increase in data points, with round nodes indicating specific values along the line. The simplistic design focuses on contrast and clarity, ideal for visual representation in data analysis or presentation templates.
Free with trial Close up of laptop with falling chart on screen on creative background. Recession concept. 3D Rendering. Decrease price illustrations Close up of laptop with falling chart on screen on creative background. Recession concept.
Free with trial A businessman in suit pushing a percent sign for your needs. Concept for online bank or your finance company. Special offer, sale, gift. Vector illustration. Decrease price vectors A businessman in suit pushing a percent sign for your needs. Concept for online bank or your finance company. Special
Free with trial Up down arrow icon on black circle. Upward downward sign symbol vector. Decrease price vectors Up down arrow icon on black circle. Upward downward sign symbol
Free with trial Coin with dollar sign, downward arrow. Symbol of financial loss, cost reduction, decrease in value. Business concept. Decrease price vectors Orange coin with dollar sign and blue downward arrow representing financial loss or decreasing value concept business finance. Coin with dollar sign, downward arrow. Symbol of financial loss, cost reduction, decrease in value. Business concept
Free with trial Coin with dollar sign, downward arrow. Symbol of financial loss, cost reduction, decrease in value. Business concept. Decrease price vectors Blue coin with dollar sign and orange downward arrow representing financial loss or decreasing value concept business finance. Coin with dollar sign, downward arrow. Symbol of financial loss, cost reduction, decrease in value. Business concept
Free with trial Downward trend arrow , isolated on white background. Decrease price illustrations Downward trend arrow
Free with trial Businessman riding piggy bank jumping down on falling gold coins bar graph staircase escaping red arrow spear during stock market crash and gold price decline concept. Decrease price vectors Businessman riding piggy bank jumping down on falling gold coins bar graph staircase escaping red arrow spear during stock market
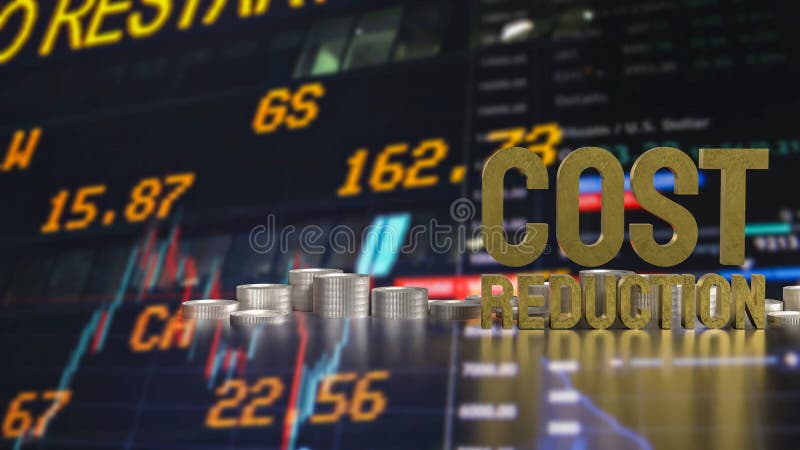
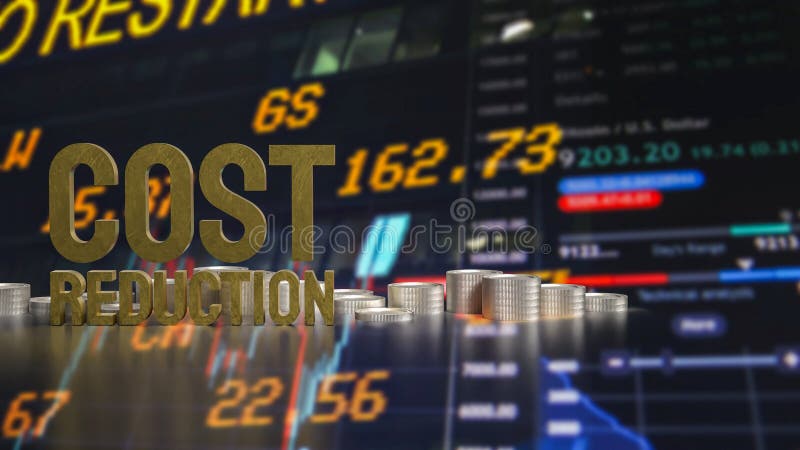
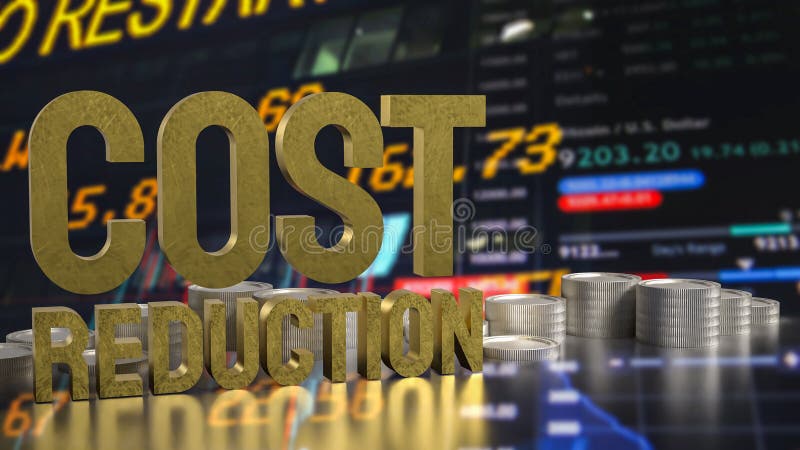
Free with trial The Cost reduction and coins for Business concept 3d rendering. Decrease price illustrations The Cost reduction and coins for Business concept 3d rendering
Free with trial Economy crisis icon logo sign vector outline in black and white color. Decrease price vectors Economy crisis icon symbol set collection. Economy crisis simple vector sign bundle. Economy crisis icon logo sign vector outline in black and white color
Free with trial The Cost reduction and coins for Business concept 3d rendering. Decrease price illustrations The Cost reduction and coins for Business concept 3d rendering
Free with trial The Cost reduction and coins for Business concept 3d rendering. Decrease price illustrations The Cost reduction and coins for Business concept 3d rendering
Free with trial The Cost reduction and coins for Business concept 3d rendering. Decrease price illustrations The Cost reduction and coins for Business concept 3d rendering
Free with trial The Cost reduction and coins for Business concept 3d rendering. Decrease price illustrations The Cost reduction and coins for Business concept 3d rendering
Free with trial This image depicts two contrasting scenarios of the housing market, one showing a positive upward trend and the other a negative downward trend. Decrease price illustrations Visual representation of real estate market trends showing both upward and downward fluctuations in housing prices and investment. This image depicts two contrasting scenarios of the housing market, one showing a positive upward trend and the other a negative downward trend
Free with trial The Cost reduction and coins for Business concept 3d rendering. Decrease price illustrations The Cost reduction and coins for Business concept 3d rendering
Free with trial Factors of production for labour in economics for demand of land and supply of land graph for wages vector. Decrease price vectors Factors of production for labour in economics for demand of land and supply of land graph for wages
Free with trial The Cost reduction and coins for Business concept 3d rendering. Decrease price illustrations The Cost reduction and coins for Business concept 3d rendering
Free with trial The Cost reduction and coins for Business concept 3d rendering. Decrease price illustrations The Cost reduction and coins for Business concept 3d rendering
Free with trial The Cost reduction and coins for Business concept 3d rendering. Decrease price illustrations The Cost reduction and coins for Business concept 3d rendering
Free with trial The Cost reduction and coins for Business concept 3d rendering. Decrease price illustrations The Cost reduction and coins for Business concept 3d rendering
Free with trial Decreasing bar chart icon in generic style. Market crash sign symbol illustration. Decrease price vectors Decreasing bar chart icon in generic style. Market crash sign symbol
Free with trial Up and down arrow icon on circle line. Upward and downward sign symbol vector. Decrease price vectors Up and down arrow icon on circle line. Upward and downward sign symbol
Free with trial Percent down icon vector set on white background. EPS 10. Decrease price vectors Percent down icon isolated on white background. Percent down icon vector set on white background. EPS 10
Free with trial Percent down icon vector set on white background. EPS 10. Decrease price vectors Percent down icon isolated on white background. Percent down icon vector set on white background. EPS 10
Free with trial Percent down icon vector set on white background. EPS 10. Decrease price vectors Percent down icon isolated on white background. Percent down icon vector set on white background. EPS 10
Free with trial A striking image of gold nuggets showcasing wealth and investment potential against a dark backdrop, featuring a financial trend line representing economic growth. Decrease price illustrations Gold nuggets on dark surface with financial trend line in background symbolizing wealth, investment, and economic growth concepts. A striking image of gold nuggets showcasing wealth and investment potential against a dark backdrop, featuring a financial trend line representing economic growth
Free with trial Percent down icon vector set on white background. EPS 10. Decrease price vectors Percent down icon isolated on white background. Percent down icon vector set on white background. EPS 10
Free with trial Decline Curve A Visual Representation of Increasing Trends Curving Downward and Overcoming Previous Bars Against a Dark Blue Background by SD. Decrease price illustrations Decline Curve A Visual Representation of Increasing Trends Curving Downward and Overcoming Previous Bars Against a Dark Blue Backg
Free with trial Up and down arrow icon on black circle. Upward and downward sign symbol vector. Decrease price vectors Up and down arrow icon on black circle. Upward and downward sign symbol
Free with trial 3d isometric illustration of a brown paper shopping bag with a downward red arrow, symbolizing negative sales growth. Decrease price vectors Isometric brown shopping bag with negative growth arrow. 3d isometric illustration of a brown paper shopping bag with a downward red arrow, symbolizing negative sales growth
Free with trial Percentage symbol displayed on a wooden block represents discounts sales offers promotions finance interest rates savings investments returns growth market value profit margins gains losses and reduc. Decrease price illustrations Percentage discount sale offer promotion finance interest rate savings investment return growth market value profit margin gain lo. Percentage symbol displayed on a wooden block represents discounts sales offers promotions finance interest rates savings investments returns growth market value profit margins gains losses and reduc
Free with trial Wooden blocks display plus minus and percentage symbols representing financial concepts like profit loss interest rates discounts and investment growth used in business education and marketing materi. Decrease price illustrations Wooden blocks plus minus percentage math finance investment growth profit loss calculation interest rate discount sale promotion m. Wooden blocks display plus minus and percentage symbols representing financial concepts like profit loss interest rates discounts and investment growth used in business education and marketing materi
Free with trial Percent growth and decline arrow icon vector isolated on white background. Percentage up and down sign symbol. Decrease price vectors Percent growth and decline arrow icon isolated on white background. Percentage up and down sign symbol
Free with trial Bitcoin BTC Cryptocurrency on the display board with red arrow down, 3d rendering. Decrease price illustrations Bitcoin BTC Cryptocurrency on the display board with red arrow down
Free with trial Curved down arrow icon. Bankrupt, market crisis vector concept. Decrease price vectors Curved down arrow icon. Bankrupt, market crisis concept