Free with trial Carbon neutral icon, zero co2 emission vector design, eps 10 file, easy to edit. Decrease reduction vectors Carbon neutral icon, zero co2 emission vector
Free with trial Cost label icon outline vector. Discount price. Sale promotion color flat. Decrease reduction vectors Cost label icon vector flat. Cost label icon outline vector. Discount price. Sale promotion color flat
Free with trial A glowing 1% displayed in a futuristic blue room. Decrease reduction illustrations Glowing 1% displayed in a futuristic
Free with trial Financial independence, FIRE night or dark mode web banner or landing page. Tax optimization. Financial literacy and personal budget development. Flat vector illustration. Decrease reduction vectors Financial independence, FIRE night or
Free with trial Speech bubble with a downward arrow and Bitcoin symbol indicates decreased value. Below, a simple landscape icon represents digital art or NFTs. Both elements are in black and white, highlighting financial and digital market themes. Decrease reduction vectors NFT Prices Down. Speech bubble with a downward arrow and Bitcoin symbol indicates decreased value. Below, a simple landscape icon represents digital art or NFTs. Both elements are in black and white, highlighting financial and digital market themes.
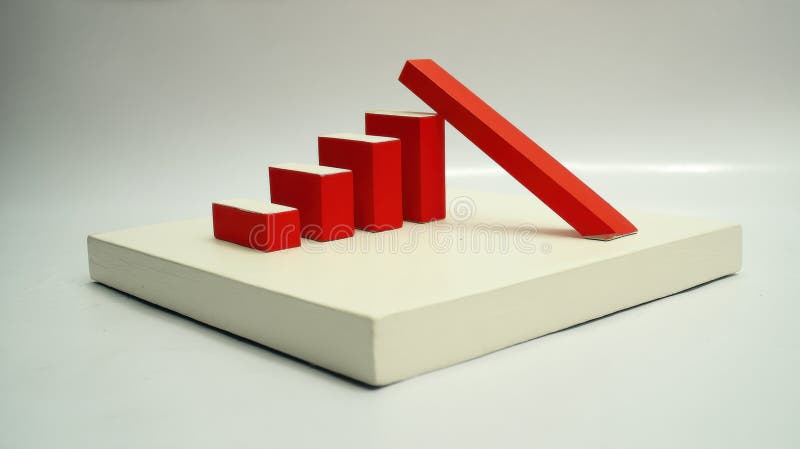
Free with trial This image shows a 3D model of a bar graph, where one bar is falling, symbolizing decline or failure. This striking visual representation was generated by AI, offering a unique perspective on downward trends and economic instability. The clean design makes it ideal for illustrating various concepts. Decrease reduction illustrations Falling Bar Graph. This image shows a 3D model of a bar graph, where one bar is falling, symbolizing decline or failure. This striking visual representation was generated by AI, offering a unique perspective on downward trends and economic instability. The clean design makes it ideal for illustrating various concepts
Free with trial Carbon management icon, co2 gas emission, linear design, eps 10 file, easy to edit. Decrease reduction vectors Carbon management icon, co2 gas emission, linear
Free with trial GHG, greenhouse gas emissions chart vector icon, eps 10 file, easy to edit. Decrease reduction vectors GHG, greenhouse gas emissions chart vector icon
Free with trial Red down arrow with white house, 3d rendering. Decrease reduction illustrations Red down arrow with white house
Free with trial Chat arrow down icon Vector set on white background. EPS 10. Decrease reduction vectors Chart arrow down icon set. decline downward chart vector symbol. stock trend downturn graph sign. negative economy bar Chart. Chat arrow down icon Vector set on white background. EPS 10
Free with trial Reducing waste icon with a chart, linear design, eps 10 file, easy to edit. Decrease reduction vectors Reducing waste icon with a chart, linear design
Free with trial Financial independence, FIRE concept. Tax optimization. Financial efficiency, budgeting and economy idea. Financial literacy and personal budget development. Flat vector illustration. Decrease reduction vectors Financial independence, FIRE concept. Tax optimization. Financial efficiency
Free with trial Red arrow is pointing down over a cliff, representing failure and decline in business. 3D render. Decrease reduction illustrations Red arrow pointing down over a cliff representing failure. Red arrow is pointing down over a cliff, representing failure and decline in business. 3D render
Free with trial Reducing waste icon with a trash bin, flat vector, eps 10 file, easy to edit. Decrease reduction vectors Reducing waste icon with a trash bin, flat vector
Free with trial This AI-generated image depicts a bar graph where the bars are covered in a melting, metallic substance, suggesting a market downturn. The dripping metal symbolizes loss and decline, generated by AI for visual representation. Decrease reduction illustrations Melting Market Graph. This AI-generated image depicts a bar graph where the bars are covered in a melting, metallic substance, suggesting a market downturn. The dripping metal symbolizes loss and decline, generated by AI for visual representation.
Free with trial Unemployment Rate Vector Illustration featuring individuals actively searching for Jobs Amid Economic Downturns and Financial Crises in a Background. Decrease reduction vectors Unemployment Rate Vector Illustration featuring individuals actively searching for Jobs Amid Economic Downturns and Financial
Free with trial Unemployment Rate Vector Illustration featuring individuals actively searching for Jobs Amid Economic Downturns and Financial Crises in a Background. Decrease reduction vectors Unemployment Rate Vector Illustration featuring individuals actively searching for Jobs Amid Economic Downturns and Financial
Free with trial Unemployment Rate Vector Illustration featuring individuals actively searching for Jobs Amid Economic Downturns and Financial Crises in a Background. Decrease reduction vectors Unemployment Rate Vector Illustration featuring individuals actively searching for Jobs Amid Economic Downturns and Financial
Free with trial Unemployment Rate Vector Illustration featuring individuals actively searching for Jobs Amid Economic Downturns and Financial Crises in a Background. Decrease reduction vectors Unemployment Rate Vector Illustration featuring individuals actively searching for Jobs Amid Economic Downturns and Financial
Free with trial Unemployment Rate Vector Illustration featuring individuals actively searching for Jobs Amid Economic Downturns and Financial Crises in a Background. Decrease reduction vectors Unemployment Rate Vector Illustration featuring individuals actively searching for Jobs Amid Economic Downturns and Financial
Free with trial Unemployment Rate Vector Illustration featuring individuals actively searching for Jobs Amid Economic Downturns and Financial Crises in a Background. Decrease reduction vectors Unemployment Rate Vector Illustration featuring individuals actively searching for Jobs Amid Economic Downturns and Financial
Free with trial Unemployment Rate Vector Illustration featuring individuals actively searching for Jobs Amid Economic Downturns and Financial Crises in a Background. Decrease reduction vectors Unemployment Rate Vector Illustration featuring individuals actively searching for Jobs Amid Economic Downturns and Financial
Free with trial Unemployment Rate Vector Illustration featuring individuals actively searching for Jobs Amid Economic Downturns and Financial Crises in a Background. Decrease reduction vectors Unemployment Rate Vector Illustration featuring individuals actively searching for Jobs Amid Economic Downturns and Financial
Free with trial Unemployment Rate Vector Illustration featuring individuals actively searching for Jobs Amid Economic Downturns and Financial Crises in a Background. Decrease reduction vectors Unemployment Rate Vector Illustration featuring individuals actively searching for Jobs Amid Economic Downturns and Financial
Free with trial Unemployment Rate Vector Illustration featuring individuals actively searching for Jobs Amid Economic Downturns and Financial Crises in a Background. Decrease reduction vectors Unemployment Rate Vector Illustration featuring individuals actively searching for Jobs Amid Economic Downturns and Financial
Free with trial Unemployment Rate Vector Illustration featuring individuals actively searching for Jobs Amid Economic Downturns and Financial Crises in a Background. Decrease reduction vectors Unemployment Rate Vector Illustration featuring individuals actively searching for Jobs Amid Economic Downturns and Financial
Free with trial Unemployment Rate Vector Illustration featuring individuals actively searching for Jobs Amid Economic Downturns and Financial Crises in a Background. Decrease reduction vectors Unemployment Rate Vector Illustration featuring individuals actively searching for Jobs Amid Economic Downturns and Financial
Free with trial Unemployment Rate Vector Illustration featuring individuals actively searching for Jobs Amid Economic Downturns and Financial Crises in a Background. Decrease reduction vectors Unemployment Rate Vector Illustration featuring individuals actively searching for Jobs Amid Economic Downturns and Financial
Free with trial Unemployment Rate Vector Illustration featuring individuals actively searching for Jobs Amid Economic Downturns and Financial Crises in a Background. Decrease reduction vectors Unemployment Rate Vector Illustration featuring individuals actively searching for Jobs Amid Economic Downturns and Financial
Free with trial Carbon offset and reducing co2 gas icons on white, eps 10 file, easy to edit. Decrease reduction vectors Carbon offset and reducing co2 gas icons on white
Free with trial Scissors cut the red expense word, 3d rendering. Decrease reduction illustrations Scissors cut the red expense word
Free with trial Scissors cut the red expense word, 3d rendering. Decrease reduction illustrations Scissors cut the red expense word
Free with trial Golden, glittery letters spelling "RATES" are illuminated by an overhead light source, with a pair of scissors positioned over the letters. Image. Decrease reduction illustrations Scissors cutting RATES. Golden, glittery letters spelling "RATES" are illuminated by an overhead light source, with a pair of scissors positioned over the letters. Image
Free with trial Reduce carbon emissions vector icon with co2 chart, eps 10 file, easy to edit. Decrease reduction vectors Reduce carbon emissions vector icon with co2 chart
Free with trial Carbon credit, co2 gas cost vector icon, eps 10 file, easy to edit. Decrease reduction vectors Carbon credit, co2 gas cost vector icon
Free with trial Carbon credit icon, co2 gas cost vector, eps 10 file, easy to edit. Decrease reduction vectors Carbon credit icon, co2 gas cost vector
Free with trial Percent with arrow icon set. Up and down pictogram. Vector isolated illustration eps10. Decrease reduction vectors Percent with arrow icon set. Up and down pictogram. Vector isolated illustration
Free with trial A simple, flat design icon depicting a downward trend. The image features a red graph line descending from the top left to the bottom right, with an arrow indicating the direction. The graph is set against a clean white background, emphasizing the visual impact of the trend. This graphic is suitable for illustrating concepts such as financial decline, decreasing sales, or negative performance in business, economics, or data analysis. Decrease reduction vectors Downward Trend Graph Icon. A simple, flat design icon depicting a downward trend. The image features a red graph line descending from the top left to the bottom right, with an arrow indicating the direction. The graph is set against a clean white background, emphasizing the visual impact of the trend. This graphic is suitable for illustrating concepts such as financial decline, decreasing sales, or negative performance in business, economics, or data analysis.
Free with trial A minimalist bar chart with a descending line graph overlay, symbolizing financial loss, performance decline, or negative data trends. Ideal for presentations, dashboards, economic reports, and warning visuals. Decrease reduction vectors Downward Trend Bar Chart Icon. A minimalist bar chart with a descending line graph overlay, symbolizing financial loss, performance decline, or negative data trends. Ideal for presentations, dashboards, economic reports, and warning visuals
Free with trial TL sign. Green icon on blue background. Vector illustration. Decrease reduction vectors TL money, vector finance clipart. TL sign. Green icon on blue background. Vector illustration.
Free with trial Descending bar chart or graph on white background. Economic crisis, declining profit, recession and bankruptcy. 3d render. Decrease reduction illustrations Descending bar chart or graph on white background
Free with trial A boy is holding a handful of shiny coins, his fingers gripping them tightly. The coins glint in the light, showcasing their detailed engravings and reflecting his eager expression. Decrease reduction illustrations The boy is holding coins. A boy is holding a handful of shiny coins, his fingers gripping them tightly. The coins glint in the light, showcasing their detailed engravings and reflecting his eager expression.
Free with trial Lower cost icon Black line art vector in black and white outline set collection sign. Decrease reduction vectors Lower cost icon line art vector. Lower cost icon Black line art vector in black and white outline set collection sign
Free with trial Dollar Vector illustration on a transparent background. Premium quality symmbols. Line Color vector icons for concept and graphic design. Decrease reduction illustrations Dollar coin money down business. Dollar Vector illustration on a transparent background. Premium quality symmbols. Line Color vector icons for concept and graphic design
Free with trial Carbon emissions cost line icon with euro, eps 10 file, easy to edit. Decrease reduction vectors Carbon emissions cost line icon with euro
Free with trial Descending white cylinder steps. Empty podium for product display. Bar chart and business decline or failure. Financial profit loss and economic crisis. 3D render. Decrease reduction illustrations Descending white cylinder steps. Empty podium for product display
Free with trial Graph Down glyph vector icon isolated. Graph Down stock vector icon for web, mobile app and ui design. Decrease reduction vectors Graph Down glyph vector icon
Free with trial Percent down icon logo sign vector outline in black and white color. Decrease reduction vectors Percent down icon logo set vector. Percent down icon logo sign vector outline in black and white color
Free with trial Businesspeople handshake of commitment to reduce carbon to net zero by 2050 and sustainable development and business based on renewable energy. Decrease reduction illustrations Businesspeople handshake of commitment to reduce carbon to net zero by 2050. AI Generated. Businesspeople handshake of commitment to reduce carbon to net zero by 2050 and sustainable development and business based on renewable energy.
Free with trial Businesspeople handshake of commitment to reduce carbon to net zero by 2050 and sustainable development and business based on renewable energy. Decrease reduction illustrations Businesspeople handshake of commitment to reduce carbon to net zero by 2050. AI Generated. Businesspeople handshake of commitment to reduce carbon to net zero by 2050 and sustainable development and business based on renewable energy.
Free with trial A collection of hand-drawn, black and white icons representing growth, decline, and financial concepts. The set includes upward and downward arrows, percentage symbols, and a bar graph illustrating trends. The simple line art style makes these icons versatile for various applications, including presentations, infographics, and website design. They convey concepts of progress, success, loss, and market fluctuations. Decrease reduction illustrations Growth and Decline Icons Set. A collection of hand-drawn, black and white icons representing growth, decline, and financial concepts. The set includes upward and downward arrows, percentage symbols, and a bar graph illustrating trends. The simple line art style makes these icons versatile for various applications, including presentations, infographics, and website design. They convey concepts of progress, success, loss, and market fluctuations.
Free with trial A hand holds a piece of paper with a hand-drawn graph showing a sharp decline. The downward trend is clearly visible, indicating a negative development. This image was generated by AI and is ideal for illustrating concepts like economic downturn, market crash, or business failure. Decrease reduction illustrations Hand Holding Declining Graph. A hand holds a piece of paper with a hand-drawn graph showing a sharp decline. The downward trend is clearly visible, indicating a negative development. This image was generated by AI and is ideal for illustrating concepts like economic downturn, market crash, or business failure.
Free with trial This image showcases a colorful bar graph with a downward-pointing arrow, generated by AI, illustrating a negative trend or decline. The vibrant colors and simplistic design make the message clear and easily understood. The image is perfect for representing economic downturns, market dips, or any s. Decrease reduction illustrations Downward Trend Visualization. This image showcases a colorful bar graph with a downward-pointing arrow, generated by AI, illustrating a negative trend or decline. The vibrant colors and simplistic design make the message clear and easily understood. The image is perfect for representing economic downturns, market dips, or any s
Free with trial A simple black and white line illustration features an oil barrel with a droplet symbol, representing petroleum. Above it, a speech bubble contains a downward arrow and a dollar sign, indicating a decline in oil prices. The clean, minimalist design effectively conveys the concept of decreasing crude oil costs. Decrease reduction vectors World Crude Oil Prices Down. A simple black and white line illustration features an oil barrel with a droplet symbol, representing petroleum. Above it, a speech bubble contains a downward arrow and a dollar sign, indicating a decline in oil prices. The clean, minimalist design effectively conveys the concept of decreasing crude oil costs.
Free with trial A conceptual vector icon representing declining approval or negative feedback. Decrease reduction vectors Approval Decline Vector Icon. A conceptual vector icon representing declining approval or negative feedback
Free with trial Two words low cost or high cost. Choose low cost on stacked wooden cubes on the table. Business and finance concept. Decrease reduction illustrations Two words low cost or high cost. Choose low cost on stacked wooden cubes on the table. Business and finance concept
Free with trial A red price tag prominently displaying a "50% off" discount, representing sales, special offers, and significant price reductions for shopping and promotions. Decrease reduction illustrations Bold red fifty percent off tag. A red price tag prominently displaying a '50% off' discount, representing sales, special offers, and significant price reductions. A red price tag prominently displaying a "50% off" discount, representing sales, special offers, and significant price reductions for shopping and promotions
Free with trial This image shows multiple yellow sticky notes, each with a downward-pointing black arrow, generated by AI. It represents a concept of decline or negative progression, perhaps in business or data analysis. The consistent pattern suggests a systematic downward trend. Decrease reduction illustrations Downward Trending Sticky Notes. This image shows multiple yellow sticky notes, each with a downward-pointing black arrow, generated by AI. It represents a concept of decline or negative progression, perhaps in business or data analysis. The consistent pattern suggests a systematic downward trend.
Free with trial Electric consumption icon with a phone, vector design, eps 10 file, easy to edit. Decrease reduction vectors Electric consumption icon with a phone, vector
Free with trial 3d rendering of the word "SHRINKFLATION" and a coiled measuring tape with black markings, this tactic used by manufacturers to increase prices without explicitly raising them on the label. Decrease reduction illustrations The word \'SHRINKFLATION\' and a coiled measuring tape. 3d rendering of the word "SHRINKFLATION" and a coiled measuring tape with black markings, this tactic used by manufacturers to increase prices without explicitly raising them on the label
Free with trial Text size icon Logo sign in thin line outline set and group collection. Decrease reduction vectors Text size icon flat editable icon mark set. Text size icon Logo sign in thin line outline set and group collection
Free with trial Carbon emissions cost icon, co2 gas price in pounds, eps 10 file, easy to edit. Decrease reduction vectors Carbon emissions cost icon, co2 price in pounds. carbon emissions cost icon, co2 gas price in pounds, eps 10 file, easy to edit
Free with trial CFC icon with cloud, chlorofluorocarbons vector, eps 10 file, easy to edit. Decrease reduction vectors CFC icon with cloud, chlorofluorocarbons vector
Free with trial 3d rendering of the word "SHRINKFLATION" and a coiled measuring tape with black markings, this tactic used by manufacturers to increase prices without explicitly raising them on the label. Decrease reduction illustrations The word \'SHRINKFLATION\' and a coiled measuring tape. 3d rendering of the word "SHRINKFLATION" and a coiled measuring tape with black markings, this tactic used by manufacturers to increase prices without explicitly raising them on the label
Free with trial 3d rendering of the word "SHRINKFLATION" and a coiled measuring tape with black markings, this tactic used by manufacturers to increase prices without explicitly raising them on the label. Decrease reduction illustrations The word \'SHRINKFLATION\' and a coiled measuring tape. 3d rendering of the word "SHRINKFLATION" and a coiled measuring tape with black markings, this tactic used by manufacturers to increase prices without explicitly raising them on the label
Free with trial 3d rendering of the word "SHRINKFLATION" and a coiled measuring tape with black markings, this tactic used by manufacturers to increase prices without explicitly raising them on the label. Decrease reduction illustrations The word \'SHRINKFLATION\' and a coiled measuring tape. 3d rendering of the word "SHRINKFLATION" and a coiled measuring tape with black markings, this tactic used by manufacturers to increase prices without explicitly raising them on the label
Free with trial Vibrant display of neon green icons, each representing a different symbol. Decrease reduction illustrations Vibrant display of neon green icons
Free with trial Business Financial Loss Icon Illustration Logo Vector. Decrease reduction vectors Loss
Free with trial Business Financial Loss Icon Illustration Logo Vector. Decrease reduction vectors Loss
Free with trial Business Financial Loss Icon Illustration Logo Vector. Decrease reduction vectors Loss
Free with trial Business Financial Loss Icon Illustration Logo Vector. Decrease reduction vectors Loss
Free with trial Zoom out icon Black line art vector in black and white outline set collection sign. Decrease reduction vectors Zoom out icon Thin line art collection. Zoom out icon Black line art vector in black and white outline set collection sign
Free with trial Simple, hand drawn arrow pointing downwards, suitable for representing concepts like downloading, decreasing, or indicating a downward direction. Decrease reduction vectors Simple, hand drawn arrow pointing downwards, suitable for representing concepts like downloading, decreasing, or
Free with trial A symbolic illustration representing a journey's downturn or a business decline. Decrease reduction vectors Mountain Path Decline Arrow Icon. A symbolic illustration representing a journey's downturn or a business decline
Free with trial USD dollar value decline and devaluation. Bar graph made of holes in yellow paper is revealing us dollar banknotes of decreasing values. 3d render. Decrease reduction illustrations Us dollar decreasing value concept with bar graph on yellow background. USD dollar value decline and devaluation. Bar graph made of holes in yellow paper is revealing us dollar banknotes of decreasing values. 3d render
Free with trial This image depicts a white pillar with a red downward trending arrow, generated by AI. It symbolizes economic decline, market instability, or a negative trend in a specific industry. The clean, minimalist style emphasizes the severity of the drop. Decrease reduction illustrations Falling Market Trend. This image depicts a white pillar with a red downward trending arrow, generated by AI. It symbolizes economic decline, market instability, or a negative trend in a specific industry. The clean, minimalist style emphasizes the severity of the drop.
Free with trial A young woman sits dejectedly as a graph plummets dramatically. This AI-generated illustration depicts the emotional toll of economic downturns, symbolizing anxiety and uncertainty in the face of financial crisis. The image is perfect for articles discussing market volatility, investment strategies. Decrease reduction illustrations Market Crash Anxiety. A young woman sits dejectedly as a graph plummets dramatically. This AI-generated illustration depicts the emotional toll of economic downturns, symbolizing anxiety and uncertainty in the face of financial crisis. The image is perfect for articles discussing market volatility, investment strategies
Free with trial Red arrow pointing down isolated, 3d rendering. Decrease reduction illustrations Red arrow pointing down isolated
Free with trial Bars down icon Thin outline art symbol vector logo thin line. Decrease reduction vectors Bars down icon Thin outline art symbol
Free with trial 50%. red fifty percent on a white background. 3D illustration. on a white background. 3D Text design. Decrease reduction illustrations 50%. red fifty percent on a white background. 3D illustration. on a white background