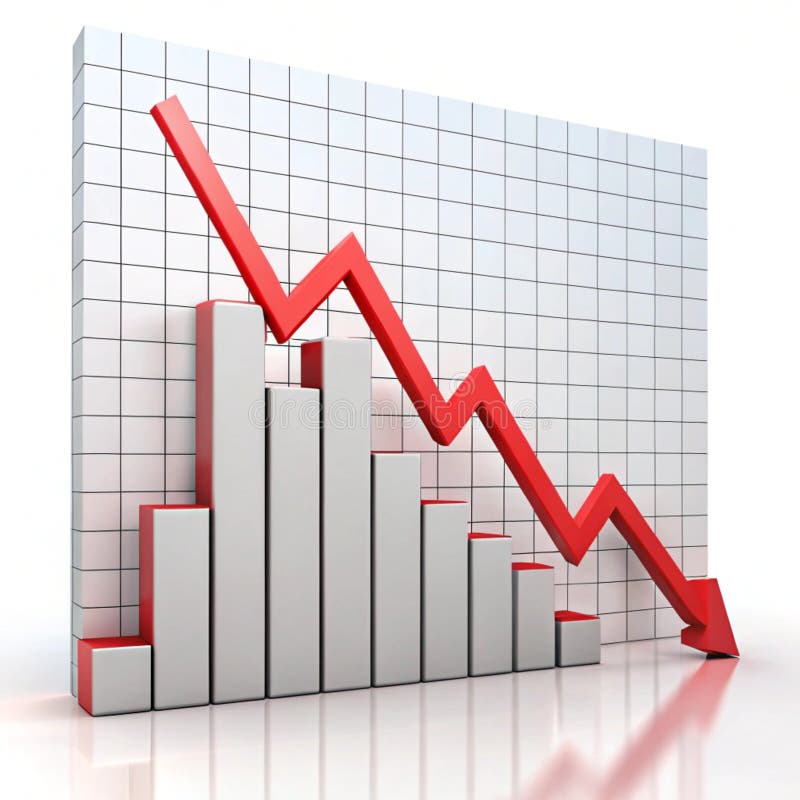
Free with trial Vibrant bar graph illustrates business growth and decline with upward and downward trending lines. Perfect for presentations or reports. Decrease statistics data analysis illustrations Colorful Bar Graph Chart Showing Growth and Decline. Vibrant bar graph illustrates business growth and decline with upward and downward trending lines. Perfect. Vibrant bar graph illustrates business growth and decline with upward and downward trending lines. Perfect for presentations or reports
Free with trial This graphic features a stylized bar chart with a descending red arrow, symbolizing a downward trend. The image is presented in a split design, with the left side on a white background and the right side on a red background. This visual metaphor is ideal for representing financial losses, declining performance, economic downturns, or any situation indicating a negative trajectory. Its clean, minimalist style makes it versatile for various business, financial, and analytical contexts. Decrease statistics data analysis illustrations Red Downward Trend Graph with Arrow. This graphic features a stylized bar chart with a descending red arrow, symbolizing a downward trend. The image is presented. This graphic features a stylized bar chart with a descending red arrow, symbolizing a downward trend. The image is presented in a split design, with the left side on a white background and the right side on a red background. This visual metaphor is ideal for representing financial losses, declining performance, economic downturns, or any situation indicating a negative trajectory. Its clean, minimalist style makes it versatile for various business, financial, and analytical contexts.
Free with trial The image depicts a line graph with a downward trend. The red line starts at a higher point on the y-axis and gradually declines, indicating a decrease over time. The x-axis represents time or another independent variable, while the y-axis represents the dependent variable that is decreasing. Decrease statistics data analysis illustrations Graph showing downward trend. The image depicts a line graph with a downward trend. The red line starts at a higher point on the y-axis and gradually declines. The image depicts a line graph with a downward trend. The red line starts at a higher point on the y-axis and gradually declines, indicating a decrease over time. The x-axis represents time or another independent variable, while the y-axis represents the dependent variable that is decreasing
Free with trial Simple graphic design showing interconnected circles, one with a plus sign and the other with a minus sign. Useful for website design, apps, and presentations. Decrease statistics data analysis vectors Plus and Minus Circle Icons: Add and Subtract Symbols. Simple graphic design showing interconnected circles, one with a plus sign and the other with a minus sign. Simple graphic design showing interconnected circles, one with a plus sign and the other with a minus sign. Useful for website design, apps, and presentations.
Free with trial A man in a suit holds a phone and a stylus, interacting with a projected bar graph showing a downward trend in profits and an upward trend in costs. Decrease statistics data analysis illustrations Businessman analyzes declining profits and rising costs using digital graph on a dark background. A man in a suit holds a phone and a stylus, interacting with a. A man in a suit holds a phone and a stylus, interacting with a projected bar graph showing a downward trend in profits and an upward trend in costs
Free with trial A visual representation of a declining financial trend, depicted by a bar chart with a red arrow indicating a downward movement, symbolizing loss or poor performance. Decrease statistics data analysis illustrations Bar chart with downward trending red arrow isolated on white background. A visual representation of a declining financial trend, depicted by a bar chart with a. A visual representation of a declining financial trend, depicted by a bar chart with a red arrow indicating a downward movement, symbolizing loss or poor performance
Free with trial Red sad face beside a line graph showing a downward trend and a bar graph. Ideal for business loss, economic decline, performance issues, challenges, setbacks, analytics, trends. Simple flat metaphor. Decrease statistics data analysis vectors Declining Chart with Sad Face and Bar Graph Representing Negative Trend and Challenges. Red sad face beside a line graph showing a downward trend and a bar graph. Red sad face beside a line graph showing a downward trend and a bar graph. Ideal for business loss, economic decline, performance issues, challenges, setbacks, analytics, trends. Simple flat metaphor
Free with trial Stacks of gold coins are illuminated with a glowing blue financial stock market graph overlay in a dark, abstract. Decrease statistics data analysis illustrations Stacks of gold coins with a glowing blue financial stock market graph overlay in a dark setting. Stacks of gold coins are illuminated with a glowing blue. Stacks of gold coins are illuminated with a glowing blue financial stock market graph overlay in a dark, abstract
Free with trial A neon orange graph on a black background shows a sharp decline, symbolizing financial loss or a negative trend. Decrease statistics data analysis illustrations Neon orange downward trending graph with arrow indicating financial decline on a black background. A neon orange graph on a black background shows a sharp. A neon orange graph on a black background shows a sharp decline, symbolizing financial loss or a negative trend
Free with trial Illustration of a smartphone displaying financial charts and a stack of gold coins with dollar signs. Arrows circulate around the phone, suggesting a cycle of investment and growth. The image represents mobile banking, online trading, and the potential for financial success through digital platforms. Decrease statistics data analysis illustrations Mobile Investment and Financial Growth. Illustration of a smartphone displaying financial charts and a stack of gold coins with dollar signs. Arrows circulate. Illustration of a smartphone displaying financial charts and a stack of gold coins with dollar signs. Arrows circulate around the phone, suggesting a cycle of investment and growth. The image represents mobile banking, online trading, and the potential for financial success through digital platforms.
Free with trial A golden bar graph illustrates a downward financial trend, with each bar decreasing in height from left to right. A large, shiny golden coin with a dollar sign is positioned on top of the graph, and a golden arrow points downwards, signifying a loss or decline in value. The entire composition is set against a clean white background. Decrease statistics data analysis illustrations Golden Bar Graph Showing Downward Trend with Dollar Coin and Arrow on White Background finance. A golden bar graph illustrates a downward financial trend, with. A golden bar graph illustrates a downward financial trend, with each bar decreasing in height from left to right. A large, shiny golden coin with a dollar sign is positioned on top of the graph, and a golden arrow points downwards, signifying a loss or decline in value. The entire composition is set against a clean white background
Free with trial Pie chart segments, sad face with declining graph, and a grid globe with bars suggest economic downturn. Ideal for finance, global crisis, analytics, investment, statistics, risk and simple flat. Decrease statistics data analysis vectors Financial Decline Concept with Pie Chart, Downward Graph, and Global Representation. Pie chart segments, sad face with declining graph, and a grid globe with. Pie chart segments, sad face with declining graph, and a grid globe with bars suggest economic downturn. Ideal for finance, global crisis, analytics, investment, statistics, risk and simple flat
Free with trial Debt reduction financial concept with downward red arrow on bar graph, blue background, copy space, symbolizing successful debt management and economic improvement. Decrease statistics data analysis illustrations Debt reduction financial concept with downward red arrow on bar graph, blue background, copy space, symbolizing successful debt. Management and economic
Free with trial 3d man analyzing bar chart, a visual representation of growth, business performance, and investment strategy ,Generative ai. Decrease statistics data analysis illustrations 3d man analyzing bar chart, a visual representation of growth, business performance, and investment strategy. Generative ai
Free with trial Colorful 3D Bar Chart Illustration. For indicator economic review. Decrease statistics data analysis illustrations Colorful 3D Bar Chart Illustration. For indicator economic review
Free with trial Downward graph chart. Isolated on transparent background. Decrease statistics data analysis illustrations Downward graph chart. Isolated on transparent background
Free with trial A businessman in a suit is drawing a downward sloping graph illustrating the decline of profits against the rise of costs the image represents financial challenges business downturns and the need for cost reduction strategies for improved profitability. Decrease statistics data analysis illustrations Business person drawing a graph representing financial decline and reduced profits due to cost. A businessman in a suit is drawing a downward sloping graph. A businessman in a suit is drawing a downward sloping graph illustrating the decline of profits against the rise of costs the image represents financial challenges business downturns and the need for cost reduction strategies for improved profitability
Free with trial A financial graph depicting a downward trend with a red arrow, blue bar chart, and white line graph on a dark blue grid background. Ideal for illustrating market decline, revenue loss, or negative performance in business, finance, and economic presentations. Decrease statistics data analysis illustrations Declining Financial Graph Red Arrow and Bar Chart on Dark Grid Background. A financial graph depicting a downward trend with a red arrow, blue bar chart, and. A financial graph depicting a downward trend with a red arrow, blue bar chart, and white line graph on a dark blue grid background. Ideal for illustrating market decline, revenue loss, or negative performance in business, finance, and economic presentations.
Free with trial An illustrated graphic showing a smiling multicultural family gathered around a whiteboard presentation about financial awareness and savings. The chart displays expenses and budget cuts, featuring a large pair of scissors cutting down high expenses to lower levels. This concept art is ideal for financial planning, family budget management, banking, wealth advice, and economic education materials, highlighting cost reduction and smart money habits for households. Decrease statistics data analysis illustrations Family Financial Awareness and Savings Concept Illustration. An illustrated graphic showing a smiling multicultural family gathered around a whiteboard. An illustrated graphic showing a smiling multicultural family gathered around a whiteboard presentation about financial awareness and savings. The chart displays expenses and budget cuts, featuring a large pair of scissors cutting down high expenses to lower levels. This concept art is ideal for financial planning, family budget management, banking, wealth advice, and economic education materials, highlighting cost reduction and smart money habits for households.
Free with trial This 3D features a wooden easel holding a whiteboard. On the board, a colorful bar chart shows a downward trend, accompanied by a prominent red arrow indicating a decrease. The clean, minimalist design effectively communicates financial loss, economic downturn, or declining performance in a professional business presentation setting. Decrease statistics data analysis vectors A 3D render of a whiteboard showing a declining bar chart and arrow. This 3D features a wooden easel holding a whiteboard. On the board, a colorful bar chart. This 3D features a wooden easel holding a whiteboard. On the board, a colorful bar chart shows a downward trend, accompanied by a prominent red arrow indicating a decrease. The clean, minimalist design effectively communicates financial loss, economic downturn, or declining performance in a professional business presentation setting
Free with trial Collection of twenty-four black thin line icons on white background arranged in four rows showing business growth and financial success concepts. Includes uptrend arrows, down arrow, bar charts, pie chart, target, percentage, magnifying glass, coin stacks, growing plants, shopping cart, ladder, document, dashboard, cloud, shield, clock and refresh symbols. Ideal for infographics, presentations, websites, apps, marketing materials illustrating investment, profit, progress, analytics and strategy. Decrease statistics data analysis vectors Set of Growth and Finance Line Icons. Collection of twenty-four black thin line icons on white background arranged in four rows showing business growth and. Collection of twenty-four black thin line icons on white background arranged in four rows showing business growth and financial success concepts. Includes uptrend arrows, down arrow, bar charts, pie chart, target, percentage, magnifying glass, coin stacks, growing plants, shopping cart, ladder, document, dashboard, cloud, shield, clock and refresh symbols. Ideal for infographics, presentations, websites, apps, marketing materials illustrating investment, profit, progress, analytics and strategy.
Free with trial Business chart showing negative trend with red arrow and descending bars. AI generated. Decrease statistics data analysis vectors Business chart showing negative trend with red arrow and descending bars. AI generated
Free with trial Hand-drawn financial charts and graphs displayed on a transparent glass board, perfect for business presentations. Decrease statistics data analysis illustrations Glass Board with Hand-Drawn Financial Charts and Graphs. Hand-drawn financial charts and graphs displayed on a transparent glass board, perfect for business. Hand-drawn financial charts and graphs displayed on a transparent glass board, perfect for business presentations
Free with trial The image showcases a collection of 3D graphical elements representing different business and market performance metrics. It includes growth percentages, market share gains, pie charts, bar graphs, and target indicators. Each element highlights positive and negative trends, market shares, and growth rates, useful for illustrating financial reports, business presentations, or performance analyses. Decrease statistics data analysis illustrations Visual representation of various business performance metrics and market growth indicators isolated on white background. The image showcases a collection of 3D. The image showcases a collection of 3D graphical elements representing different business and market performance metrics. It includes growth percentages, market share gains, pie charts, bar graphs, and target indicators. Each element highlights positive and negative trends, market shares, and growth rates, useful for illustrating financial reports, business presentations, or performance analyses.
Free with trial A bar graph illustrates a decreasing trend in financial performance, indicated by a red arrow and a dollar symbol. Decrease statistics data analysis illustrations Bar chart showing financial decline with downward trend and dollar sign. A bar graph illustrates a decreasing trend in financial performance, indicated by a red. A bar graph illustrates a decreasing trend in financial performance, indicated by a red arrow and a dollar symbol
Free with trial This image was created using Generative AI. A red arrow pointing down over blue bars and a yellow circle. Business graphic symbolizing financial decline, loss, or negative market trends. Decrease statistics data analysis vectors Red arrow pointing down over blue bars. This image was created using Generative AI. A red arrow pointing down over blue bars and a yellow circle. Business. This image was created using Generative AI. A red arrow pointing down over blue bars and a yellow circle. Business graphic symbolizing financial decline, loss, or negative market trends
Free with trial Downward trend line on grid chart with sad face and progress icon signaling mediocre results or declining metrics. Ideal for failure, analytics, market loss, strategy, performance, results, simple. Decrease statistics data analysis illustrations Declining Trend on Graph with Sad Face Symbolizing Negative Results or Performance. Downward trend line on grid chart with sad face and progress icon signaling. Downward trend line on grid chart with sad face and progress icon signaling mediocre results or declining metrics. Ideal for failure, analytics, market loss, strategy, performance, results, simple
Free with trial This image showcases a colorful bar graph with a downward-pointing arrow, generated by AI, illustrating a negative trend or decline. The vibrant colors and simplistic design make the message clear and easily understood. The image is perfect for representing economic downturns, market dips, or any s. Decrease statistics data analysis illustrations Downward Trend Visualization. This image showcases a colorful bar graph with a downward-pointing arrow, generated by AI, illustrating a negative trend or decline. This image showcases a colorful bar graph with a downward-pointing arrow, generated by AI, illustrating a negative trend or decline. The vibrant colors and simplistic design make the message clear and easily understood. The image is perfect for representing economic downturns, market dips, or any s
Free with trial A hand holds a piece of paper with a hand-drawn graph showing a sharp decline. The downward trend is clearly visible, indicating a negative development. This image was generated by AI and is ideal for illustrating concepts like economic downturn, market crash, or business failure. Decrease statistics data analysis illustrations Hand Holding Declining Graph. A hand holds a piece of paper with a hand-drawn graph showing a sharp decline. The downward trend is clearly visible, indicating a. A hand holds a piece of paper with a hand-drawn graph showing a sharp decline. The downward trend is clearly visible, indicating a negative development. This image was generated by AI and is ideal for illustrating concepts like economic downturn, market crash, or business failure.
Free with trial Hand Drawn Graphic Showing Decline Bar Chart with Arrow Pointing Downward. AI generated. Decrease statistics data analysis vectors Hand Drawn Graphic Showing Decline Bar Chart with Arrow Pointing Downward. AI generated
Free with trial Financial Downward Trend Bar Chart Icon. A flat icon showing a blue bar chart with a downward trend arrow representing financial decline or economic loss. Decrease statistics data analysis vectors Financial Downward Trend Bar Chart Icon. A flat icon showing a blue bar chart with a downward trend arrow representing financial decline or economic loss
Free with trial Neon percentage signs around umbrella. Glowing neon percentage signs surround colorful umbrella. Generative AI. Decrease statistics data analysis illustrations Neon percentage signs around umbrella. Glowing neon percentage signs surround colorful umbrella. Generative AI
Free with trial This image showcases a vibrant 3D rendering of various financial charts, including bar graphs, pie charts, and a rising arrow, symbolizing growth and profitability. Ideal for presentations, reports, and financial articles. Decrease statistics data analysis illustrations Colorful 3D Financial Charts Showing Growth and Profit. This image showcases a vibrant 3D rendering of various financial charts, including bar graphs, pie charts. This image showcases a vibrant 3D rendering of various financial charts, including bar graphs, pie charts, and a rising arrow, symbolizing growth and profitability. Ideal for presentations, reports, and financial articles.
Free with trial A flat icon representing a business graph showing a decreasing financial trend with descending bars and a downward pointing arrow. Decrease statistics data analysis vectors Financial Downward Trend Bar Chart Icon. A flat icon representing a business graph showing a decreasing financial trend with descending bars and a downward. A flat icon representing a business graph showing a decreasing financial trend with descending bars and a downward pointing arrow
Free with trial Loss money arrow bar graph icon. On white background depicting financial decline. Decrease statistics data analysis illustrations Loss money arrow bar graph icon. On white background depicting financial decline
Free with trial A bold black line charts a significant downward trajectory, indicating a sharp decline, against a subtle grid. Decrease statistics data analysis illustrations A jagged downward trend line illustrates a sharp decline on a grid background. A bold black line charts a significant downward trajectory, indicating a sharp. A bold black line charts a significant downward trajectory, indicating a sharp decline, against a subtle grid
Free with trial Domino effect concept icon showing a declining bar chart representing financial crisis and recession. AI generated. Decrease statistics data analysis vectors Domino effect concept icon showing a declining bar chart representing financial crisis and recession. AI generated
Free with trial Grayscale Illustration of a Decreasing Bar Chart with a Downward Trend Arrow. AI generated. Decrease statistics data analysis vectors Grayscale Illustration of a Decreasing Bar Chart with a Downward Trend Arrow. AI generated
Free with trial A 3D bar chart visually represents a significant financial decline. A red arrow sharply descends, indicating a negative trend and a downward trajectory for market performance. Decrease statistics data analysis illustrations Financial decline graph showing downturn and decreasing trend with arrow. A 3D bar chart visually represents a significant financial decline. A red arrow sharply. A 3D bar chart visually represents a significant financial decline. A red arrow sharply descends, indicating a negative trend and a downward trajectory for market performance
Free with trial A 3D rendered image depicts a colorful bar graph with bars in red, yellow, green, and blue. A thick black arrow curves downwards from the top left, pointing towards the right and indicating a negative trend or decline. The bars are arranged in descending order of height from left to right, further emphasizing the downward trajectory. The image is set against a clean white background, making the. Decrease statistics data analysis illustrations Colorful Bar Graph Showing Downward Trend with Black Arrow on White Background chart. A 3D rendered image depicts a colorful bar graph with bars in red, yellow. A 3D rendered image depicts a colorful bar graph with bars in red, yellow, green, and blue. A thick black arrow curves downwards from the top left, pointing towards the right and indicating a negative trend or decline. The bars are arranged in descending order of height from left to right, further emphasizing the downward trajectory. The image is set against a clean white background, making the
Free with trial A minimalist depicting a gold bar as the central pivot point for two diverging trend lines. A rising teal curve labeled 'Upside' indicates growth and profit potential, while a descending red curve labeled 'Downside' represents risk and loss. This conceptual graphic effectively visualizes market volatility, investment scenarios, and financial decision-making. The clean flat design on a white background makes it suitable for business presentations, economic reports, and financial infographics illustrating risk management strategies. Decrease statistics data analysis vectors Gold bar upside downside financial concept. A minimalist depicting a gold bar as the central pivot point for two diverging trend lines. A rising teal curve. A minimalist depicting a gold bar as the central pivot point for two diverging trend lines. A rising teal curve labeled 'Upside' indicates growth and profit potential, while a descending red curve labeled 'Downside' represents risk and loss. This conceptual graphic effectively visualizes market volatility, investment scenarios, and financial decision-making. The clean flat design on a white background makes it suitable for business presentations, economic reports, and financial infographics illustrating risk management strategies.
Free with trial Percent signs floating on water surface. Percent symbols rising from water with colorful lighting effects. Generative AI. Decrease statistics data analysis illustrations Percent signs floating on water surface. Percent symbols rising from water with colorful lighting effects. Generative AI
Free with trial A visual representation of financial decline. Stacks of coins are juxtaposed with a red line graph depicting a downward trend, overlaid on a world map. The image conveys economic instability and market volatility. Decrease statistics data analysis illustrations Financial Downturn: Stacks of Coins with Red Line Graph Overlay, Global Economy. A visual representation of financial decline. Stacks of coins are juxtaposed. A visual representation of financial decline. Stacks of coins are juxtaposed with a red line graph depicting a downward trend, overlaid on a world map. The image conveys economic instability and market volatility
Free with trial 3D colorful bar chart, pie chart, rising arrow, dollar sign, and stacks of coins illustrate financial growth and success. Perfect for business, finance, and investment presentations. Decrease statistics data analysis illustrations Financial Growth Chart with Dollar Sign and Coin Stacks. 3D colorful bar chart, pie chart, rising arrow, dollar sign, and stacks of coins illustrate financial. 3D colorful bar chart, pie chart, rising arrow, dollar sign, and stacks of coins illustrate financial growth and success. Perfect for business, finance, and investment presentations.
Free with trial A 3D bar graph shows a downward trend with a red arrow indicating decline. The base reads "BUSINESS FAILURE". Isolated on a transparent background. Decrease statistics data analysis vectors Falling Bar Graph with Red Arrow and Text isolated on a transparent background chart. A 3D bar graph shows a downward trend with a red arrow indicating decline. A 3D bar graph shows a downward trend with a red arrow indicating decline. The base reads "BUSINESS FAILURE". Isolated on a transparent background
Free with trial Three dimensional percent sign on surface. A 3D percent sign on a flat surface with a light shining on it. Decrease statistics data analysis illustrations Three dimensional percent sign on surface. A 3D percent sign on a flat surface with a light shining on it
Free with trial Modern Metallic Percentage Symbol on Dark. Close-up of a shiny metallic percentage symbol against dark background. Decrease statistics data analysis illustrations Modern Metallic Percentage Symbol on Dark. Close-up of a shiny metallic percentage symbol against dark background
Free with trial Business Growth Speed Concept. Hand drawn charts and clock showing business growth and speed AI generated. Decrease statistics data analysis illustrations Business Growth Speed Concept. Hand drawn charts and clock showing business growth and speed AI generated
Free with trial Green bar chart with a red downward arrow. A green bar chart decreasing in height with a large red arrow pointing downwards signifying financial loss or decline. Decrease statistics data analysis illustrations Green bar chart with a red downward arrow. A green bar chart decreasing in height with a large red arrow pointing downwards signifying financial loss or decline
Free with trial A bar chart showing a steady decline with a red downward arrow, symbolizing financial loss, economic downturn, business decline, or negative performance trends. Decrease statistics data analysis illustrations Economic Downtrend Bar Chart for Business concept 3d Rendering. A bar chart showing a steady decline with a red downward arrow, symbolizing financial loss. A bar chart showing a steady decline with a red downward arrow, symbolizing financial loss, economic downturn, business decline, or negative performance trends
Free with trial A clean, minimalist image featuring a bold black percentage symbol (%) prominently displayed on a plain white background. The symbol is slightly tilted, adding a dynamic touch to the composition. The stark contrast between the black symbol and white backdrop ensures high visibility and versatility. This image is ideal for business, finance, marketing, or educational materials where percentage representation is needed. Decrease statistics data analysis illustrations Black percentage symbol on white background. A clean, minimalist image featuring a bold black percentage symbol (%) prominently displayed on a plain white. A clean, minimalist image featuring a bold black percentage symbol (%) prominently displayed on a plain white background. The symbol is slightly tilted, adding a dynamic touch to the composition. The stark contrast between the black symbol and white backdrop ensures high visibility and versatility. This image is ideal for business, finance, marketing, or educational materials where percentage representation is needed.
Free with trial This 3D illustration shows a descending bar chart with alternating blue and white columns, accompanied by a sharp red downward trend line. A pile of shiny gold bars sits at the base, symbolizing a decline in gold value or a bearish market trend in precious metals investment and finance. Decrease statistics data analysis vectors A 3D rendering of a downward financial graph with gold bars foreground. This 3D illustration shows a descending bar chart with alternating blue and white columns. This 3D illustration shows a descending bar chart with alternating blue and white columns, accompanied by a sharp red downward trend line. A pile of shiny gold bars sits at the base, symbolizing a decline in gold value or a bearish market trend in precious metals investment and finance
Free with trial A bar chart showing a steady decline with a red downward arrow, symbolizing financial loss, economic downturn, business decline, or negative performance trends. Decrease statistics data analysis illustrations Economic Downtrend Bar Chart for Business concept 3d Rendering. A bar chart showing a steady decline with a red downward arrow, symbolizing financial loss. A bar chart showing a steady decline with a red downward arrow, symbolizing financial loss, economic downturn, business decline, or negative performance trends
Free with trial A simple black line drawing of a presentation screen on an easel, displaying a downward trend graph with a jagged line and a large arrow pointing down. The image is set against a white background and can be used to represent declining trends, sales, profits, or other decreasing metrics in a business or financial context. Decrease statistics data analysis vectors Downward Trend Graph on Presentation Screen. A simple black line drawing of a presentation screen on an easel, displaying a downward trend graph with a jagged. A simple black line drawing of a presentation screen on an easel, displaying a downward trend graph with a jagged line and a large arrow pointing down. The image is set against a white background and can be used to represent declining trends, sales, profits, or other decreasing metrics in a business or financial context.
Free with trial A bar chart showing a steady decline with a red downward arrow, symbolizing financial loss, economic downturn, business decline, or negative performance trends. Decrease statistics data analysis illustrations Economic Downtrend Bar Chart for Business concept 3d Rendering. A bar chart showing a steady decline with a red downward arrow, symbolizing financial loss. A bar chart showing a steady decline with a red downward arrow, symbolizing financial loss, economic downturn, business decline, or negative performance trends
Free with trial A shiny red arrow curves downwards, indicating a downward trend or negative growth. This image visually represents concepts like financial decline market crash or falling stock prices. Decrease statistics data analysis illustrations Red arrow points downward showing decline trend and negative growth concept. A shiny red arrow curves downwards, indicating a downward trend or negative growth. A shiny red arrow curves downwards, indicating a downward trend or negative growth. This image visually represents concepts like financial decline market crash or falling stock prices
Free with trial Large Percentage Symbol on Dark Background. Close-up shot of a bold percentage symbol on a dark textured surface. Decrease statistics data analysis illustrations Large Percentage Symbol on Dark Background. Close-up shot of a bold percentage symbol on a dark textured surface
Free with trial Down trend financial graph with arrow pointing down symbolizing business decline. AI generated. Decrease statistics data analysis vectors Down trend financial graph with arrow pointing down symbolizing business decline. AI generated
Free with trial Tablet displaying a downward trending bar chart and arrow icon. AI generated. Decrease statistics data analysis vectors Tablet displaying a downward trending bar chart and arrow icon. AI generated
Free with trial Declining Bar Chart with Downward Arrow Representing Economic Downturn and Financial Loss. AI generated. Decrease statistics data analysis vectors Declining Bar Chart with Downward Arrow Representing Economic Downturn and Financial Loss. AI generated
Free with trial Business bar chart showing decreasing values and a prominent downward arrow indicating decline or loss. AI generated. Decrease statistics data analysis vectors Business bar chart showing decreasing values and a prominent downward arrow indicating decline or loss. AI generated
Free with trial A 3D bar chart with a red arrow indicating a significant downward trend, symbolizing financial loss or economic decline. Isolated on a white background. Decrease statistics data analysis illustrations Bar chart showing a downward trend isolated on white background. A 3D bar chart with a red arrow indicating a significant downward trend, symbolizing financial. A 3D bar chart with a red arrow indicating a significant downward trend, symbolizing financial loss or economic decline. Isolated on a white background
Free with trial Bar chart showing a steep downward trend with a large arrow indicating decline. AI generated. Decrease statistics data analysis vectors Bar chart showing a steep downward trend with a large arrow indicating decline. AI generated
Free with trial Decreasing bar graph behind magnifying glass. 3d render. Decrease statistics data analysis illustrations Decreasing bar graph behind magnifying glass. 3d render
Free with trial Hand drawn bar graph shows decreasing trend with downward arrow illustration. AI generated. Decrease statistics data analysis vectors Hand drawn bar graph shows decreasing trend with downward arrow illustration. AI generated
Free with trial This vibrant 3D bar graph features various colorful bars with an upward arrow, symbolizing growth and success in financial and business metrics Generative Ai. Decrease statistics data analysis illustrations Colorful 3D Bar Graph Showing Growth with Upward Arrow Design. This vibrant 3D bar graph features various colorful bars with an upward arrow, symbolizing growth. This vibrant 3D bar graph features various colorful bars with an upward arrow, symbolizing growth and success in financial and business metrics Generative Ai
Free with trial Red arrow pointing down graph shows market crash losses slump AI-generated for unique and creative designs. Decrease statistics data analysis illustrations Red arrow pointing down, graph shows market crash , losses, slump. Red arrow pointing down graph shows market crash losses slump AI-generated for unique and. Red arrow pointing down graph shows market crash losses slump AI-generated for unique and creative designs
Free with trial Children with descending graphs. Illustration of children with descending graphs. Decrease statistics data analysis vectors Children with descending graphs. Illustration of children with descending graphs
Free with trial Downward trend bar chart with red line graph. Illustrated downward trend bar and line chart showing decline. Decrease statistics data analysis illustrations Downward trend bar chart with red line graph. Illustrated downward trend bar and line chart showing decline
Free with trial A collection of twenty-four colorful flat-style financial and economic icons arranged in a grid on white background, including growth and decline charts, money bags, dollar coins, cash stacks, inflation balloons, interest rates, tax documents, budget calculators, shopping carts, delivery trucks, forklifts, global shipping, and business graphs. Ideal for illustrating banking, accounting, investment, market analysis, e-commerce, logistics, and economic concepts in presentations, websites, reports, and marketing materials. Decrease statistics data analysis vectors Colorful Set of Finance and Business Icons. A collection of twenty-four colorful flat-style financial and economic icons arranged in a grid on white background. A collection of twenty-four colorful flat-style financial and economic icons arranged in a grid on white background, including growth and decline charts, money bags, dollar coins, cash stacks, inflation balloons, interest rates, tax documents, budget calculators, shopping carts, delivery trucks, forklifts, global shipping, and business graphs. Ideal for illustrating banking, accounting, investment, market analysis, e-commerce, logistics, and economic concepts in presentations, websites, reports, and marketing materials.
Free with trial A close-up image depicting a red arrow pointing downwards positioned on a stack of documents and charts This represents a financial downturn or business decline illustrating concepts such as market crisis or economic loss A laptop is visible in the background. Decrease statistics data analysis illustrations Financial Decline Red Arrow on Stack of Documents and Charts Showing Business Downturn AI generated. A close-up image depicting a red arrow pointing downwards. A close-up image depicting a red arrow pointing downwards positioned on a stack of documents and charts This represents a financial downturn or business decline illustrating concepts such as market crisis or economic loss A laptop is visible in the background
Free with trial A man holds a sign displaying a sharply declining graph, symbolizing economic hardship. The image, generated by AI, is a powerful visual representation of market instability and financial distress. It's perfect for illustrating articles or presentations related to recession, financial crisis, or ma. Decrease statistics data analysis illustrations Declining Graph: Economic Downturn. A man holds a sign displaying a sharply declining graph, symbolizing economic hardship. The image, generated by AI, is a. A man holds a sign displaying a sharply declining graph, symbolizing economic hardship. The image, generated by AI, is a powerful visual representation of market instability and financial distress. It's perfect for illustrating articles or presentations related to recession, financial crisis, or ma
Free with trial Business decline icon with downward arrow. Loss, failure, or economic crisis symbol. Vector. Decrease statistics data analysis vectors Business decline icon with downward arrow. Loss, failure, or economic crisis symbol. Vector
Free with trial An isometric view of a bar chart with five blue bars of decreasing height, representing a downward trend. A red arrow points downwards, indicating a negative trajectory. Decrease statistics data analysis illustrations Bar chart showing a downward trend with a red arrow isolated on white background. An isometric view of a bar chart with five blue bars of decreasing height. An isometric view of a bar chart with five blue bars of decreasing height, representing a downward trend. A red arrow points downwards, indicating a negative trajectory
Free with trial Closeup of male hand analyzing financial graph with stylus. Decrease statistics data analysis illustrations Closeup of male hand analyzing financial graph with stylus.
Free with trial Declining Bar Graph with Downward Trend Arrow Illustrating Economic Loss, Financial Issues, and Market Crash. AI generated. Decrease statistics data analysis vectors Declining Bar Graph with Downward Trend Arrow Illustrating Economic Loss, Financial Issues, and Market Crash. AI generated
Free with trial Hand drawn bar graph showing a downward trend with an arrow indicating decline. AI generated. Decrease statistics data analysis vectors Hand drawn bar graph showing a downward trend with an arrow indicating decline. AI generated
Free with trial Decreasing graph icon Business chart with downward arrow Financial loss symbol. AI generated. Decrease statistics data analysis vectors Decreasing graph icon Business chart with downward arrow Financial loss symbol. AI generated
Free with trial A visual representation of a business or financial metric showing a significant decline, depicted by a series of blue bars and a descending red arrow. Decrease statistics data analysis illustrations Bar chart with red arrow indicating a downward trend. A visual representation of a business or financial metric showing a significant decline, depicted by a. A visual representation of a business or financial metric showing a significant decline, depicted by a series of blue bars and a descending red arrow
 Sign in